
4Q23 GDP: Final Cut, Moving Parts
We look at an exceptionally strong and broad series of upward revisions in the latest and last 4Q23 GDP estimate.


The movement in the 4Q23 third and final GDP estimate showed broad-based strength and upward revisions out of the consumer sector, private investment, and government lines with State and Local growth leading the way.
The range of increases tells a story of a good year ending on a very good note in 3Q23 and 4Q23 with a notably strong consumer sector as the anchor, but nonresidential lines are also impressive in the context of a tightening cycle.
We update the Biden vs. Trump line items in this note, and the reality is that 3% quarters are hard to come by in the new millennium unless preceded by periods of weakness. That was not the case here.
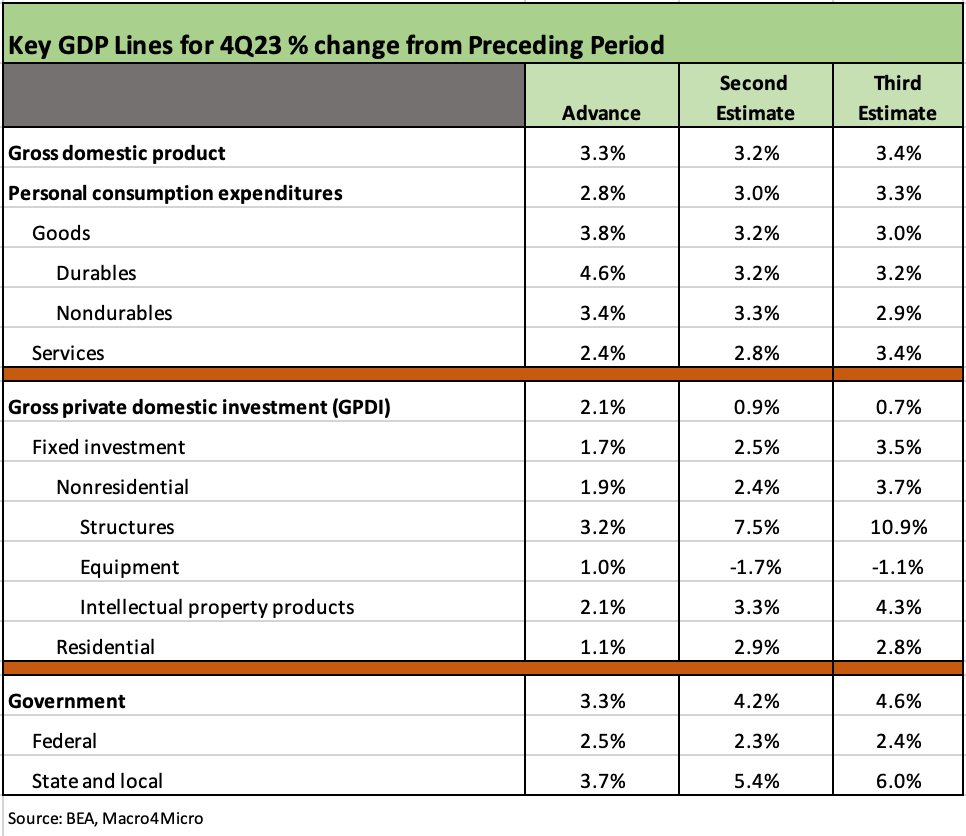
The above chart does a side-by-side comparison of the three estimates. The increases seen in the line items of each major bucket across PCE (68% of nominal GDP), Gross Private Domestic Investment (GPDI, 18% of GDP), and Government (17% of GDP) make a strong statement on the 4Q23 economic performance. (Note: the GDP totals get back to 100% net of trade deficits of approximately -3.0%).
Following the lines across the breakout above tells the favorable story, but we offer a few highlights below:
Personal consumption expenditures: The uptick in PCE to 3.3% was driven by a solid upward revision in Services, which is good news in what is essentially a services economy. That is, “good news” for growth bragging rights, but it is not such good news for the UST bulls and the 3-cut school (the 5-6 cut school is still lurking but has gone quiet). We see Goods growth ticked lower in the estimate with Durables flat and Nondurables down in the estimates. PCE inflation will be a big test tomorrow and we get more detail in income and outlays trends.
GPDI: We see a heavy weighting of upward revisions along the nonresidential fixed investment lines from +2.4% to +3.7%, but it is worth highlighting the strong moves in Structures and IP products. The Equipment decline narrowed in a positive revision of “less negative.” Durable Goods numbers this week offered some hope into 1Q24 (see Durable Goods: A Small Boost for Manufacturing Sentiment 3-26-24). We see a slight downtick in Residential, but the outlook there remains steady for starts and investment into 2024. We look at the move lower overall for GPDI as tied in part to a slightly adverse move for private inventories deeper into negative range, bringing a -0.2 hit to GDP for changes in private inventories.
Government: Government moved higher to 4.6% with Federal slightly higher and State and Local materially higher from 5.4 to 6.0%. We discussed some of the mixed messaging (a.k.a. two sets of political books) on state level economic performance vs. the depiction of nationwide economic health in a separate commentary (see Employment: Real Numbers vs. Fictitious Dystopian Hellscapes 3-9-24).
With all sarcasm intended, the ability of the state and local leaders to quantitatively spend/invest more despite what many qualitatively describe as the worst national economy since the primordial soup (i.e. Katie Britt) does raise a few questions on their tax base and their ability to spend (especially in so many states with balanced budget requirements). That is, they are doing quite well despite inflation. They brag about it locally and then change the tune in national context. In the end, the 50 states roll up to a country.
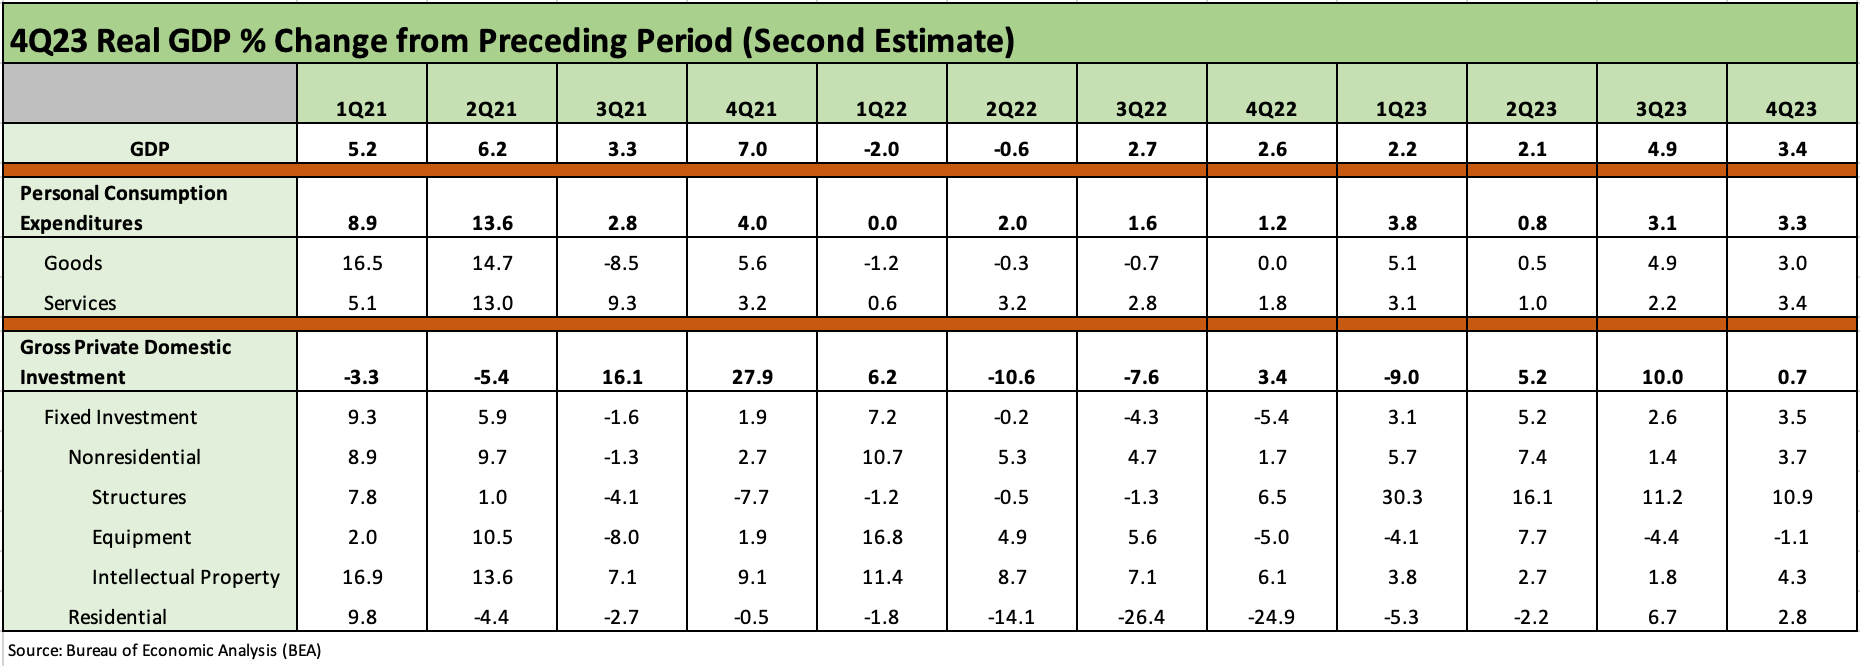
The above chart updates the main line items in the quarterly GDP results that we routinely review and update. In the links below, we look back across more angles on the mix of line items across time since 2017. When looking across the timelines and earlier updates, keep in mind the results get updated 3 times per quarter, and later revisions roll in across the years with changes in methodologies of all types.
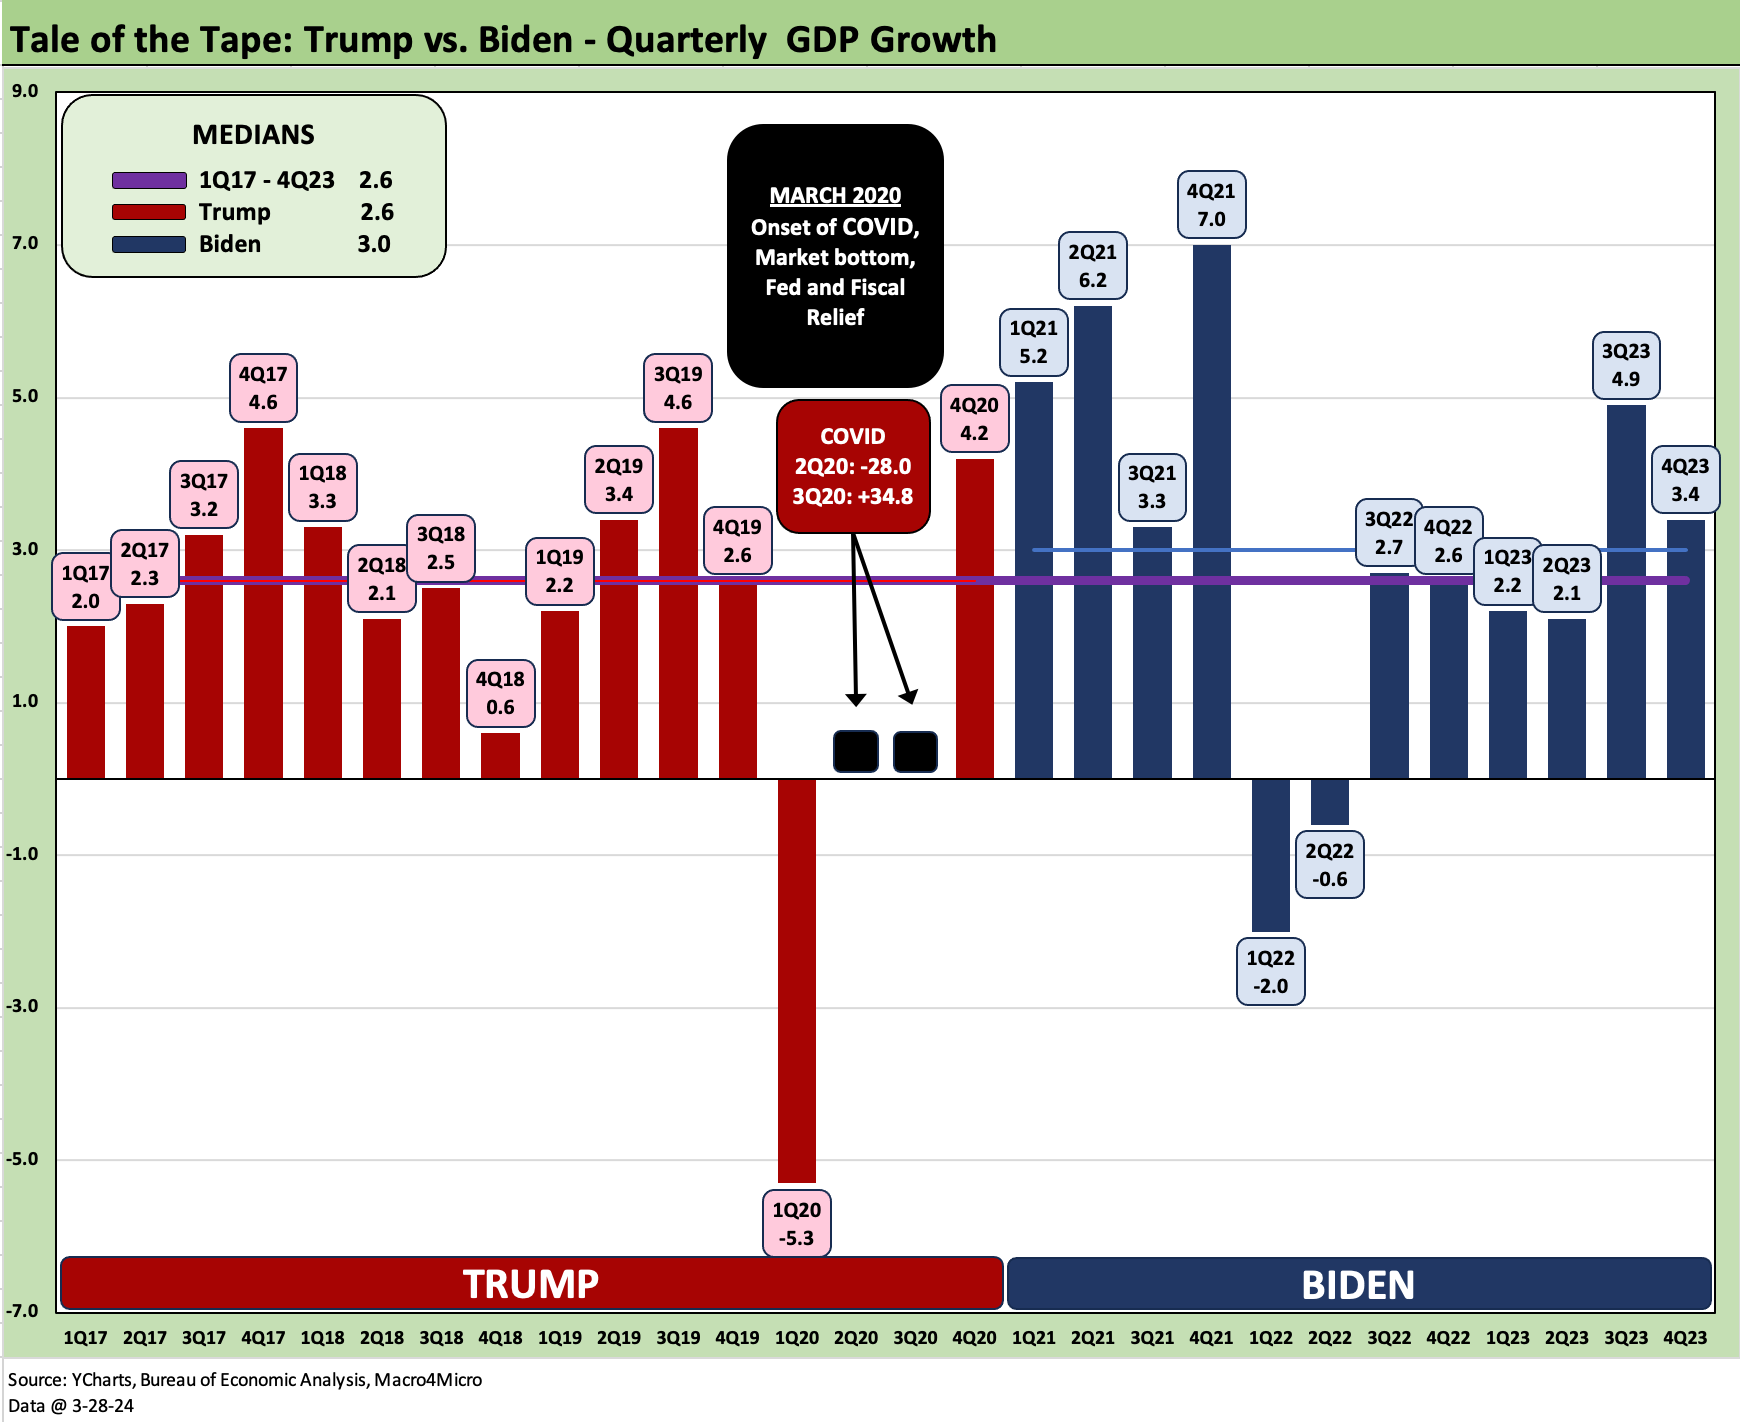
The above chart updates the scoresheet on GDP performance across the two candidates for the 2024 election. The policy debates will pick up, the ideologies will clash, what passes for personalities will be framed up, the spin will be so strong it might turn the gyroscope into a drill, but the facts are the facts. They are there for misuse but more likely lack of use.
So far, Biden’s GDP performance overall is the best since Clinton and Reagan (see Employment Across the Presidents 8-15-23). How the recent broad-based growth and very strong employment performance balances with the worst inflation performance since Carter is the dominant perception battle.
Most rational people not wielding an axe don’t give the guy in the White House all the credit or all the blame (note the GOP Congress desire to take credit for Clinton economic boom years). However, enough voters do hang all the blame on the White House often enough to potentially swing elections. It will be a long seven months or so ahead.
See also:
4Q23 GDP: Second Estimate, Moving Parts 2-28-24
GDP and Fixed Investment: Into the Weeds 1-25-24
4Q23 GDP: Strong Run, Next Question is Stamina 1-25-24
3Q23 GDP Final Cut: Swing and a Miss on 5%, Good Contact on PCE Prices 12-21-23
Tale of the Tape in GDP: Trump vs. Biden 12-4-23
Construction Spending: Timing is Everything 12-1-23
Construction: Project Economics Drive Nonresidential 10-2-23
How could the GDP not be flying along supported by an additional $1 trillion in govt debt every 100 days?
From CNBC:
The U.S. national debt is rising by $1 trillion about every 100 days
Mar 1, 2024 · The debt load of the U.S. is growing at a quicker clip in recent months, increasing about $1 trillion nearly every 100 days. The nation’s debt permanently crossed over to $34 trillion on Jan...