
4Q23 GDP: Strong Run, Next Question is Stamina
We break out the line items driving a surprisingly strong quarter and more optimistic inflation stats.


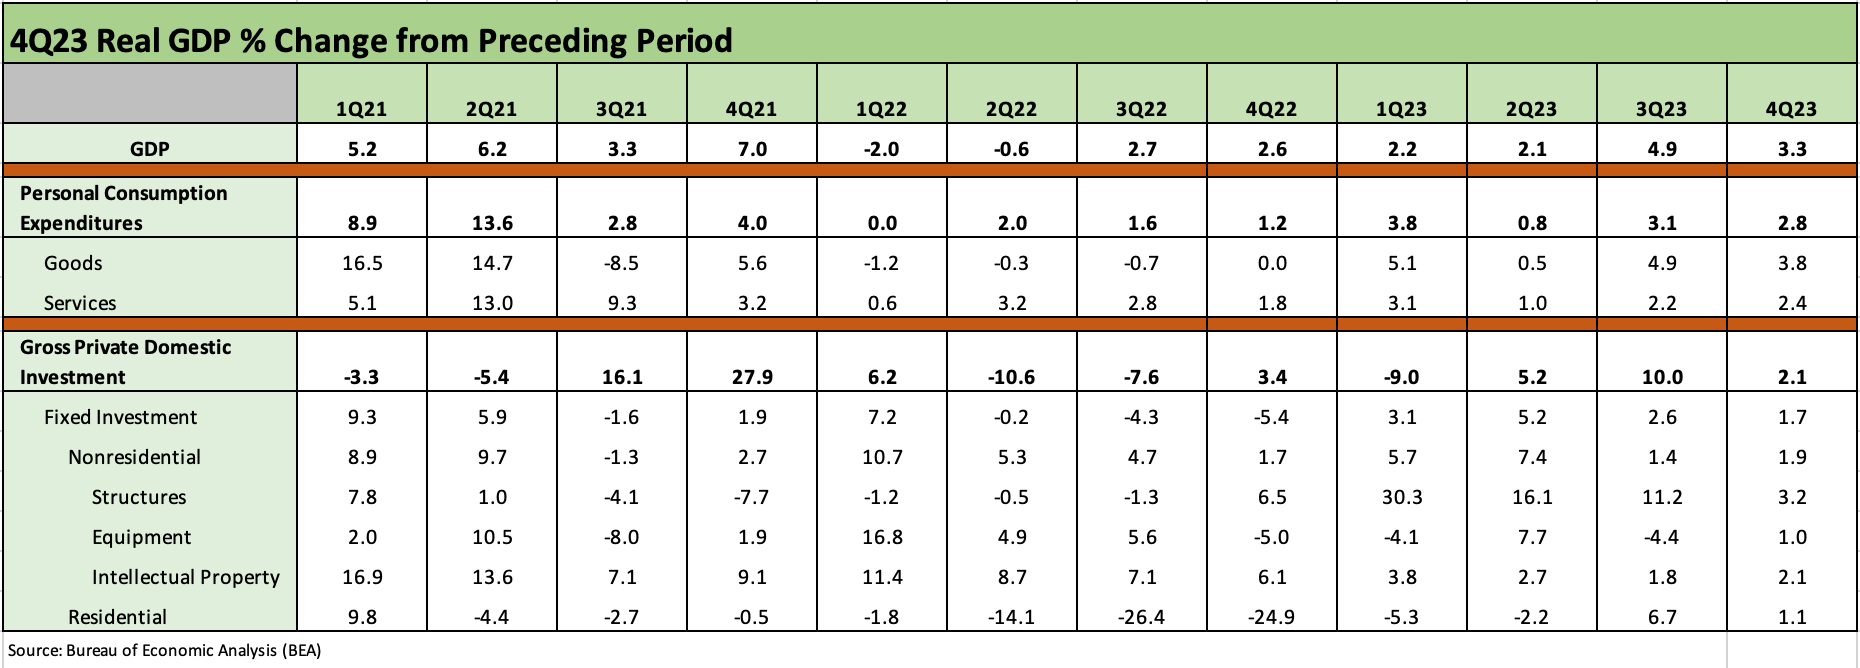
The headline GDP of +3.3% roasted the consensus forecasts and brought good news on PCE inflation as well with the annual GDP 2023 number weighing in at +2.5% after +1.9% in the tightening year of 2022 and +5.8% in the demand rebound of 2021.
The ability of the consumer to stand fast and hold its position on PCE at slightly under 3% (+2.8%) left it just short of the +3.1% seen in the final 3Q23 numbers.
The contribution to GDP from PCE then weighed in at +1.91% with Gross Private Domestic Investment (GPDI) at +0.38% and Government Expenditure and Investment adding +0.56% across the Big 3 (PCE, GPDI and GOVT) while the less predictable side dish of “net exports” served up a positive contribution of +0.43%.
The 4Q23 PCE Price index at +1.7% and Core at +2.0% was a nice input for any room with both stock bulls and UST bulls at the same table.
Another solid quarter well ahead of expectations has been the theme of the day even if well short of the outsized 3Q23 numbers of +4.9% (see 3Q23 GDP Final Cut: Swing and a Miss on 5%, Good Contact on PCE Prices 12-21-23). The revision process in the 3Q23 from start to finish saw some major swings (see 3Q23 GDP: Fab Five 11-29-23, GDP 3Q23: Old News or Reset? 10-26-23), so the line items can certainly move around.
The next two rounds will need to be watched and especially on the fixed investment lines that have been a major source of support relative to expectations when the tightening cycle was in full throttle. We will follow up with more granular detail on the fixed investment mix.
We saw some talking Fed heads already out on the screen asking, “Why change rates when the numbers are working?” and then citing employment and GDP growth as the two most obvious data points (that was Richard Fisher of the Dallas Fed). The inflation news in this release reassured the markets with a +1.7% PCE price index for the quarter and +2.0% Core. That is down sequentially from +2.6%. The “Goldilocks” word hopefully will not become a drinking game if productivity is expected to be a key driver of sustained growth. It came up in the Fisher interview and also during the panel discussion with economists on CNBC after the release.
As we look at the line items above, a big question is growth sustainability as more of the big investment programs and megaproject work sees less favorable comps and plateau or are completed (many are multiyear projects). The PCE line has ample support from demographics and employment and may see lower rates as the year goes on that supports the economics of investment in the GPDI section. As with the Fed, those views are data driven and influence inflation and Fed policy. There is “a lot of game left” in an election year.
We will follow up with some more “Tale of the Tape” comparisons across Presidential administrations from the low growth post-2000 era, but the strength the past year has been impressive relative to the tightening cycle and inflation effects on households.
As we look back across past cycles, the sustained pain along line items such as residential and corporate investment have periodically been deep and showed sustained contraction. All you need to do is go into the BEA database and print out the line items for a look at what GPDI agony can look like as cycles weaken or the market is absorbing shocks of whatever sort (financial system, oil prices, etc.) That has not been the case this time around for a range of reasons. That is a topic for another day.