
GDP and Fixed Investment: Into the Weeds
We drill down into some notable categories that flow up into nonresidential investment with a quick comment on the government side.


We look across some of the lines within Gross Private Domestic Investment for a view on trends in investment and consumption.
The fiscal policy actions and private-public tag team of the past few years drove a substantial amount of economic activity and fixed investment.
One of the more important stabilizing factors during the worst inflation spike in four decades were the GPDI and Government spending lines that brought record payroll counts that helped keep the PCE beat going.

The above chart breaks out the Structures vs. Equipment history. We lift these from the GDP accounts under the broad category of Gross Private Domestic Investment, Fixed Investment, and Nonresidential. As we detail further below, the GPDI line is almost 18% of GDP.
The Equipment line is the bigger slice vs. Structures but both can be loosely viewed as “capex” and driven by the economics of spending. That can be new capacity or spending on existing capacity to improve efficiency via automation. These are old themes, but they still matter. Fixed investment can be influenced by confidence in growth potential, a search for profits, or fueled by tax incentives (e.g. Trump Dec 2017 tax cuts) that factor into the return on the assets. It is both complicated and simple at the same time. Companies invest for a reason.
As we look at the investment levels in the time series, the maximum numbers for both Equipment and Structures are seen in 4Q23. That is not too shabby considering a massive tightening cycle and inflation setback in 2022.
The next leg of the journey gets back to such topics as the reshoring trends and whether more supplier chains will return to the US (vs. Mexico). The semiconductor investments (CHIPS Act) get a lot of headlines for new capacity and the same is true for EV batteries. The question is how many of the well-established supplier chains (e.g. autos) will return home and whether the government creates incentives for it to happen.
The White House can simply attempt to distort the economics of the decision (tariffs) and then set off retaliatory reactions hurting other sectors. As Trump learned the hard way in 2018-2019, companies who invest for the long term that see erratic and uncertain characters running policy and know the risks of party pendulums swings as a major factor can just decide to wait. Companies can buy back shares instead. (Note: Given Trump’s current 10% universal tariff proposal, I use the term “learned” loosely).
When Trump championed record corporate tax cuts to bring incentives to equipment (basically capex tax expensing for equipment), the optimism was high. The debate over whether the equipment incentive would be a “sugar high” fix and pull-forward effect did not get adequately tested since capex planning was quickly derailed by trade clashes that spooked private sector investors. The weak fixed investment trend in 2019 in equipment drew 3 fed funds cuts. Weak corporate investment was the reason. (Just go look at the FOMC statements for their reasoning.)

The above chart gives some raw numbers by major category for Structures and Equipment. Considering the magnitude of the tax incentives, the reaction in equipment was weak even if not a contraction. We show the changes in the run rates from 2013 and the days of post-crisis ZIRP across COVID and then through the latest numbers to 2023. We include the running dollar delta and % change. We break out the last few quarters of data, but we use annual numbers from 4Q22 back.
At the very least, the line items demystify what is under the hood. That timeline runs from Obama’s 2nd term across Trump’s one term and then into Biden. We would flag the wild swings in the Mining/E&P line across those periods. The debt financed shale boom saw a peak in 2014.
The soaring manufacturing line under structures from 2022 to 2023 might be worth someone highlighting to Biden and Trump. They can compare notes. “Manufacturing Renaissance” as a term got airtime under both Obama and Trump. It was a little more dark ages than renaissance. The numbers don’t show it above until 2022 after a lot of legislation.

Structures get some more detailed line items above across more categories including Commercial and Healthcare and in the E&P mix within the broader mining category. We already addressed the soaring manufacturing line in the prior chart.
The “Office” line will draw some attention since it has grown so much during a ZIRP heavy period. The range of office types and its smaller share of the new construction markets needs a more complete story as discussed in other commentaries (see Construction Spending: Timing is Everything 12-1-23, Construction: Project Economics Drive Nonresidential 10-3-23, Construction Spending: Demystifying Nonresidential Mix 5-9-23). Office as a category is a mixed and diverse story line with older properties or overleveraged legacy deals more the problem than new construction.
The most notable line we see is the extraordinary growth of the Warehouse category as the freight and logistics line continues a revolution in managing working capital and freight and distribution. Amazon is the leader in such services now as we covered in our recent FedEx report (see FedEx: Stability Counts, Complexity Challenges 1-23-24, Credit Crib Note: FedEx Corp 1-22-24).

The above chart drills down into the equipment lines across the various buckets. We do the same drill on the deltas across the 10 years with the dollar changes from 2013 to 2023 on the right side of the chart, along with the percentage changes.
We see a very well diversified mix of asset lines. We highlight what did not happen in the 2018-2019 line for equipment. The targeted tax policy of stimulating a boom in equipment investment with the tax cuts did not happen. It was great for buybacks and dividends though.

The above chart includes the trend line for Intellectual Property (IP) products alongside the Equipment line. We already addressed Equipment in earlier charts in this report, but we thought the two side by side would underscore how investment in technology climbs steadily and is accelerating. Basically, you can’t invest in equipment without a lot of IP, but you can invest in IP regardless and especially in a services-intensive economy.
The breadth of markets and strength of the economy is heavily tied to tech products, and the range of markets is among the various reasons why the economy is less cyclical than ever and more diversified and resilient than in past cycles. War, gross recklessness in lending and excess credit (including counterparty risk), creating a domino backdrop in the financial system, or rank stupidity or evil intent in Washington can offset that diversity and balance of the economy at times. Of course, we now add pandemics to the list.
We saw some of that long tailed risk in cycles of past (certainly the 2008 meltdown) but it takes a lot to rattle such a large, diverse economy. The Washington crowd is creeping up in the threat meter. As one orange-faced genius said in a CNN town hall meeting “If they don’t get all they want, they should do a default” (referring to US treasury debt).
Interestingly, the IP line pushed through the credit crisis and it is a very smooth upward sloping line.
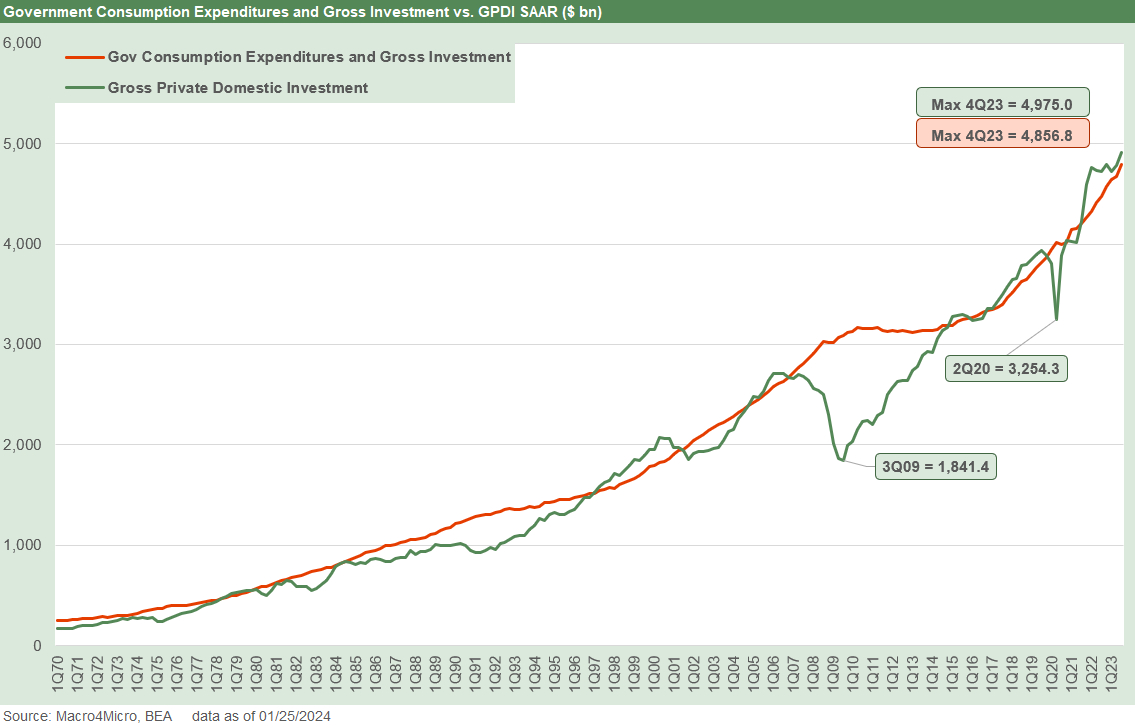
The above chart just gives an easy visual on the scale and growth pattern of government consumption and expenditures vs. gross private domestic investment. GPDI comprises 17.8% and government spending is around 17.4%. For the overall mix, PCE was 67.6% of 4Q23 GDP, GPDI 17.8%, Government at 17.4%, and net exports a deduction at -2.8%.
Within the government line, the state and local share is 63% of the total government line. Within Federal and its 37% share of the government consumption and expenditures line, the defense part of the budget is more than half of that (~56%). State and local budgets are the main event in that GDP line ex-defense.
On that note, a quick budget rant as we all wait to see whether part of the government closes down…
When people whine about their economy and lives, they might want to look at state and local officials while they are at it. What are they doing about the economic conditions in their states and cities? Those states with no income taxes have some issues at times that might require some government investment at the state and local level.
There is a reason why governors and legislative talking heads at the state and local level always want to point fingers at Washington (often justifiably), but they do not blame the “home team” unless it’s the “other party.“ They need a mix of shared excuses and common enemies. Very often those out-of-state congested urban markets they deride generate Federal tax dollars that subsidize their states with net payments of taxes to Washington and who pay in a lot more than they receive (e.g. the Northeast).
There are many noisy states on the dole funded by those derided “coastal elites” and “poorly managed northern cities” and “radical leftist” suburban middle and upper middle class who simply will not get the thank you note they deserve for subsidizing them. The need to show gratitude is bad for one’s self-image when everyone else (anyone but you) caused your problems.
There is a reason that detailed studies are not performed annually that highlight which states take in more in income tax funds redeployment from Washington than they pay in. It is in fact the majority of states that fit that bill. Some of the loudest mouths from the most notorious moocher states (to borrow an Ayn Rand term) are some of the biggest net takers of government funds vs. what they pay in. Those states tend to have a high “skull share” of funny red hats.
Congress should include such an analysis requirement be done annually in every future budget bill. There is an obvious reason they do not. The Fair Tax meatheads would like to extend that same approach to sales tax so they can keep the cross-state subsidy going.
Too bad they do not allocate electoral votes (or Senate seats) by the share of the Federal budget funded by the respective federal income tax payments provided by that state. People have been writing books lately with catchy titles such as “tyranny of the minority.” Good times.
Contributors:
Glenn Reynolds, CFA glenn@macro4micro.com
Kevin Chun, CFA kevin@macro4micro.com