
Fixed Investment in GDP: The Capex Journey
We look at the underlying Structures and Equipment lines across time.


We drill down into the subcategory details of the Structures and Equipment sections of the GDP Fixed Investment lines.
We frame 10 years of granular detail on the mix of trends across these two critical investment subcategories.
The 3Q23 Structures and Equipment numbers were each slightly under the 2Q23 all-time highs in nominal terms, but the rate of growth is slowing after a heady run.
One of the big winners of late has been Manufacturing, and the impact of the mega projects is evident in 2023 trends.

The above chart details in nominal dollars the long-term time series for investment in Structures and Equipment. We look across the decades from the 1970s and include the most recent 3Q23 GDP release (see GDP 3Q23: Old News or Reset? 10-26-23). In the charts further below, we get into some of the supporting data that is found in the next layers below the headline totals.
The time series in the chart details cyclical pain and risk aversion including the post-TMT years and again after the credit crisis. We show the pre-TMT crisis highs and then the trough lows. The TMT years saw very heavy investment in Telecom and Power that was reeled in with the high-profile credit crunch and headline bankruptcies.
The 2008 crisis and near systemic financial meltdown that unfolded needs no introduction and neither does COVID. The Hi-Lo range after the credit crisis of 2008 was over a $460 bn swing down in the combined totals of Structures and Equipment investment. The bounce off the COVID 2Q20 low to the 2Q23 high was an increase of over $611 bn for the combined Structures and Equipment line. That adds up.
Both 2008/2009 and 2020 offer evidence of why government and Fed involvement are critical at key junctures. Those who say, “Let the markets work” usually mean “except when my supporters need help” or alternatively they are thinking “I am ignorant of economic risks and ignore history anyway. I just care about today’s power grab.”
The hard left and hard right enjoy the “Main Street vs. Wall Street” theme as a means to recruit and divide with no sense of (and/or probably no interest in) how credit expansion and contraction effects flow through the credit markets into these GDP lines and thus jobs and prosperity for their constituents.
Credit markets have outsized significance in the GDP and employment story…
The evolution of funding alternatives and credit structural change is a genie that cannot get put back in the community bank bottle as much as some Washington characters might try while spinning populist tales from the left and right. Those are debates for other days, but these Structures and Equipment lines would be dramatically lower without a functioning credit market. Massive EV and battery plants in the South or North do not get built by passing the hat. The same for LNG facilities and related infrastructure.
The Wall Street bashers on the left and right can argue that the tradeoff is “Main Street vs. Wall Street” or perhaps more accurately that Main Street is a human shield for Wall Street, but Main Street would be broken down and full of tumbleweeds without the capital markets. The unemployment office would be busy though. I remember how busy my hometown’s unemployment office was in the 1974-1975 recession (an old industrial town getting slammed by secular change).
It takes capital to expand and reinvest and especially during periods of rapid change in regional, national, and global economies. Sometimes it requires borrowing to simply survive. I recall working on a Weirton Steel bond in 1989 that was essential to survival. It only lasted so long.
An important underlying theme is that the diversity of investment dollars across that level of fixed investment presents an impressive asset base. Even in a services-heavy economy, the range makes the cyclical growth threats less volatile in aggregate relative to the long-ago days when an auto or steel strike could generate a major move in quarterly GDP.
The COVID crisis and a systemic bank crisis managed to rattle the numbers in the time series above, but the range and scale across the combination of the manufacturing sectors and services industries makes for less volatility. That means generally slower growth but also less exposure to a GDP collapse. That is why systemic government debt risk has been such a focus. That scale of a problem can last and do damage if not addressed.
The breadth and diversity of investment helps the cyclical story…
We think a scan of the numbers across the breadth and depth of the categories for Structures and Equipment is reassuring just on the flavor since the line items underscore the scale and diversity of the Fixed Investment headline category.
Many of the categories do march to their own secular and cyclical beat. The total for Fixed Investment SAAR is $4.8 trillion (17.4% of GDP) at 3Q23 and runs neck-and-neck and slightly ahead of total “Government Consumption Expenditures and Gross Investment” (includes all Federal/Defense and State and Local).
If we look at the Gross Private Domestic Investment (GPDI) line vs. all Government spending and consumption, the two combined add up to over one third of GDP (35%) with GPDI slightly higher as of 3Q23. In the Government buckets, the State and Local government line is 63% of all Government with Defense around 21%. That leaves Federal ex-Defense at 16% of the total Government line. Some political cliques want to bring down the walls of Jericho over pieces of that 16%. To be clear, that 16% of the Government Total is 2.8% of GDP. Shutting down the government or defaulting on a debt ceiling looks especially petty (insane!!) in that context.
We detail the timeline of Government vs. GPDI in the chart below more as an “FYI” comp. For all the noise on the screen about spending, this gives it a measuring stick vs. private investment. The main event is still PCE in the GDP accounts in the 68% area of total GDP.
As the chart shows, Government spending is at least not volatile even if excessive. We would think more people should pay attention to candidates running on a “make more people unemployed” platform. Fair enough, as long as they admit it and are clear.

In this piece, we look more narrowly at Equipment ($1.38 trillion or 5.0% of GDP) and Structures ($832 billion or 3.0% of GDP). We see the Structures and Equipment buckets as the rollup of capex lines (capex in the non-GAAP sense) for many industries that get influenced by everything from corporate sector private investment needs to tax policy to legislative initiatives such as Infrastructure bills, Energy transition programs, Semiconductors (CHIPS Act), etc.
The fixed investment themes run the gamut depending on the industry and the projects. Various themes around infrastructure (roads/bridges/waste/water/flood protection/drainage, etc.), semiconductors, clean energy, propulsion transitions, LNG, etc., have been picked over along the way.
Transitions bring a lot of capex and investment in personnel, IP, and equipment/structure. If you are not an auto trade rag reader, just google around for battery plants and the supplier chain for those plants (mining etc.) for some flavor. That’s a lot of direct jobs and reverberating jobs and revenues in related services and supporting businesses from freight and logistics to warehouses to real estate and food and beverage.
The targeting of the US for investment is impressive and notably by offshore entities aiming at consumers in this market. That includes some OEMs who bring part of their supplier chain along for the ride.
The other two big categories that roll up into Fixed Investment include “Intellectual Property Products” ($1.5 trillion or 5.4% of GDP) and Residential ($1.1 trillion or 3.9% of GDP). The Intellectual Property (IP) bucket is a separate topic for another day but certainly connotes “Tech” while Residential is something we cover in detail in other macro and industry level research. The chart below hammers home the steady growth of IP across cycles and crises and the higher rate of growth since the late 1990s. The IP line is also a case study in low volatility and reliable growth.

In the chart above, we plot Intellectual Property Products Investment as a frame of reference vs. the Fixed Investment “Equipment” line. There is more than a little blurring of the lines across Equipment and IP investment (whether it is accounted for as capex or expense under GAAP).
The reshoring and onshoring wildcard for Structures and Equipment…
Strategic decisions on “where to build” and how to encourage US-focused capex has been a hot political topic since Trump billed himself as “Tariff Man” and sent many free trade GOP stalwarts into hiding after failed attempts by brand name leaders in his administration to dial him back.
Back in 2018 when Washington went tariff crazy, the ability for companies to plan long term and even intermediate term was impaired since you did not know if you could invest without all the tariffs getting pulled across administrations and changes in the party lineup. The Biden team has now held the line on tariffs even if they rebadged some as quota deals and mutual agreements for purposes of diplomacy (see Trade Flows: Deficits, Tariffs, and China Risk 10-11-23, Midyear Trade Flows: That Other Deficit 8-9-23).
The brief dips in capex and retaliation to tariffs were described by some of the free trade crowd back in 2018-2019 as “undoing the benefits of Trump’s tax cuts.” The ag sector suffered badly in the natural China retaliatory response while European responses to tariffs were more tactical and measured. For example, Europe took actions targeting products in states with GOP leaders’ favorite products such as Bourbon in Kentucky (McConnell) and cranberries in Wisconsin (home of leader Paul Ryan).
The questions for those who needed to make investment decisions revolved around tariff policies. The main decision points looked something like this:
Timing of commitments to reshore/onshore: If the “next guy” (which became Biden) reverses Trump, then some projects are better off postponed since the US based supply operation might immediately become uncompetitive. We now know Biden is every bit as protectionist as Trump even if Biden is less obnoxious in tariff-induced flexing and preening like an insecure teen. The economic issues are the same in substance for Trump or Biden. That consistency in tariff plans (even if rebadged as mutual quota agreements and not Section 232 National Security tariffs against allies) can change the risk of making the commitment to invest in the US. The risks are lower, and the planners can more reliably factor in more variables into project economics.
Fear of retaliation: The zero-sum game of “we tariff them, they tariff us” makes it a zero-sum game for the usual Washington special interest games and lobbying (agriculture, steel, nonferrous metals (aluminum), autos, forest products, energy, etc.). If the ag sector gets hammered with retaliation (a certainty with China), then whoever is in the White House can offer bailouts (that is one area where he can count on the bipartisan support given the swing states in the ranks of top ag and manufacturing states). The ability of China to take more aggressive action (e.g., rare earths, recent China graphite headlines) to counter US tariffs have not even been fully leveraged by China yet (think pharma supplier chain, etc.).
Tariffs will remain a hot topic: Trump the candidate recently proposed a 10% tariff on all imports (announced during one of his ad hoc Fox News interviews), so tariffs will remain a hot topic in an election year. The uncertainties of what that would mean is a major risk variable with retaliation costs at the top of the list. Maybe somewhere in here the tariff debate will get Trump to admit “buyer pays” and it is a tax on US parties. He might even admit that he collected zero from China and had to charge taxpayers for the bailout tied to retaliation. Discussing who pays the tariffs is another good reason to duck debates. The 10% tariff even got backup in an opinion piece in the Wall Street Journal this week, where the writer neglected to mention the downstream effects of “who pays.” The politics of reality avoidance is going to get fresh legs in an election year.
“Build here” effects of protectionism…
That “sort of consistency” in protectionism amidst all the other political insanity means investments by companies in the US (or Mexico/Canada) can be managed with more optimism that there will be consistency in trade policies and notably on tariffs. That does not mean it is good for the economy but would be good for fixed investment (the consumer issue and margin impact for companies is a related debate).
If anything, the tariff framework ahead might even get more onerous for global supplier chains. That means building in the US has less risk (at higher costs). We have already seen that dynamic in EVs and batteries. Targeting growth in joint ventures as an investment policy is how China built a lot of its infrastructure. The US can take the same approach using tariffs even if it drives a dagger in the already-crippled WTO and starts more trade wars. That is the basics. The trick is getting advocates of tariffs to tell the truth about the costs and economic impacts.
Getting into the underlying…
In the three tables that follow, we use the 4Q SAAR rates looking back to 2013. For the most recent period, we use the trailing 4 quarters where we break out each quarter. We then frame the delta vs. 4Q13.
Some industries have distinctive profiles and cycles with Structures totals in E&P getting heavily damaged after the start of the late 2014 oil collapse and saw deep cuts to an early 2016 low. The “shale sector” (note: “shale” is a bit of a misnomer for much of the investment) saw records shattered in the growth rate of E&P production.
Some sectors have seen some secular tailwinds such as Data Centers (even if that has been debated a lot) and others are seeing government support (EV assembly plants, battery plants, semiconductor investment, etc.). Demographics are the friend of many investment categories (Health Care) while the rise of tech drives a lot of related equipment upgrades and investment across many lines.
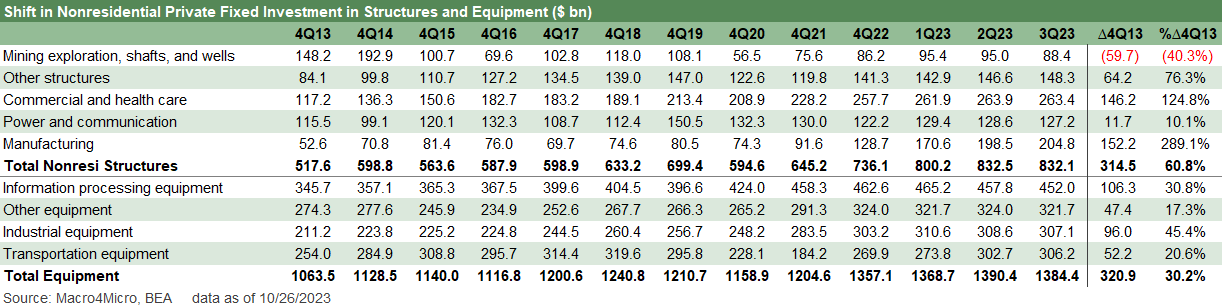
The above table shows the combined headline subcategories for Structures and Equipment as detailed in the GDP release (Table 3) and in the supporting schedules and underlying data provided by the BEA. The PCE line is always the main driver at just under 68% of the $27.6 trillion GDP.
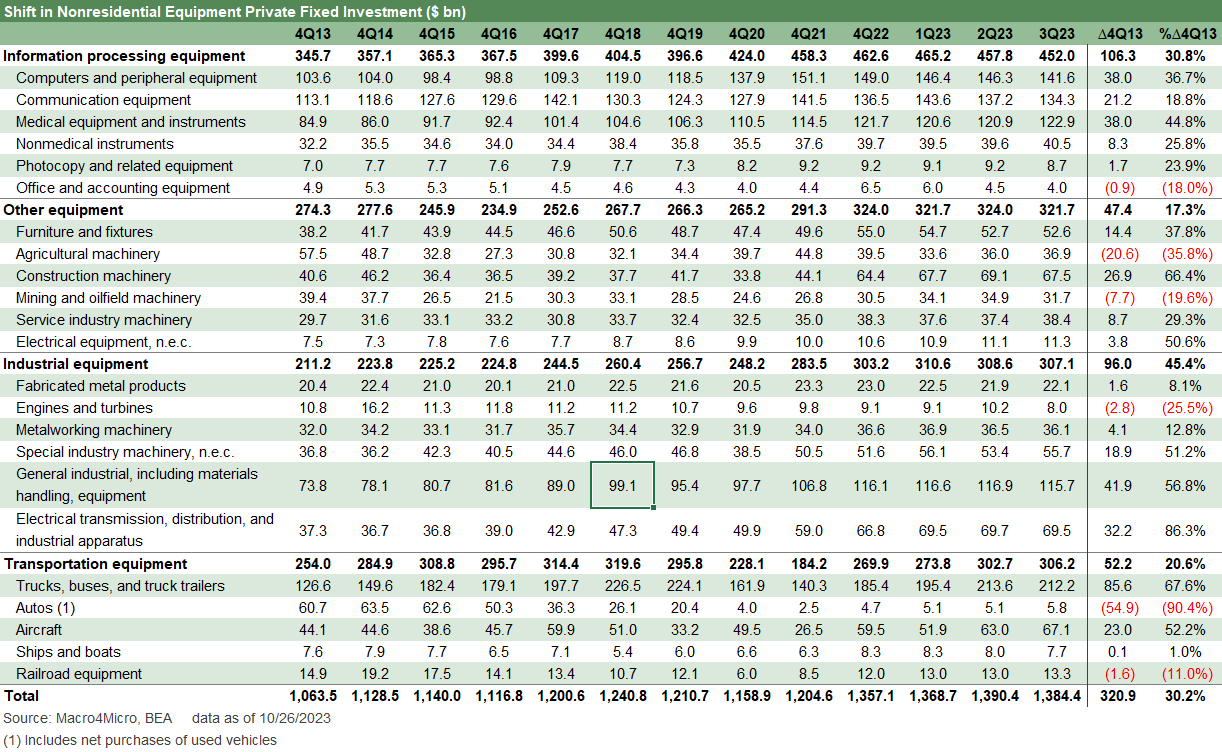
The above chart gets into the weeds for Equipment with the Information Processing bucket in the lead at around one third of the Equipment line followed by a balanced mix across Industrial Equipment, Transportation Equipment, and an eclectic mix of equipment subcategories under “Other Equipment” that includes Construction, Agriculture, Oil Service Equipment (as opposed to the larger oilfield grouping in Structures in the E&P line), Furniture/Fixtures, and Service Industry Equipment.
The quirkiest category is Transportation Equipment given the nature of how Autos are accounted for when dealers buy used cars or on trade-in and those are netted against new car sales. Those are two large gross numbers driving in different directions and subject to mini-cycles as vehicle inventories turn over.

The above chart drills down into more Structures categories, and we see the biggest growth in Manufacturing. That has been a fact of life in the nonresidential construction data as we have seen strong growth this year (see Construction: Project Economics Drive Nonresidential 10-2-23, Construction Spending: Demystifying Nonresidential Mix 5-9-23).
If you believe that Manufacturing investment and employment has been the biggest multi-decade setback for the US, the trend is very good news and has ramped up dramatically over the past two years. Trying to get anyone to treat that as a bipartisan fact is a challenge.
The issuer level evidence in capex and industry support is readily available on company conference calls and earnings releases. Among our favorite sources of trench level confirmation is with such names as Caterpillar and United Rentals (see Rental Equipment: A Cyclical Confidence Booster 9-15-23). CAT reports on Halloween while United Rentals affirmed full year guidance this past week.
We can also look to the budgets in the auto sector in EV transition spending. Those are starting to run into potential downward revisions of forecasts. LNG costs and related capex are also easy enough to chase down in the Midstream space. Needless to say, there are many billions flowing into new mega projects.
Commercial real estate asset risk…
What is not getting enough financial data visibility is the depth of asset risk at banks in commercial real estate that tends to get so much headline space. The 3Q23 earnings season did not shake out a lot of clarity there despite some bumps in provisioning. We have seen very ugly cycles before in CRE (that is for sure!) and especially in the late 1980s and early 1990s (see UST Moves: The 1990-1991 Risk Factor Pig Pile 10-24-03, UST Moves: 1988-1989 Credit Cycle Swoon 10-20-23).
CRE also was swept up in the excess of the credit bubble but was still short of the early 1990s pain. It will take a lot to go wrong from here for that scale of problem to be revisited. That said, rising rates give CRE bears plenty of ammo since the UST curve can be a dagger in real estate cycles and valuation.
For now, there is plenty of construction and capex in Structures and Equipment that is supported by sound economic rationales. They also are based on the predictability of policy goals that could be less predictable as an election year gets underway.
Contributors:
Glenn Reynolds, CFA glenn@macro4micro.co
Kevin Chun, CFA kevin@macro4micro.com