
4Q23 GDP: Second Estimate, Moving Parts
We see some material moves along the line items in the 2nd estimate for 4Q23 GDP even if we ended up almost in the same place at the headline level.


We see some big swings across the line items even if the 2nd estimate headline number only ticked down from 3.3% to 3.2%.
The movement in the Fixed Investment and Residential lines tend to be the ones subject to wider variances across estimates with GPDI overall cut in half in the 2nd estimate with Structures materially higher and Equipment down into the negative zone. Residential rose sharply from the advanced estimate.
Government investment rose by just under a point with State and Local driving the increase and Federal down slightly in the 2nd estimate.
On a separate note, the contribution from Private Inventories moved from flat to a -0.27 reduction in the headline GDP numbers and the net export line was +0.32%.
In this quick note, we look at the line-item deltas below for the BEA 4Q23 GDP numbers. These are the main line items we look at each quarter from Table 1 of the release (see 4Q23 GDP: Strong Run, Next Question is Stamina 1-25-24). Earlier, we broke out the line items in Nonresidential behind the headline numbers when the initial wave of advance numbers came out (see GDP and Fixed Investment: Into the Weeds 1-25-24).
We break out the before and after in the following chart:
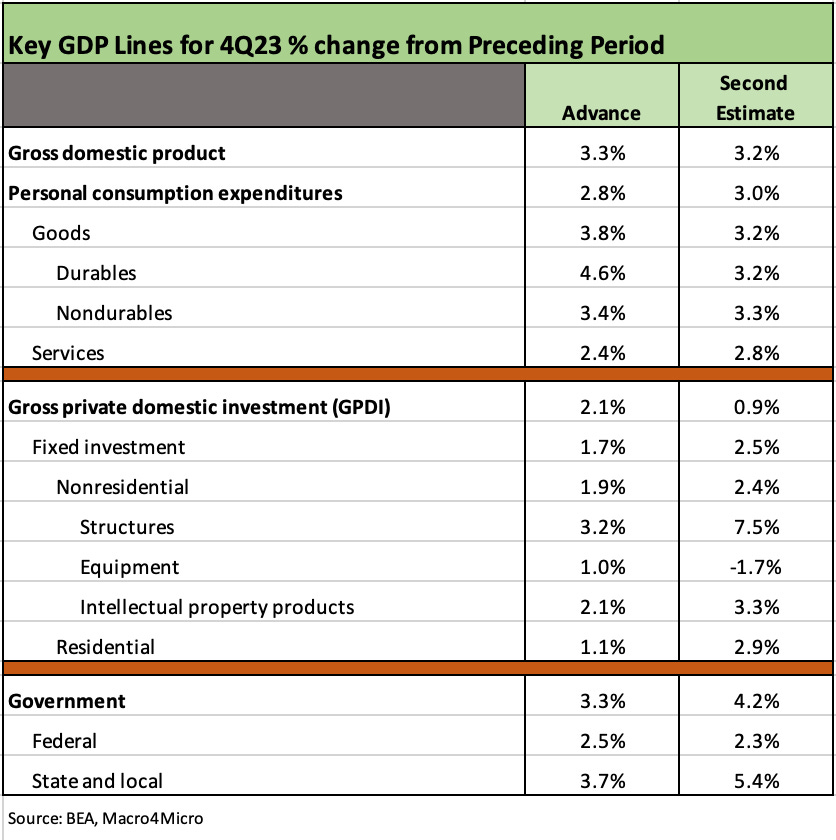
The chart shows some notable swings that include increases in PCE from the first estimate. That is important given the outsized weighting of PCE at over 2/3 of GDP.
The sharp increase in Structures has numerous factors we addressed in the original set of numbers (see links at bottom) with the mega-projects leading the way and infrastructure, CHIPS Act, and IRA in the tailwinds. We would keep the Equipment line on the radar screen with manufacturing muddling, autos potentially at a plateau, and now aircraft in a mess with defense spending under siege by a small subset of House luminaries (see Durable Goods: Forced Landing 2-27-24).
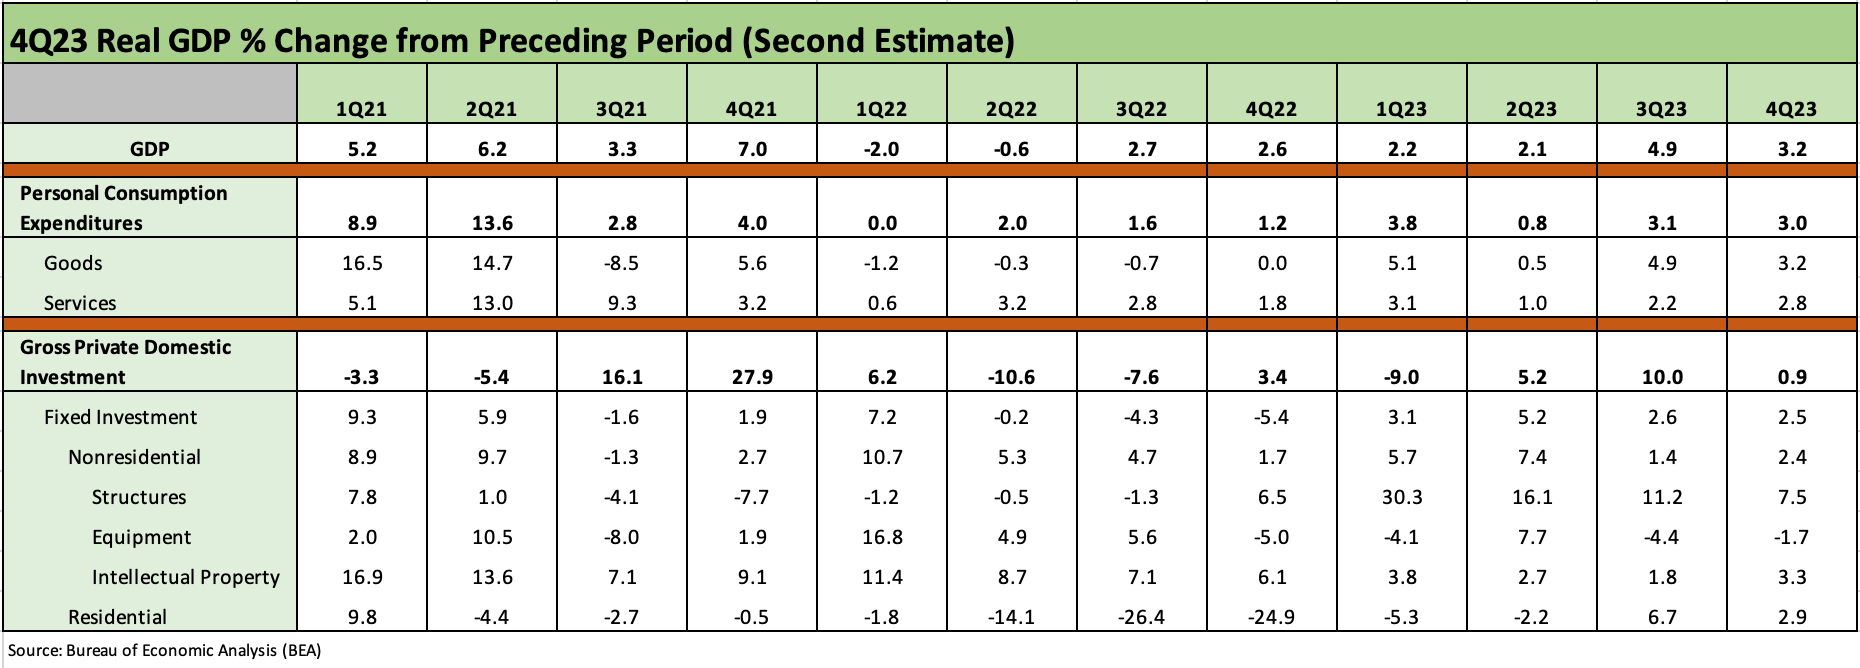
The above chart updates the time series tables for the PCE and GPDI lines since the post-COVID rebound of early 2021. With the election year upon us, there will likely be little focus on these numbers (especially from one candidate, who lays claim to the “greatest economy ever”) given the intrinsic avoidance of the factual in political dialogue and the usual retreat to formulaic, adjective-heavy discussion of which GDP line is doing what. The facts are there on jobs and economic growth for those who look.
On an interesting note, the trade deficit line has been a net positive contribution to GDP for 7 straight quarters (Table 2 of the GDP release and Trade Flows 2023: Trade Partners, Imports/Exports, and Deficits in a Troubled World 2-10-24). The contribution of Private Inventory was a net deduction of (0.27%) for 4Q23 (also Table 2).
See also:
Durable Goods: Forced Landing 2-27-24
GDP and Fixed Investment: Into the Weeds 1-25-24
4Q23 GDP: Strong Run, Next Question is Stamina 1-25-24
3Q23 GDP Final Cut: Swing and a Miss on 5%, Good Contact on PCE Prices 12-21-23
Tale of the Tape in GDP: Trump vs. Biden 12-4-23
Construction Spending: Timing is Everything 12-1-23
Construction: Project Economics Drive Nonresidential 10-2-23