
Footnotes & Flashbacks: State of Yields 2-4-24
We look at a volatile UST swing the past week as the FOMC disappoints UST bulls on timing when the macro data is favoring a grind toward lower inflation.


Long UST gyrated as the FOMC disappointed the UST bulls even with some relatively favorable inflation indicators that came out just before payroll spiked and drove a partial retracement in an otherwise strong week for duration.
The earnings season overall has been enough to keep earnings expectations on the positive side of the ledger but sufficiently mixed to stabilize lower inflation sentiment with a fresh dose of supportive data flows for the 4Q23 and Dec 2023 period.
Consumers have been solid on the macro data front but also got some reaffirmation in company reports including some signals of strength from Amazon to GM this past week.
The regional bank noise during the week and a few more asset quality alarms going off will keep the Fed on alert for any pressures in the financial system.
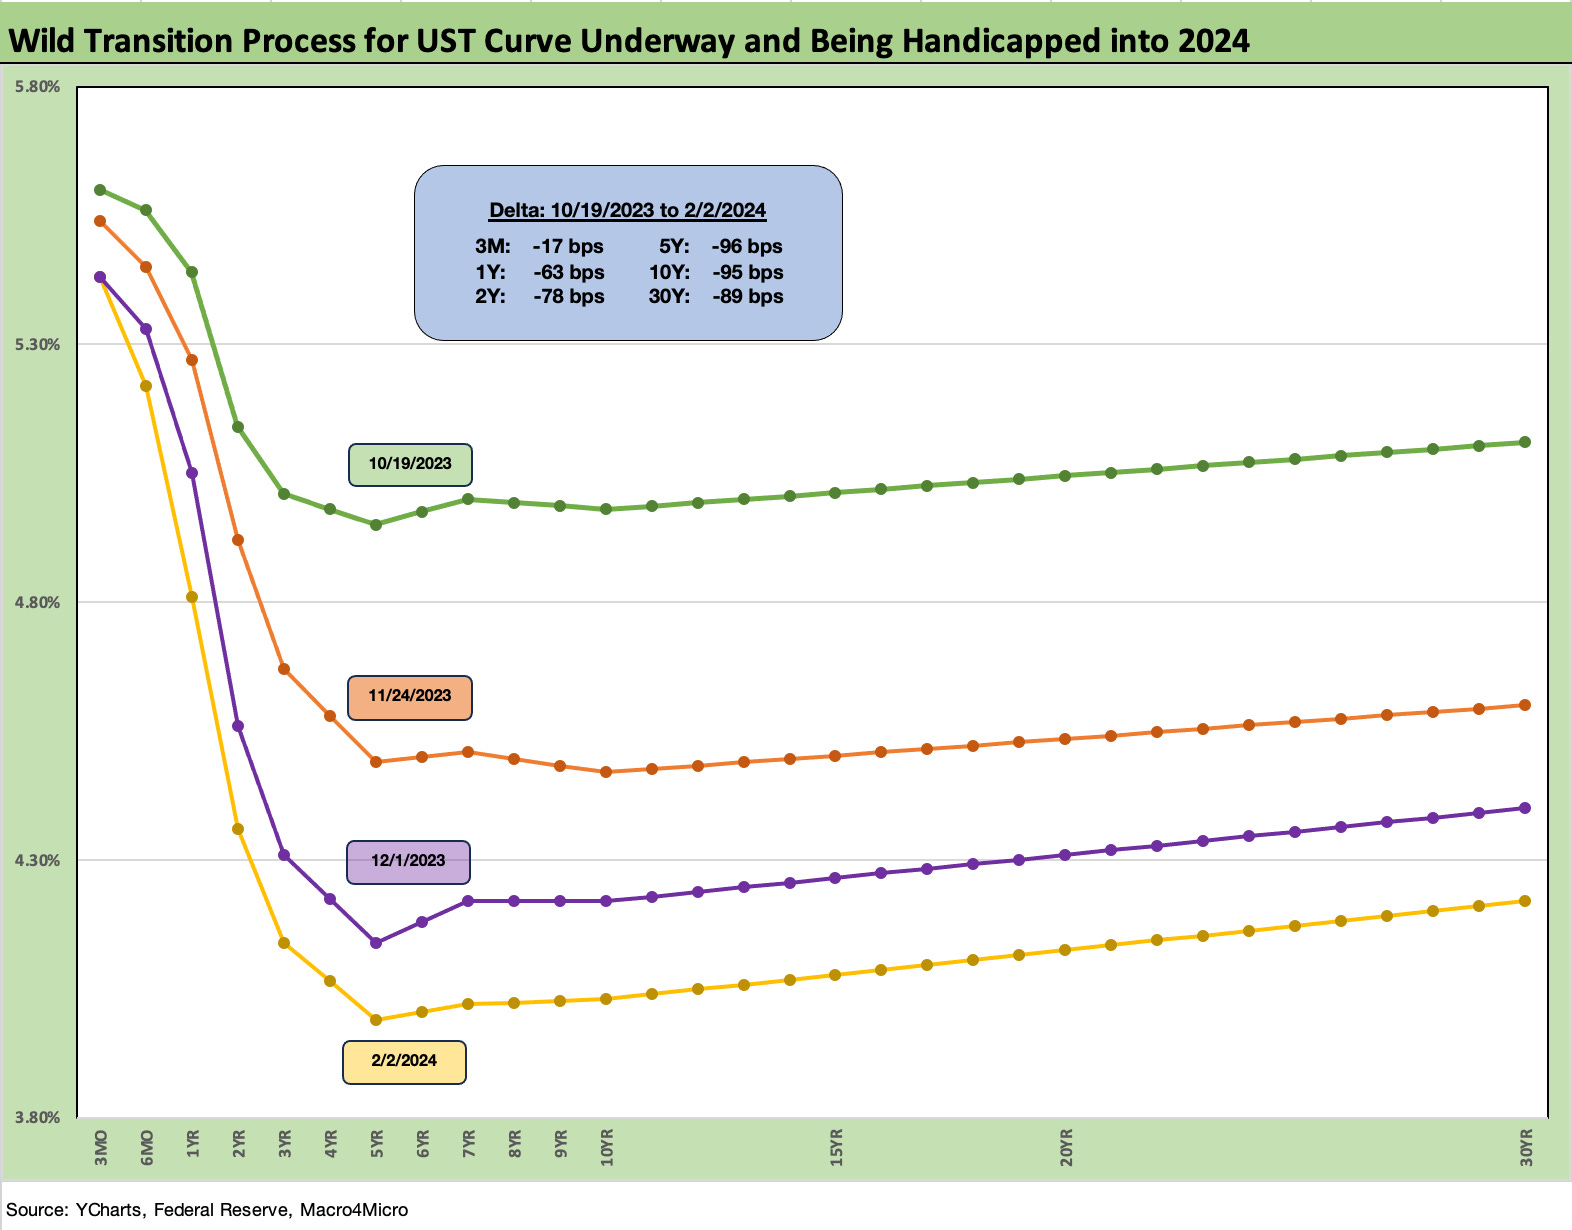
The above updates the UST migration from later in Oct 2023 when the 10Y UST flirted with the 5.0% line over several days. We chose 10-19-23 as a useful start date to mark the highs. We then plot some UST curves across the major UST rally of Nov-Dec and then on to this past Friday.
We note the UST curve deltas in the box within the chart that shows a sharp downward shift from 5Y (-96 bps) to 10Y (-95 bps) to 30Y (-89 bps) as those curve moves rewarded duration in debt and inspired a material risk rally across a wide range of equity benchmarks and subsectors. We looked at the extremely bullish returns across a wide breadth of asset categories in Nov-Dec in our year end recap (see Footnotes & Flashbacks: Asset Returns 1-1-24 ). Our most recent update for the UST flow-through into fixed income and debt market returns was posted in a separate Footnotes publication from earlier today (see Footnotes & Flashbacks: Asset Returns 2-4-24).
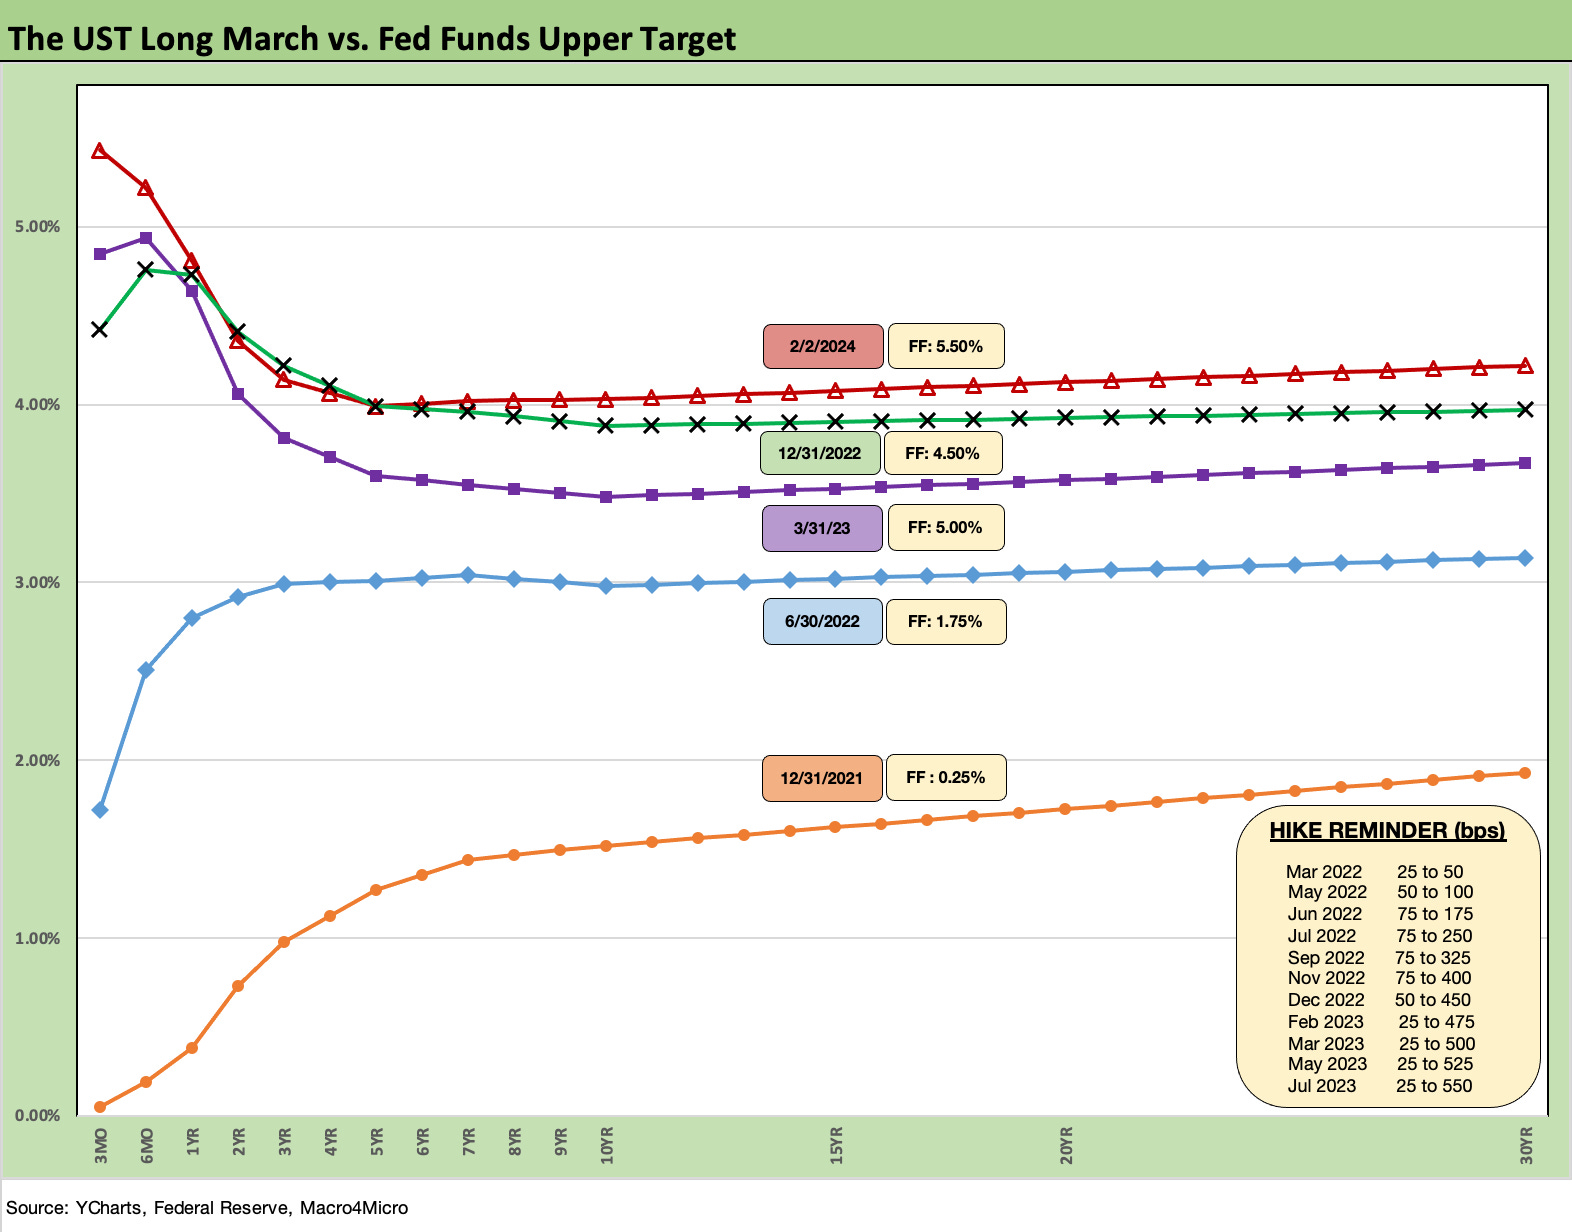
The above chart updates the UST migration from the end of 2021 and then into the tightening cycle that got underway in March 2022 (the end of ZIRP was effective in the market by 3-17-22). We include a memory jogger box for the dates and scale of the hikes across the period. The 4 x 75 bps hikes are not something you see too often (to say the least) over the years since Volcker. The 1994 Fed ambush was tough but not this ugly (see Bear Flattener: Today vs. 1994 and Aftermath10-18-22). Plus the 1994 monster tightening was a false alarm. 2022 was not a drill.
As we look at the 2022-2023 UST migration above, the post-regional bank crisis UST of March 2023 is worth remembering after this past week with the NYCB situation we discussed in our separate Footnotes piece on asset returns. That chaos in March 2023 moved the needle on the UST curve (see Silicon Valley Bank: How did the UST Curve React? 3-11-23).
It will take much more than NYCB to go wrong to take us down that memory lane. In the meantime, the market awaits some verbal signals or action from the FOMC in the March 19-20 and April 30/May 1 FOMC meetings to get a sense of when this open-ended inversion will remain the prevailing state of affairs.
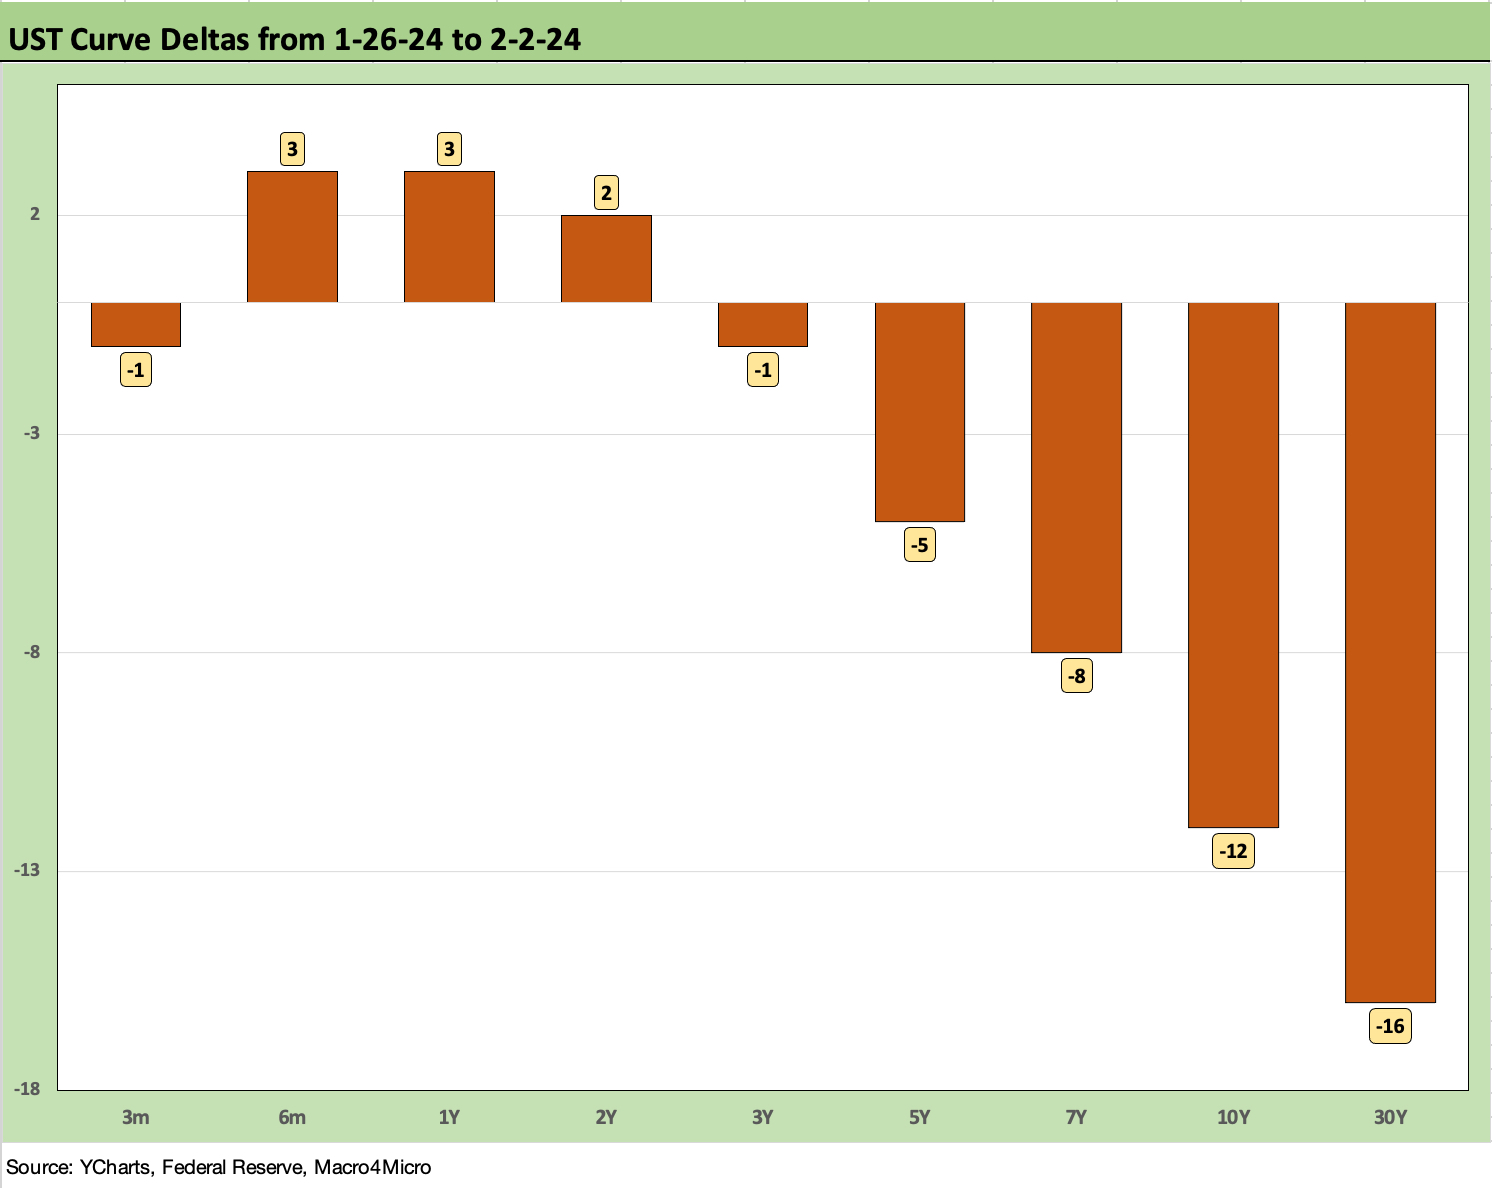
The above chart details the UST deltas on the week as the UST 10Y and 30Y took a dip despite a double digit rise on Friday for both after the payroll surprise. The 10Y and 30Y UST had declined by around -28 bps through Thursday until the Friday jobs pop left the 10Y at -12 bps on the week and 30Y at -16 bps. The short end was still feeling the disappointment of Powell raining on the March 2024 fed fund easing parade.
The Employment Cost Index release (see Employment Cost Index Dec 2023: Compensation Mixed Picture 1-31-24) and Productivity data was not overwhelmingly positive by any stretch, but the balance of the 4Q23 ECI and the Productivity story (see Productivity: Takes the Edge of the 4% Handle YoY ECI 2-1-24) was reassuring on the most recent trends for inflation and served up some dulling effects after the wage pricing power and consumer spending.
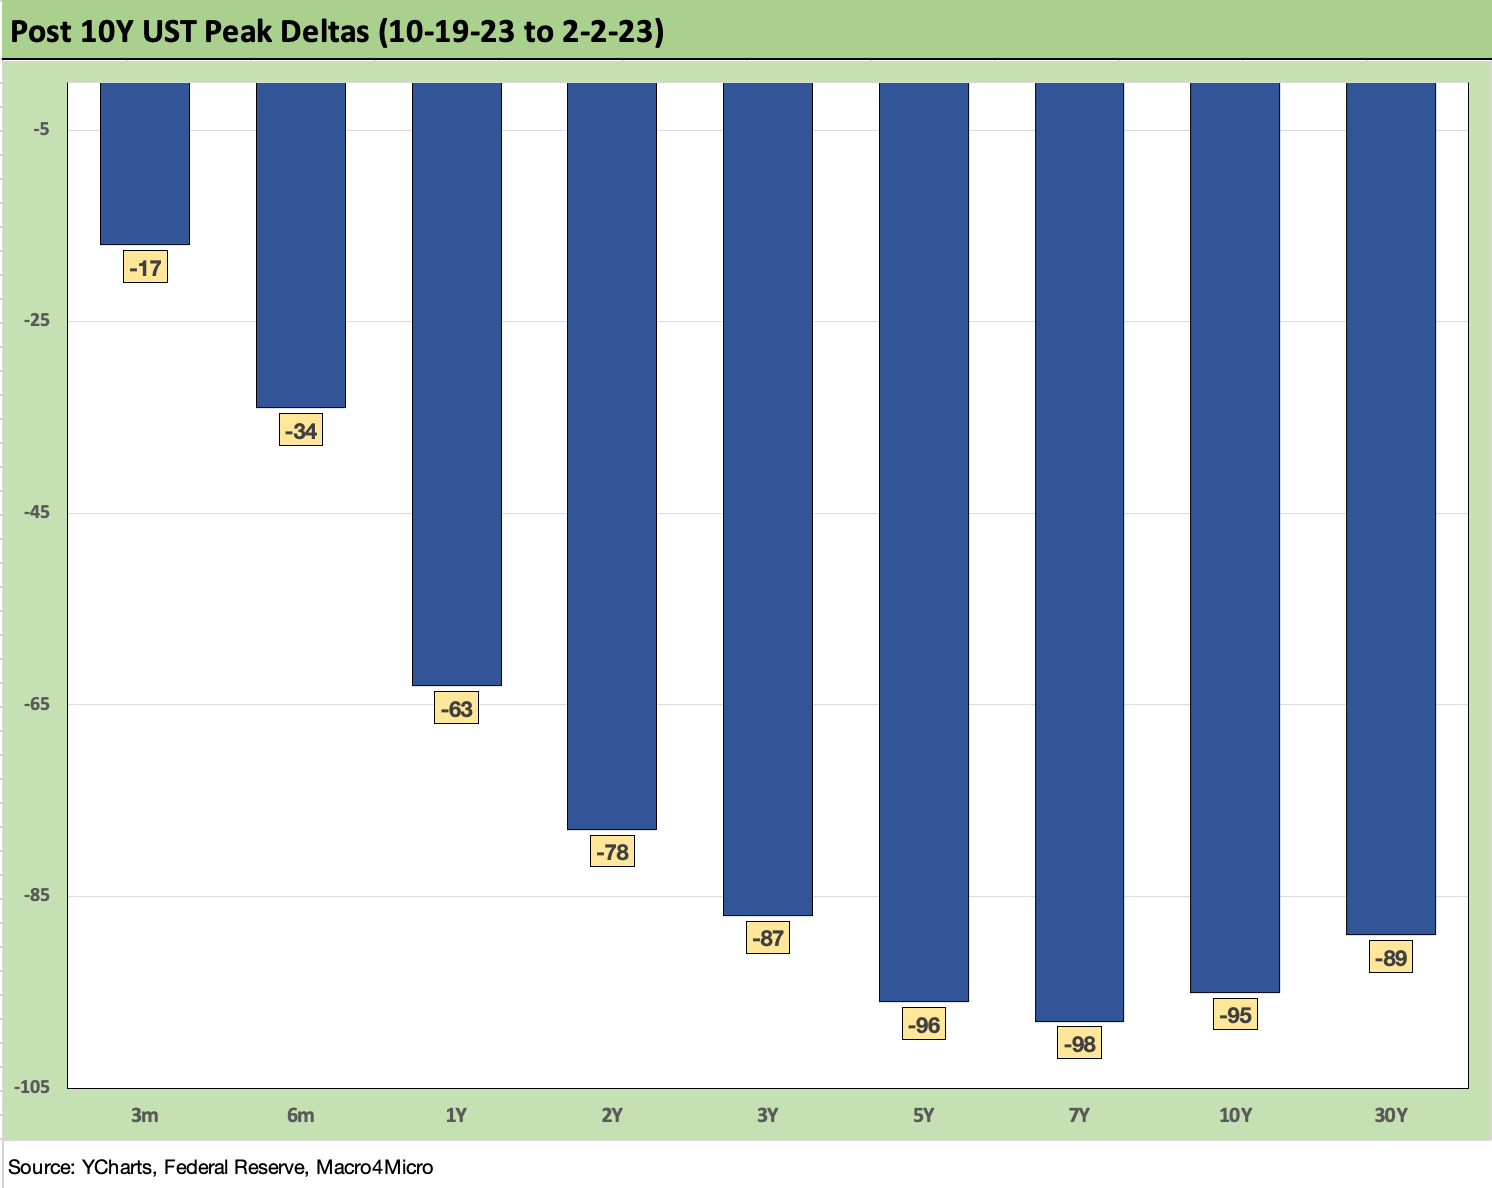
The above chart updates the running UST deltas from the Oct 19, 2023 date that we framed as the peak on the 10Y UST (even if a few dates were eligible that week on intraday). The bull flatteners wrapped within the backdrop of a material inversion from 3M UST leaves a lot of room for debate on the shapeshifting timing and UST slope handicapping from here as record borrowing needs play out in 2024.
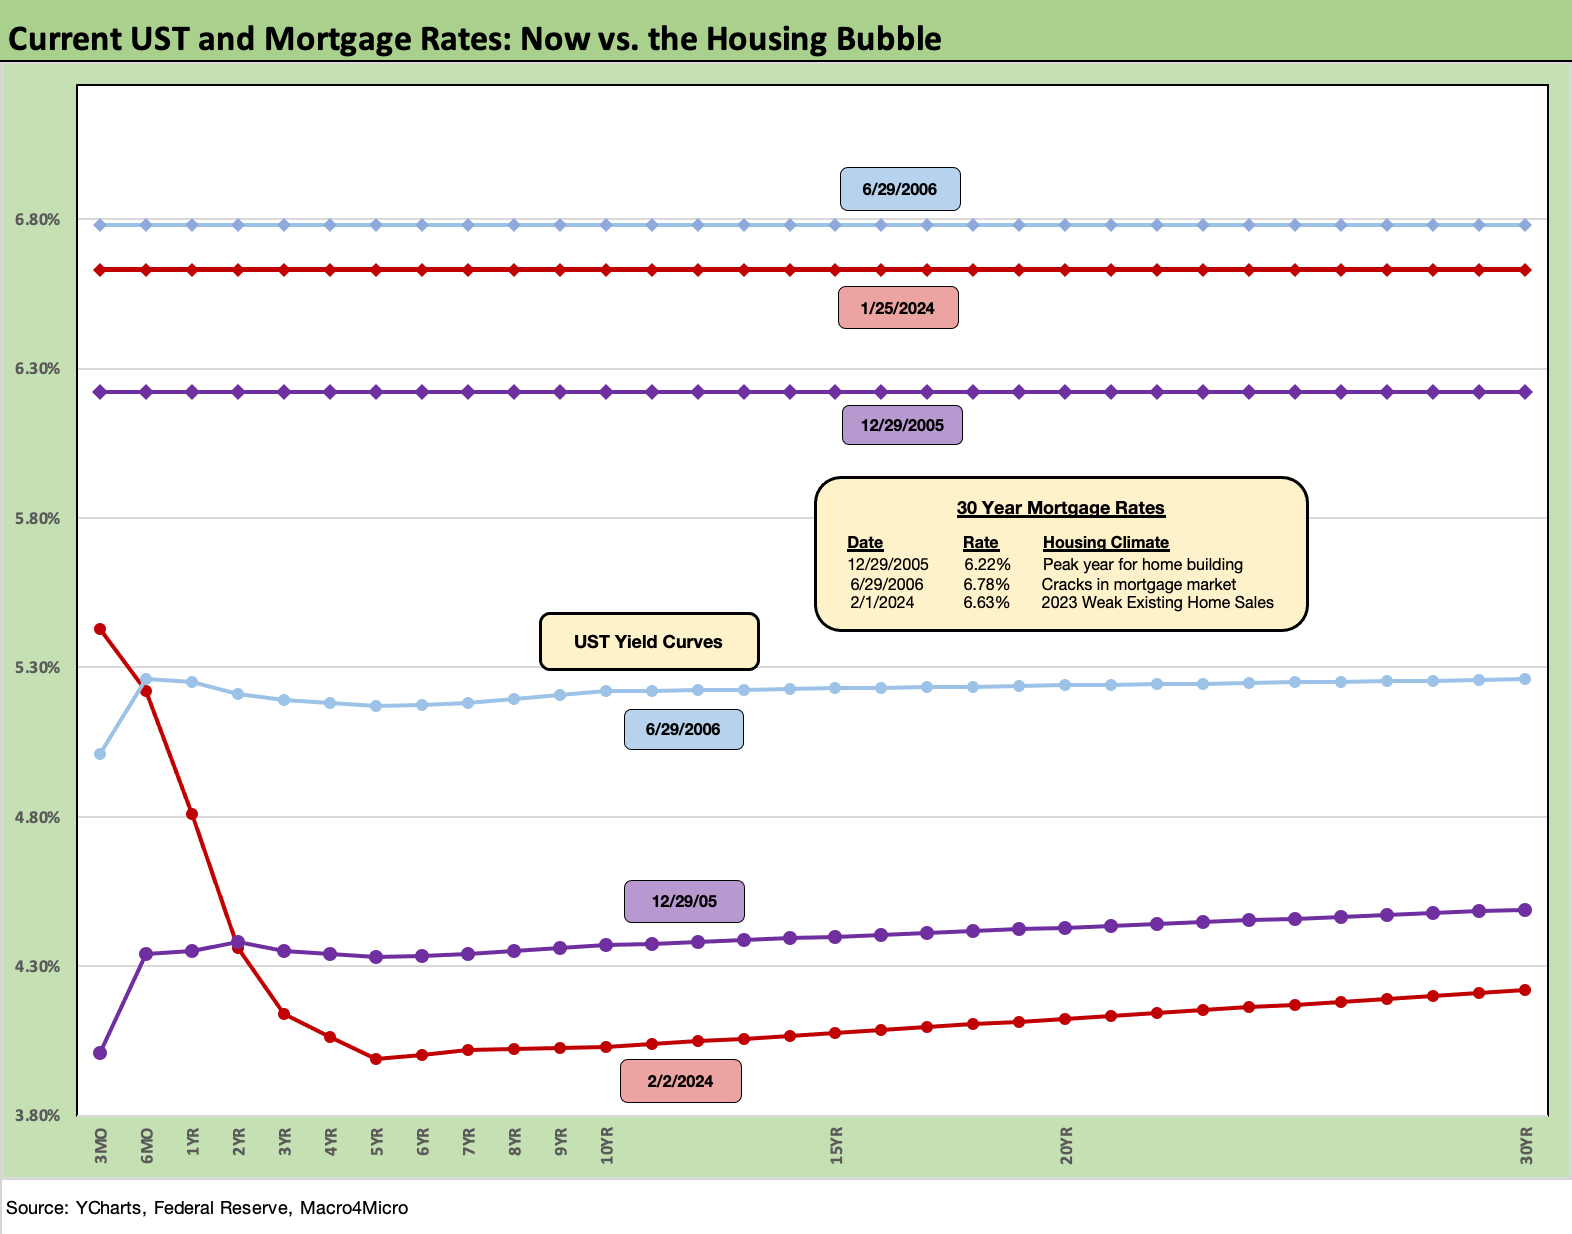
In our weekly yield updates, we have been updating some “past vs. prologue” yield charts for the 30Y mortgage rate (Freddie Mac benchmark). For mortgages, we frame the current UST and 30Y mortgage vs. those at the end of the peak homebuilding year of 2005 and the mid-2006 period when the RMBS trouble was just starting to show up.
We see the UST curve materially lower today out past 2Y UST but the all-in 30Y mortgage rate is positioned between those at the end of 2005 level and mid-2006. Mortgage spreads remain historically wide vs. these prior cycles, and we remain a long way from where mortgage rates will improve affordability for existing home sales activity that could free up more inventory for sale.
The entry level and first time buyer also sees some potential buyers squeezed out on the new homebuilding side even if the homebuilders can team with their mortgage units to offer a wider range of incentives.
We follow up below with similar historical comparisons for the IG Corp and HY Bond indexes. For those markets, we use the peaks (or near peaks) of the corporate credit cycles in 1997 and 2007. We also look at the spread and curve histories with more detailed commentary in the year end recap (see Footnotes & Flashbacks: State of Yields 1-1-24).
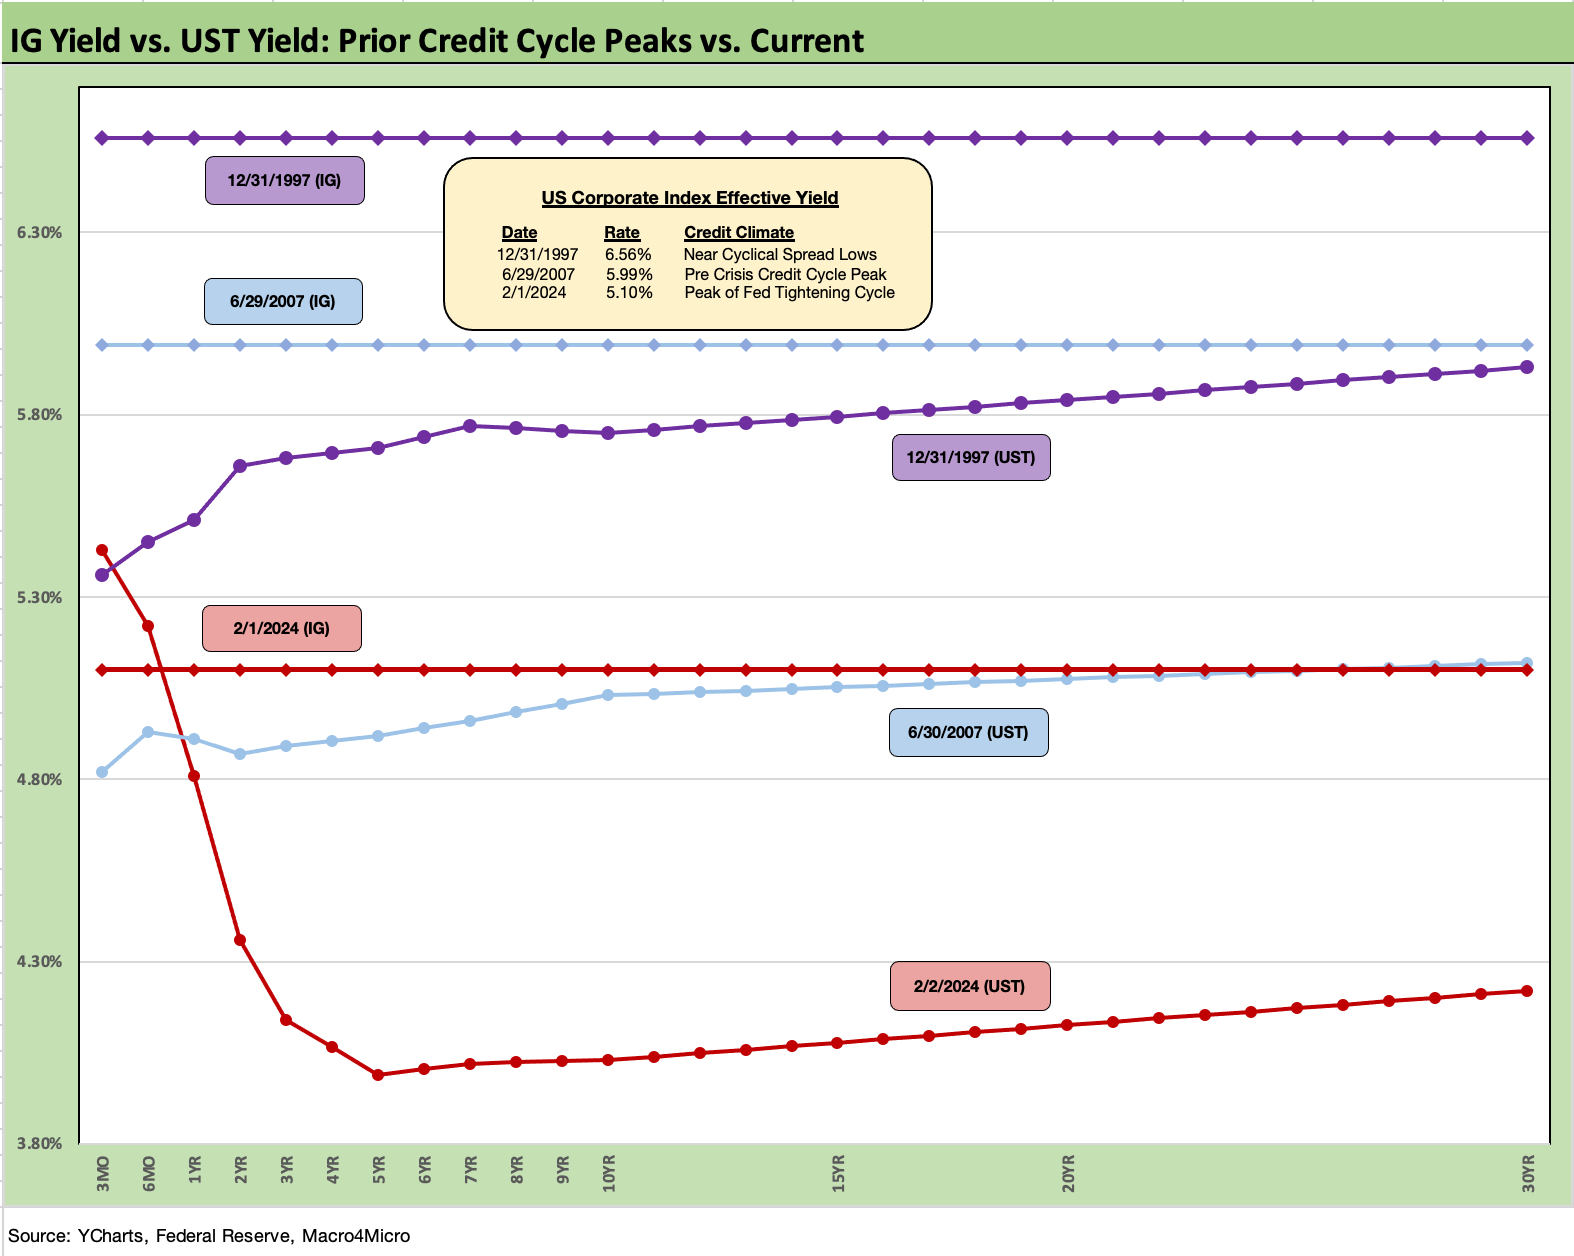
The “then vs. now” for the IG Corporate index yields frames recent levels vs. the end of 1997 and late June 2007 at credit cycle peaks. The all-in IG yields of June 2007 and Dec 1997 were above current Feb 2024 yields as noted in the chart, but the IG OAS levels are in similar neighborhoods with the exception of the Oct 1997 lows.
The recent IG index yield of 5.10% is cited in the chart above, but IG yields hit 5.25% on 2-2-24 (per ICE). That IG index yield comes with an IG OAS of +102 bps, which is close to the +100 bps at the end of June 2007 and the 1H04 to 1H07 average of +93 bps. For the 1997 comparison, the IG OAS was at a low +53 bps in Oct 1997 while the 1997-1998 average was +95 bps. In other words, we are in the zone even if well above the crazy lows of Oct 1997 just ahead of the gradual unraveling in Asia.
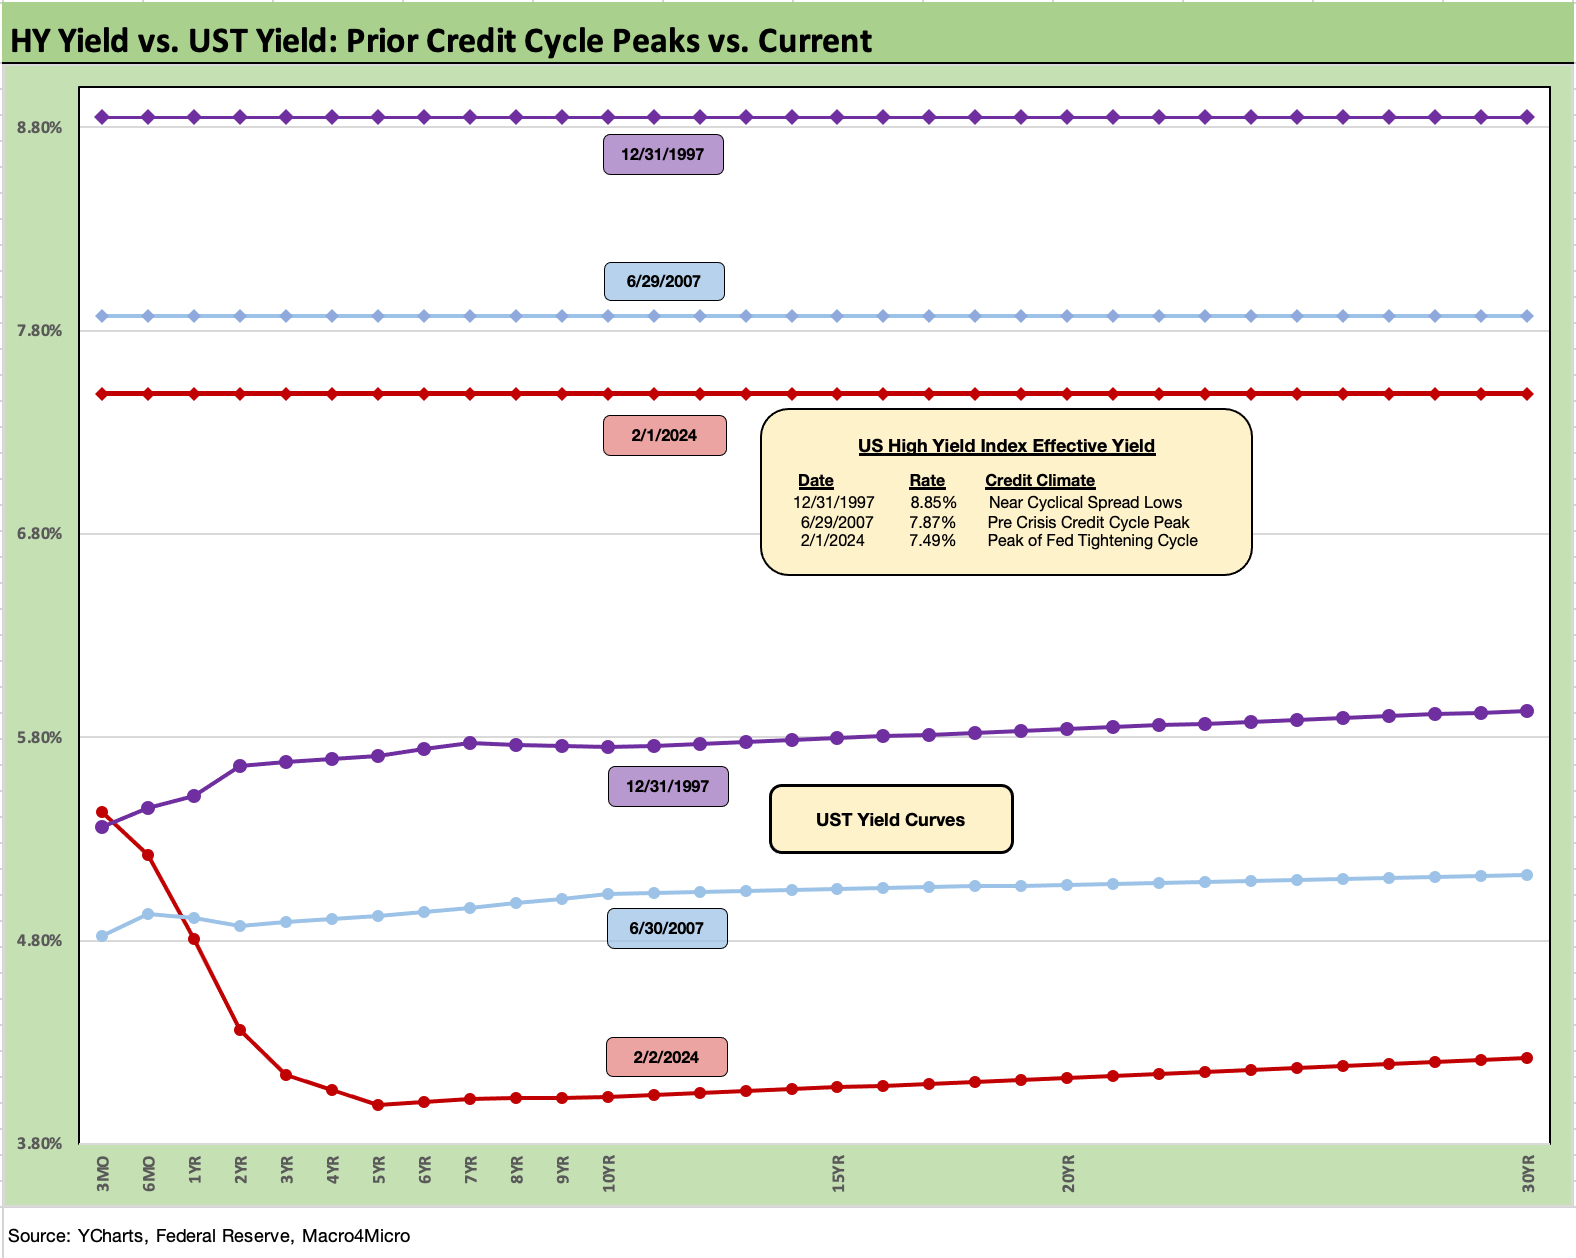
For more detailed HY history, look back to our year end recap (see Footnotes & Flashbacks: State of Yields 1-1-24). The all-in yields today are inside those earlier credit cycle peak periods with a materially lower UST today. The HY OAS lows of sub-250 bps in June 2007 and Oct 1997 are well inside the current +347 bps.
The current spreads are not near those of 1997 and 2007 but are instead closer to the first post-crisis cyclical low of June 2014 of +335 bps (6-23-14) before Oct 2018 brought new cyclical spread lows of +316 bps (10-3-18). Those 2014 and 2018 periods posted much lower all-in yields with 2014 in the ZIRP years that saw a 4.85% yield low in the HY index yield in June. The 2018 UST curve was only modestly further along into the Fed’s attempt at normalization that started in Dec 2015. The HY index in early Oct 2018 was closer to a 6.2% yield for the HY index vs. the current 7.8%.
As we now know, the HY market fell out of bed in the summer of 2007, the fall of 2014, and immediately after the lows of early Oct 2018 into an abysmal Dec 2018. The late 1990s spread cycle lasted a bit longer before imploding with the TMT bubble.
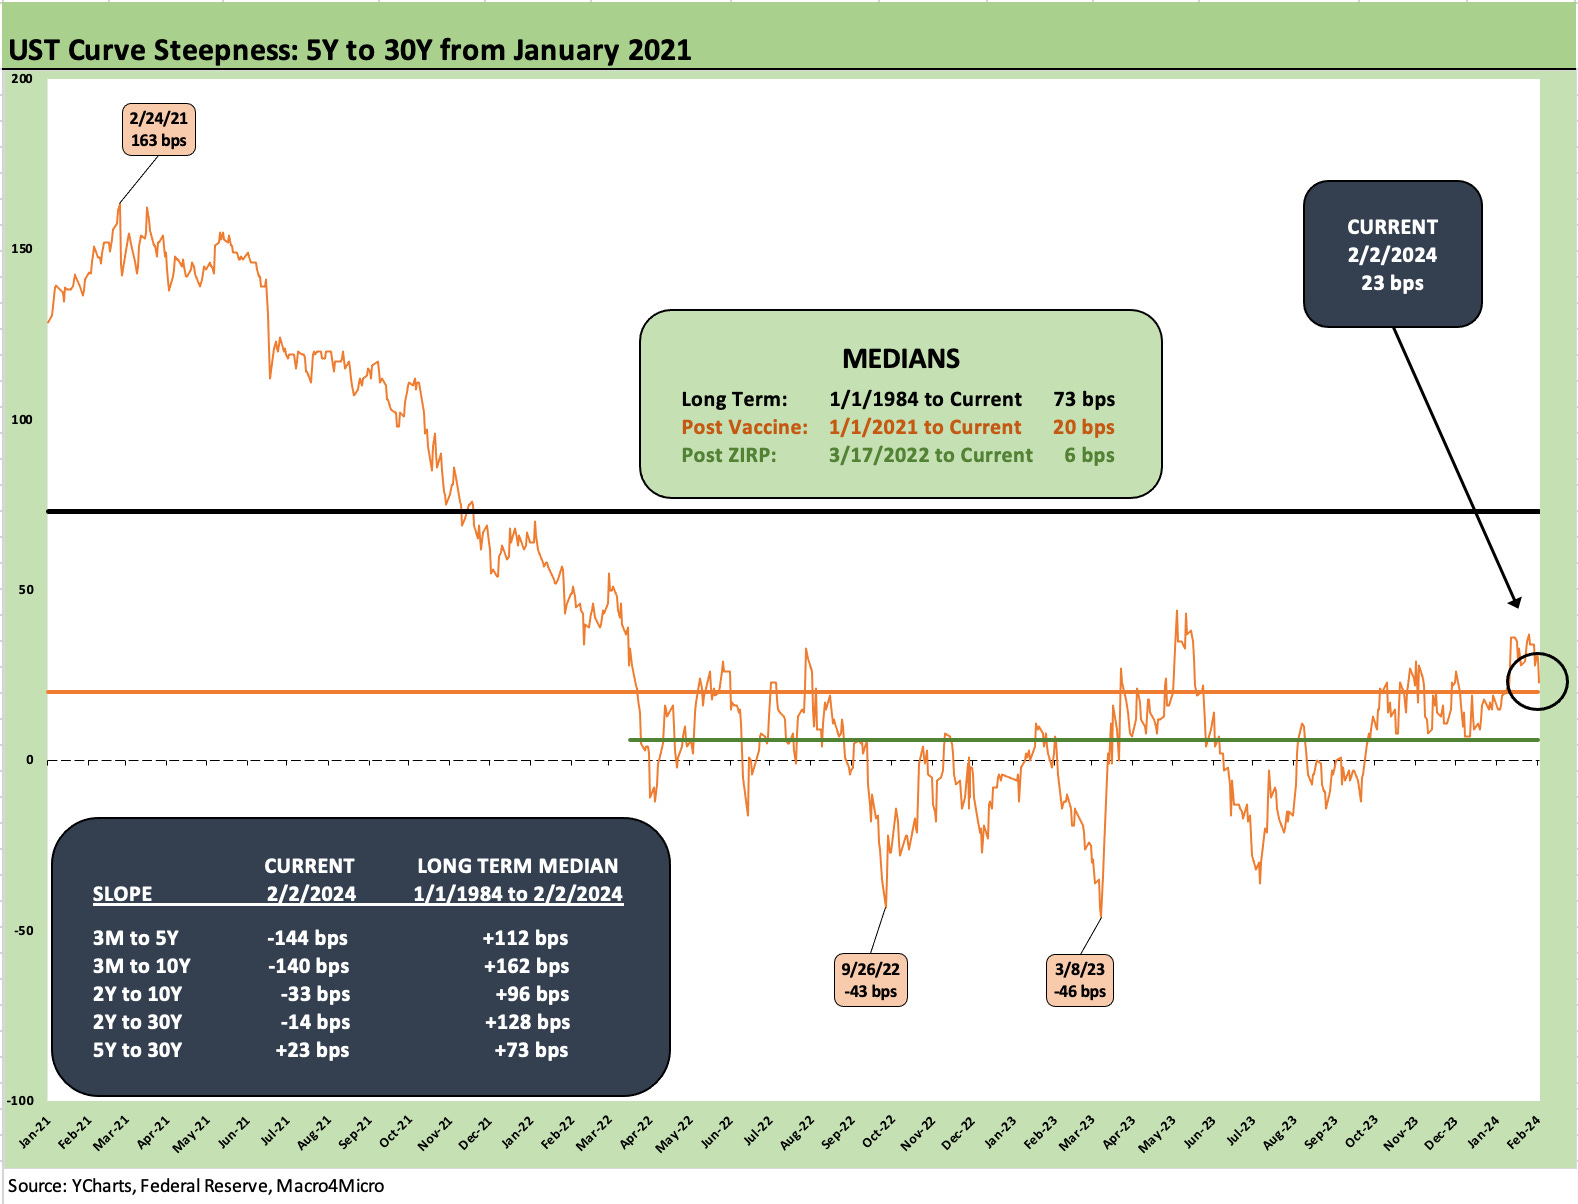
The above chart updates the 5Y to 30Y UST curve slopes since the start of 2021 with that important curve segment upward sloping at +23 bps after all the gyrations across the tightening cycle and since the recent partial bear steepening that unfolded in 2023 before the late year rally.
The box in the chart above updates the slopes for all the UST segments that we like to watch. We also post the long-term median from the beginning of 1984 after the most onerous Volcker tightening and double dip recession period of 1980-1982 was behind the market. Everything in the median column is upward sloping from a low of +73 bps on 5Y to 30Y segment to +162 bps for the 3M to 10Y. As of now, only the 5Y to 30Y is upward sloping.
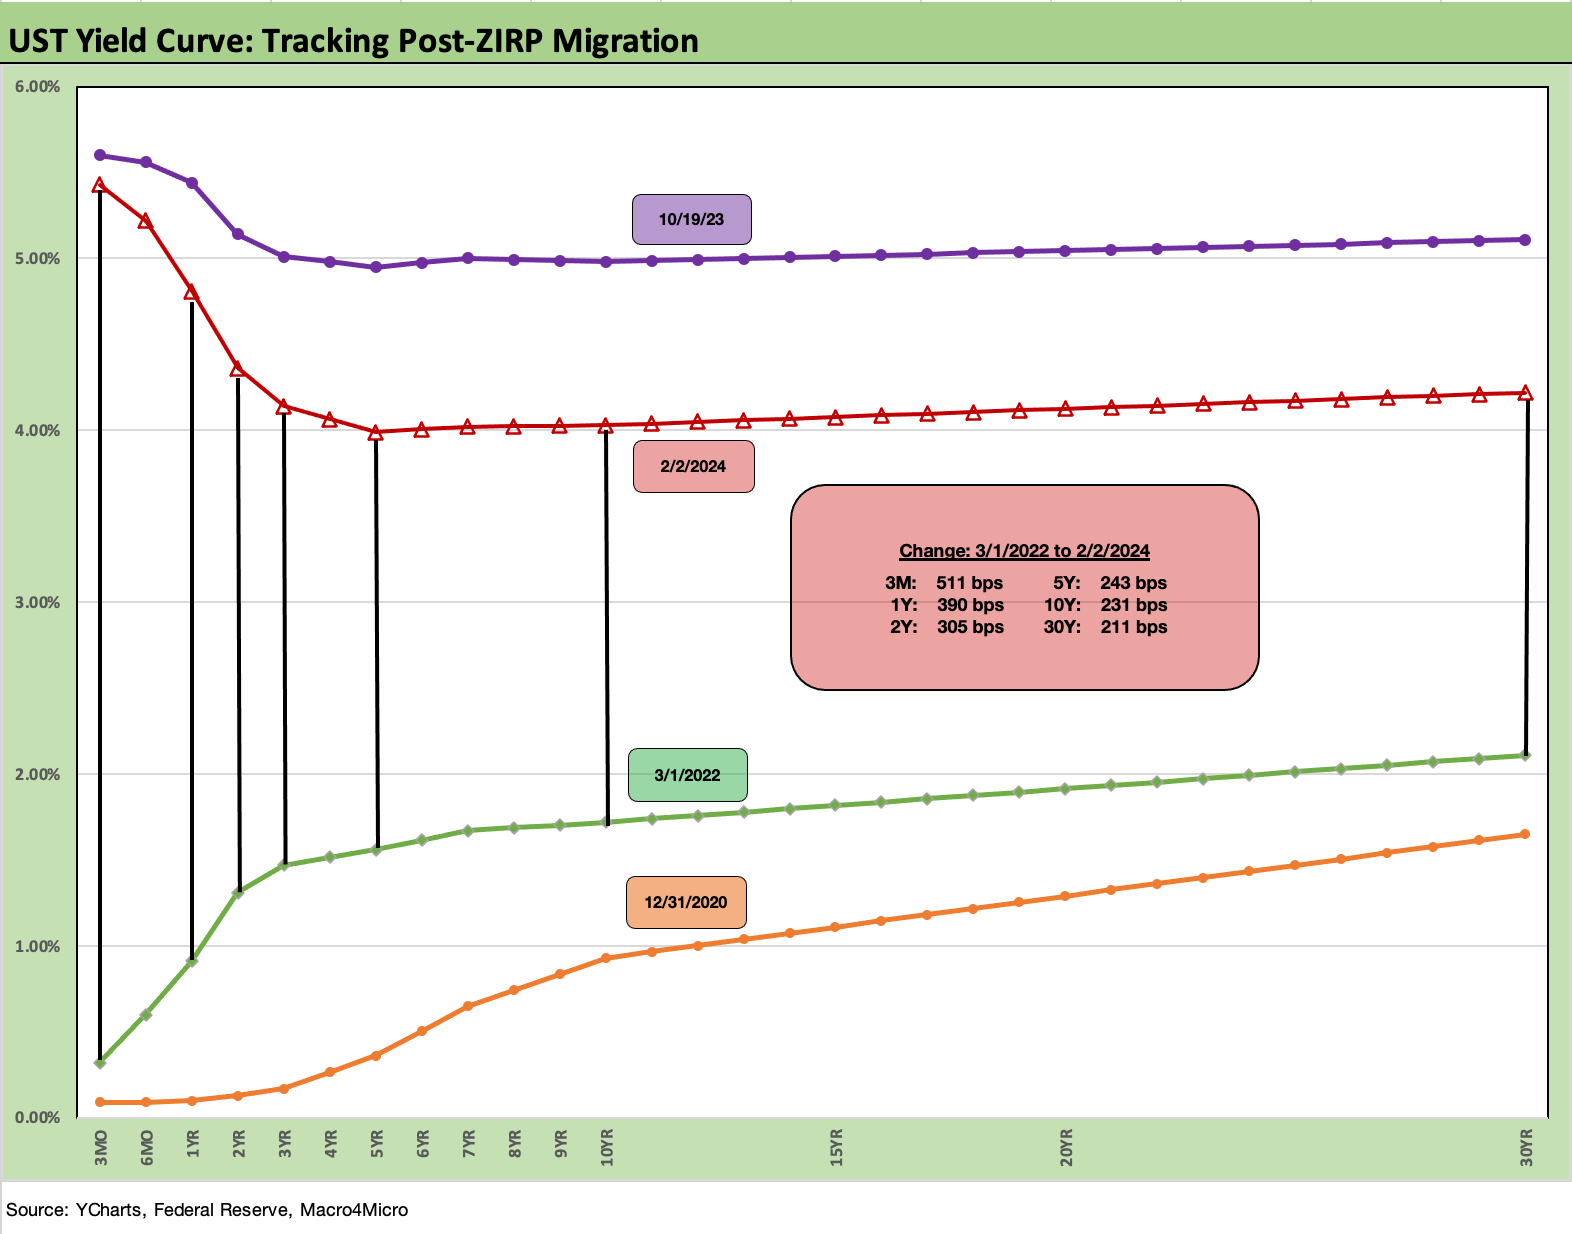
Our final chart is the usual UST differential from the start of March 2022 to the current UST levels. We also include a 10-19-23 UST curve to frame what was a post-tightening cycle peak before the late year 2023 rally.
We break out the differentials in the box that shows a high of +511 bps for the 3M UST that directionally tracks fed funds. The low delta was the 30Y UST at +211 bps as the curve ran from ZIRP into a bear flattener and then into a bear inversion.
The coming week will bring waves of earnings from a range of bellwether industrials including Caterpillar, Cummins, and Ford. We are also looking forward to hearing more color from the aerospace supplier chain (notably SPR, TDG) and major auto OE suppliers (LEA, BWA, MGA).
See also:
Footnotes & Flashbacks: Asset Returns 2-4-24
Payroll Jan 2024: Big Swing 2-2-24
Productivity: Takes the Edge of the 4% Handle YoY ECI 2-1-24
Employment Cost Index Dec 2023: Compensation Mixed Picture 1-31-24
JOLTS Dec 2023: “Little Changed” on Replay 1-30-24
PCE Release Dec 2023: Consumption Strong, Inflation Favorable 1-26-24
Histories: Asset Returns from 2016 to 2023 1-21-24
Consumer Sentiment: Multiple Personalities 1-19-24
Dec 2023 CPI: Big 5 and Add-Ons, the Red Zone Challenge 1-11-24
Credit Performance: Excess Return Differentials in 2023 1-1-24
Return Quilts: Resilience from the Bottom Up 12-30-23
HY Refi Risks: The Maturity Challenge 12-20-23
Coupon Climb: Phasing into Reality 12-12-23
HY vs. IG Excess and Total Returns Across Cycles: The UST Kicker 12-11-23
HY Multicycle Spreads, Excess Returns, Total Returns 12-5-23