
Footnotes & Flashbacks: Asset Returns 2-4-24
We look at asset returns in a very busy week of macro and micro events.


In a week filled with notable events from the macro to micro level, the FOMC color and Employment numbers dominated while a regional bank flashback rattled the cage on asset quality and bank risks again after a relatively clean reporting season.
The net effects of the ECI and Productivity numbers along with the Fed kept inflation anxiety in check even with the strong job numbers as long bonds moved lower through Thursday before the 10Y and 30Y UST curve objected to the huge upside surprise in payroll on Friday.
The shocker at the regional bank level was tied to the scale of the loss at New York Community Bancorp and the move to slash the dividend (it earned the “slash” headline from some rather than “cut”), but the fact that NYCB carries the name “Signature” in its recent M&A adventures in the March 2023 crisis puts more drama in the situation.
The wave of earnings reports this past week posted up some reassuring outcomes such as GM with its rally while Tech bellwether strength was impressive (notably Meta) and included some strong sea level indicators on the consumer (e.g., Amazon retail performance).
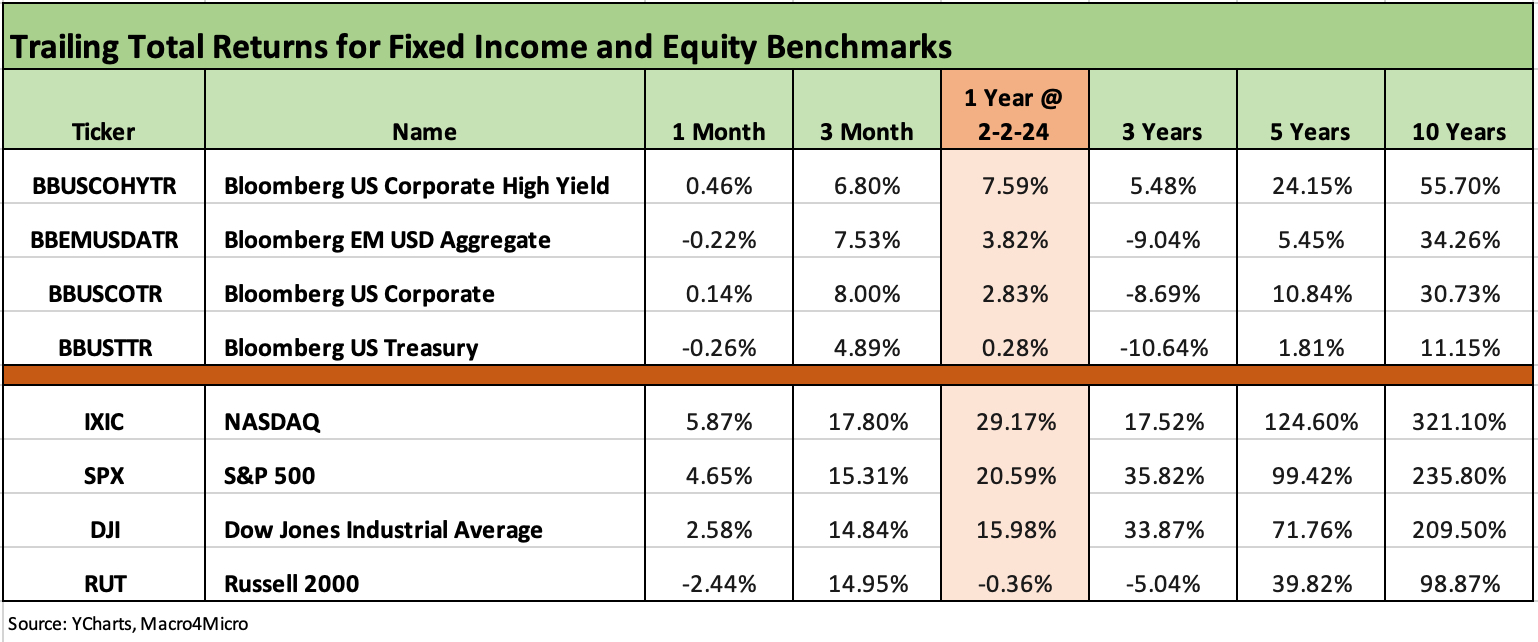
The above chart updates the main debt and equity benchmarks we track each week. We see the UST performance still struggling this past month in the negative zone after such a very strong finish to 2023 in Nov-Dec. We look at those UST deltas and spread moves in our separate Footnotes publication on yields. We see the sustained strength of Tech with the NASDAQ and Mag 7 sensitive S&P 500 running well ahead of small caps and even-weighted ETFs as discussed below in the ETF section.
The net effect of the UST moves saw the week close with the 10Y and 30Y yields down double digits even after the banner jobs number. The net effect of the FOMC commentary, Employment Cost Index, and Productivity release was supportive overall of the declining inflation story (see links at bottom). While many UST bulls were disappointed by March easing essentially coming off the table, the Fed commitment to breaking inflation was clear enough and reassured the long end. The following payroll numbers did not make the FOMC look wrong!
This past week saw a very favorable move in the long duration 20+ year UST ETF (TLT) as we detail in the ETF section below. With a +2.7% week, the TLT ETF weighed in at #2 in the rankings of the 31 benchmarks and ETFs we follow and ranked only behind the Consumer Discretionary ETF (XLY) with Amazon’s rally and just ahead of #3 Communications Services (XLC) with a grand slam by Meta in that ETF.
Tech leads the pack as 5 of the Mag 7 weigh in with earnings…
The new year has sustained an uneven equity recovery overall relative to where the year ended with the equal-weighted S&P 500 ETF (RSP) barely positive for the past week and 1-month. Small caps are in the red with the Russell 2000 small cap benchmark posting a -2.4% return above in a material break from the +14.9% for the rolling 3-month period with much of that in Dec at +12.6% just for that single month (see Footnotes & Flashbacks: Asset Returns 1-1-24 1-1-24).
The relative absence of breadth will beg the question of whether (or for how long it will take) the market will see the laggards chase the tech leaders again. That revolves around whether the firm economic numbers keep rolling in and the inflation metrics keep edging down and signaling more declines. The balancing act around inflation and fundamentals continues.
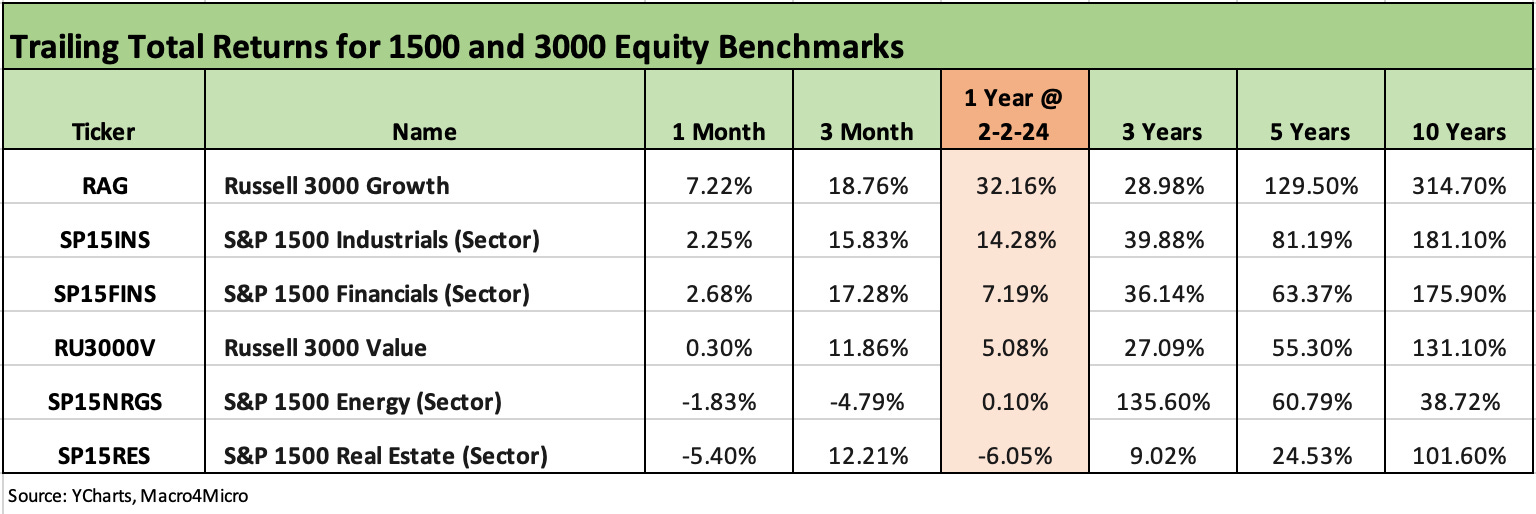
The above chart updates the 1500 and 3000 series with Growth outshining Value and a lack of breadth in the rally down into small caps. Real Estate was back in the red zone for the past month but still shows the effects of the late year rally in the 3-month bucket. Energy has been a recurring disappointment after the 2022 Russia-Ukraine turmoil.
Meanwhile, Financials had a successful earnings season in terms of the sector making its case, but the asset quality concerns in real estate are easily triggered and extrapolated to the extreme. Theories will abound on what all this means for fresh bouts of deposit risk given the stubbornly high (and safe) short UST rates as well as any fresh confidence problems around more sudden recategorizing of real estate assets into problem buckets. That in turn can lead to reserve increases that might flow into dividends and valuation (multiples) in equities.
The rolling return visual
In the next section we get into the details on the 31 ETF and benchmarks for trailing periods. The collection of four charts below looks a lot like some recent Footnotes publications except that we see a bias toward the positive side for the current 1-week collection. The 1-week mix is down from 26-5 last week but better than 11-20 the week before.
It will take some weeks to move the needle from the very strong numbers in Nov-Dec 2023, but the weakness is spreading back to more of the benchmarks and ETFs outside of tech. We look at each time frame in more detail in the ETF and benchmark return collection further below.
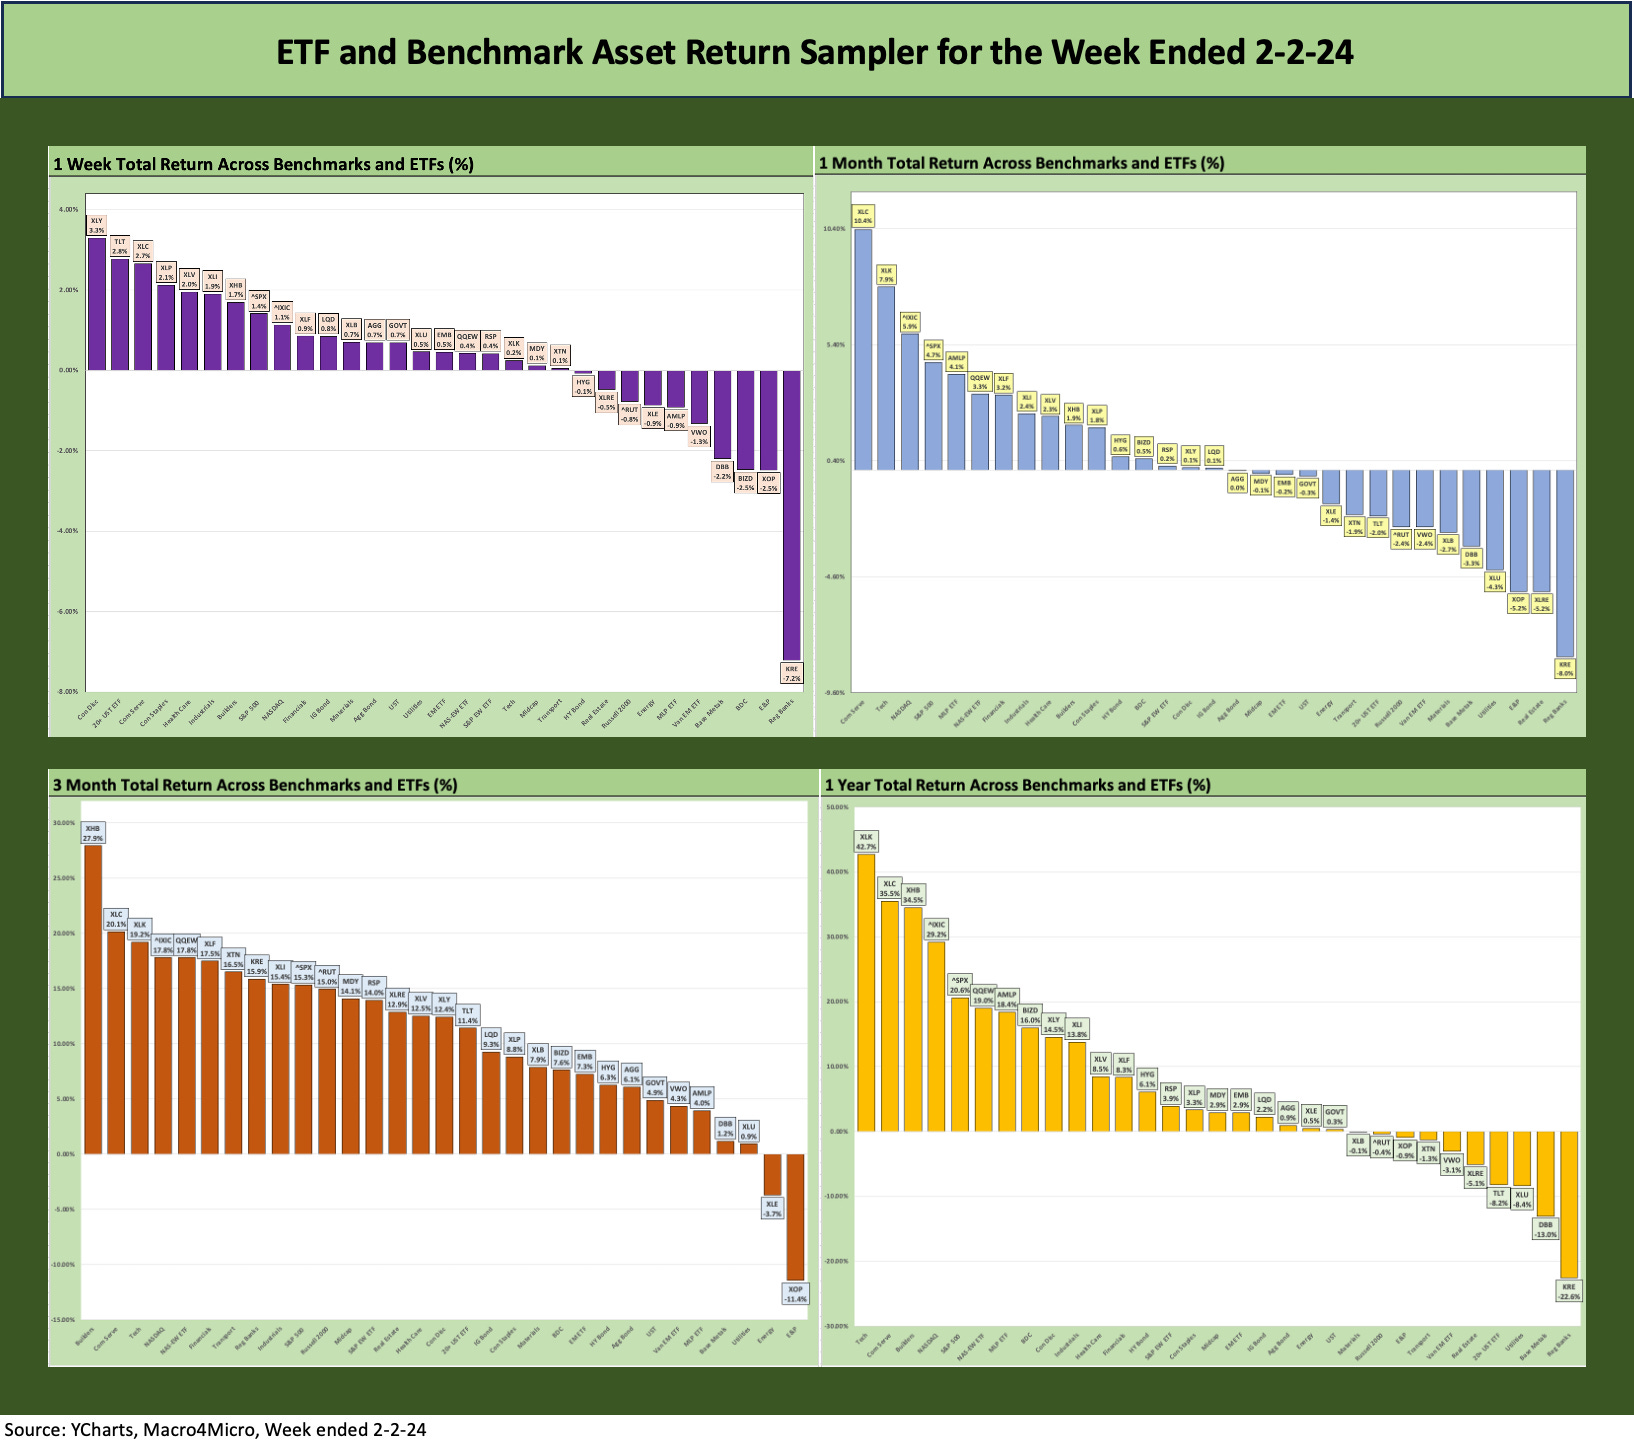
The above chart drives home the reality of the mixed performance at the subsector and industry level the past week and 1 month period despite the record highs in the headlines for the broader benchmarks as Tech drives the bus again.
In contrast, the trailing 3-month period is still dominated by the magnitude and breadth of the “rally across everything” from risk to rates after UST rates peaked in late Oct and numerous ETFs and benchmarks were running in the red. We still see the two lone negative ETFs from energy for the 3-month period.
Looking back over the 1-year horizon, we see the dark side of regional bank anxiety and the UST curve moves in the bottom 5 of that time horizon with Regional Banks (KRE) in last place and some interest rate sensitive sectors feeling the UST backdrop through much of the year. We saw real estate jitters revisited this week with a vengeance after NYCB. Over the past year, the long duration UST ETF (TLT) was in the bottom 5 with Real Estate (XLRE) and Utilities (XLU) while Base Metals ETF (DBB) was more tied up in the China themes as well as broader cyclical expectations.
The Magnificent 7 heavy ETFs…
Some benchmarks face issuer concentration elements that leave them wagged by a few names. When looking across some of the bellwether industry/subsector ETFs, it is good to keep in mind which narrow ETFs (vs. broad market benchmarks) get wagged more by the “Magnificent 7” including Consumer Discretionary (XLY) with Amazon and Tesla, Tech (XLK) with Microsoft, Apple, and NVIDIA, and Communications Services (XLC) with Alphabet and Meta.
We had some big price action in the Magnificent 7 heavy ETFs this past week with Consumer Discretionary (XLY) at #1 for the week and Communications Services (XLC) at #3 largely on the back of a 20% handle move by Meta, who shocked the market with its numbers and added a high dividend payout in the victory lap. In an interesting combination, we also saw Consumer Staples ETF (XLP) and the defensive Health Care ETF make the Top 5 the past week.
Regionals back on the front burner this past week…
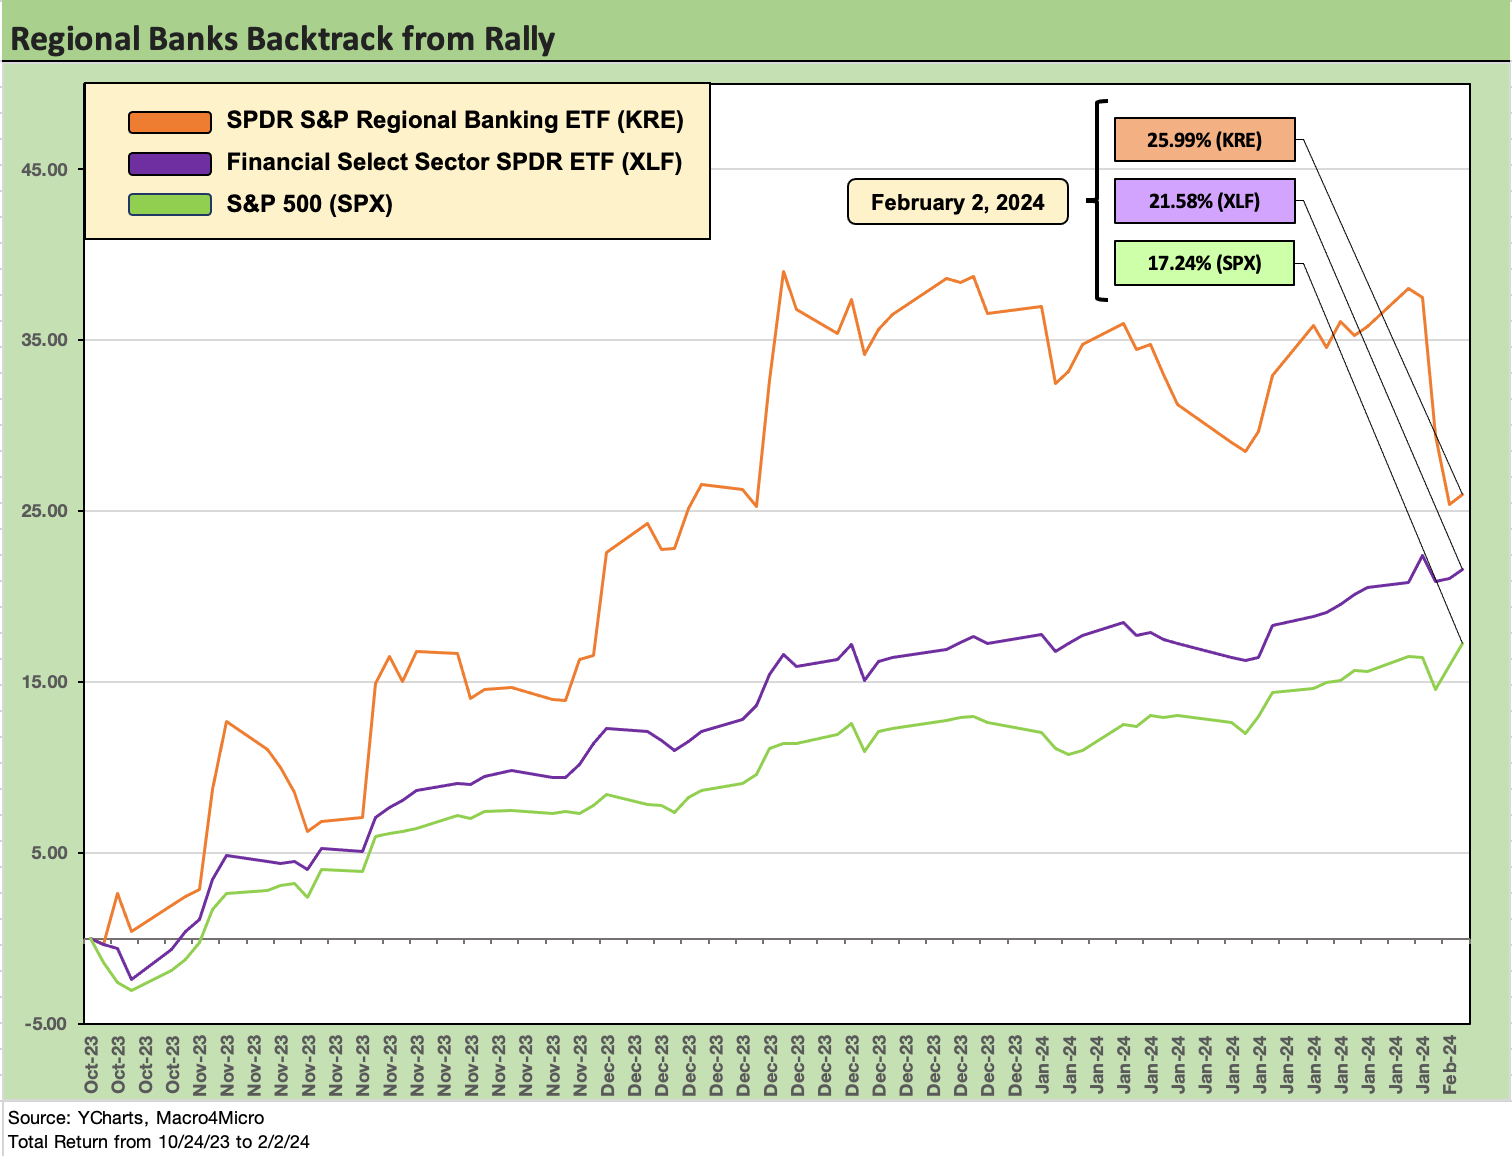
The biggest outlier on the week was last place Regional Bank ETF (KRE) that plunged by -7.2% on the New York Community Bancorp (NYCB) headlines. The market saw real estate asset quality fears from offices and multifamily exposures in rent control markets take center stage.
The fact that NYCB was the buyer of Signature Bank in last year’s crisis offers some literal flashbacks for those worried about asset quality but also for those who worry about deposit cost and deposit flight. On deposit costs, the Fed is clearly easing more slowly than many had built into their interest margin models.
After what was a pretty reassuring earning season from large banks and regional banks, the equity analysts will be busy in their handicapping exercises over the weekend and into next week. NYCB posted an exceptionally detailed presentation on its site, and we would imagine stockholders and bondholders will be looking for more of that granular disclosure from more banks.
The deep dividend cut also offered a reminder of potential outcomes if short rates stay high and asset quality erodes (including loan to value relationships). Tenant risk (similar strain from high rates on loans) remains a tenant-by-tenant challenge for many companies in terms of space needs and potential lease renegotiations.
We break out the ETF and benchmark time horizon return details below.
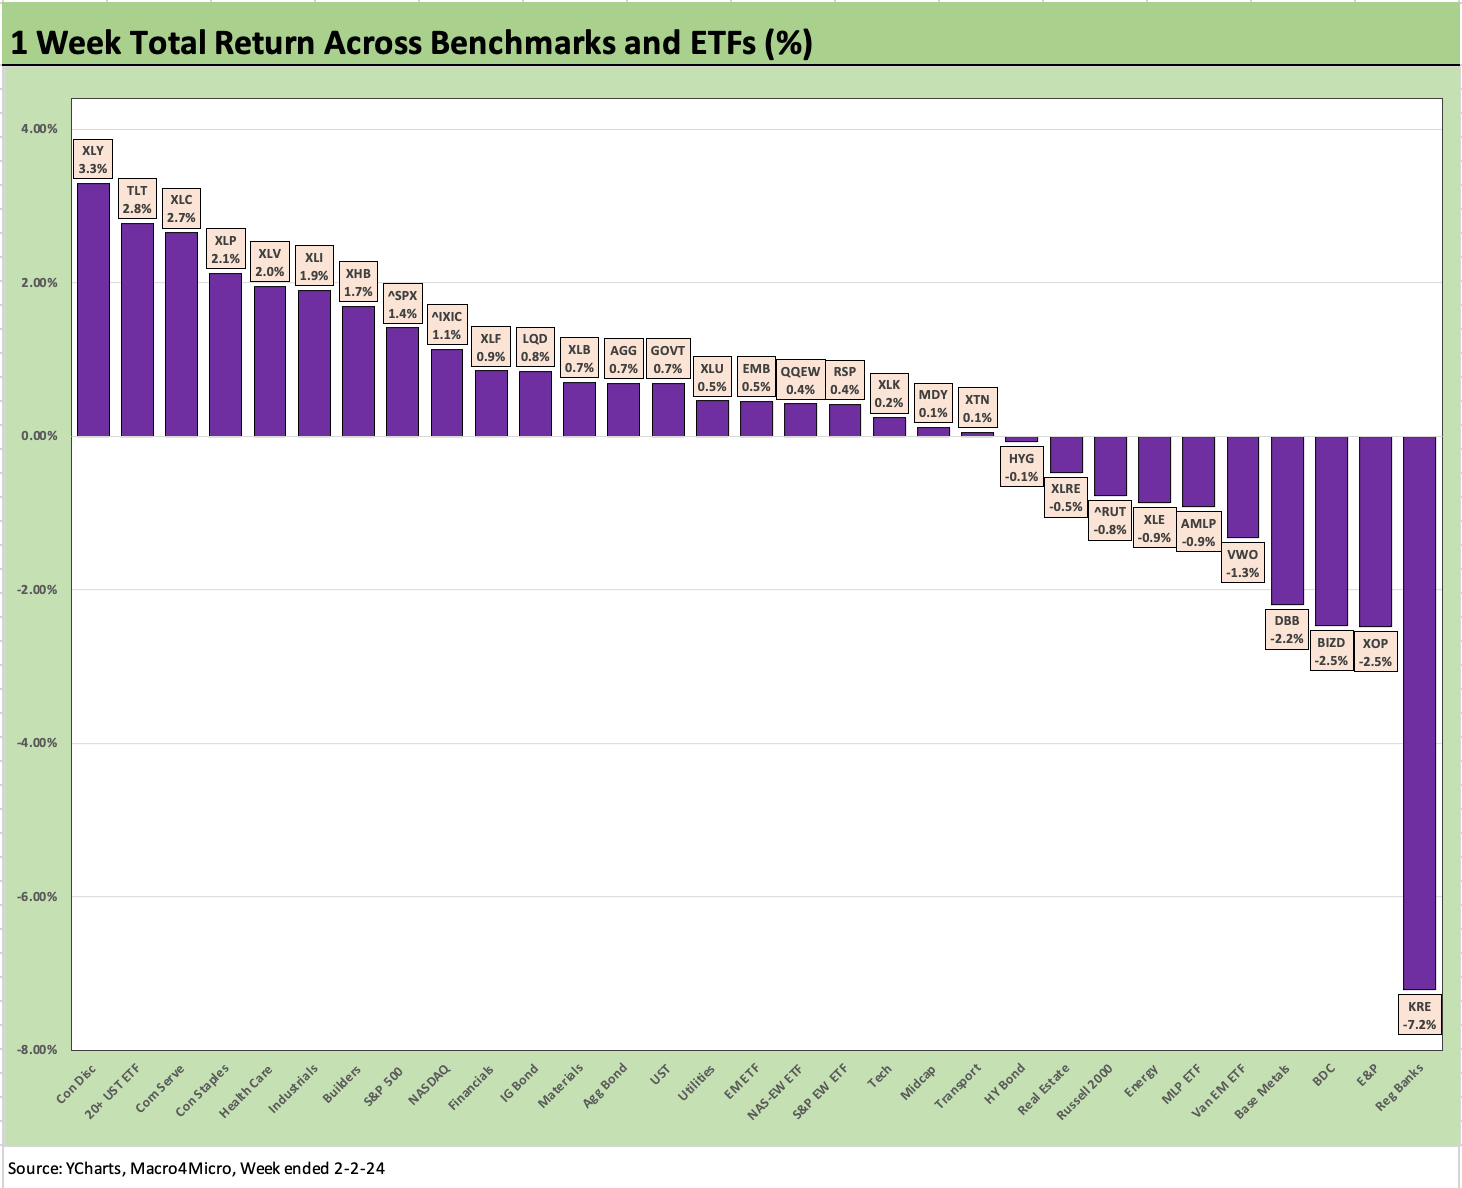
The above chart shows the 1-week scoresheet weighing in at 21 positive and 10 negative. We discussed Regional Banks (KRE) earlier, but we see energy-related weakness (XOP, AMLP, XLE), soft performance in Base Metals (DBB), and some laggards in Real Estate (XLRE) after the NYCB headlines.
We see the BDC ETF (BIZD) dropping down ahead of what will be a busier earnings season over the next few weeks with some industry bellwether reporting this coming week including BDC industry giant Ares (ARCC) reporting along with longtime industry mainstay Golub. Most report later in the month.
The creeping credit cycle will come someday, and high short end rates on leveraged companies will take a toll on some and less so on others. That is hardly “new news” to those who are long HY bonds or leveraged loans at tight spreads or those pushing into the rapidly expanding world of private credit.
The BDC equity audience has always been about high income and a diversified exposure to credit risk managed by many top credit risk managers. Nonaccruals have been very solid in the space, and they are naturally due for more noise ahead.
Oaktree (OCSL) reported this past week and posted rising nonaccruals and in turn sold off hard in this retail heavy equity space. If there is any company that knows its way around credit and leverage lending it is Oaktree, but the sensitivity of markets to any hint of natural credit cycle weakness could make for some volatility.
The resilience of the short end of the UST in supporting floating rate assets and the ability of so many BDCs to lock in long dated, low coupon unsecured ahead of the tightening cycle will make for some interesting research and issuer selection exercises as reporting season continues and filings and details are available.

The 1-month breakdown shows a near dead heat at 16 positive and 15 negative with Tech-centric and the Mag 7 driving 5 of the top 6 with #5 AMLP showing midstream getting out of the doldrums it has been in. Communications Services (XLC), Tech (XLK), NASDAQ, and the S&P 500 took the trailing month honors followed by Midstream with equal weighted NAS 100 (QQEW), Financials (XLF) and Industrials (XLI) rounding out the top quartile.
While large cap banks had a decent 4Q23 reporting season, the regionals (discussed earlier) got pulled back into last place for the trailing month after closing out 2023 at #1 for the month of December. There are no regional banks in the Top 10 holdings of the Financials ETF (XLF) with 4 of the Big 6 (JPM, BofA, Wells, Goldman) joining a mix of nonbank industry leaders in the Top 10 of XLF, including Berkshire, Visa, Mastercard, S&P Global, American Express, and BlackRock.
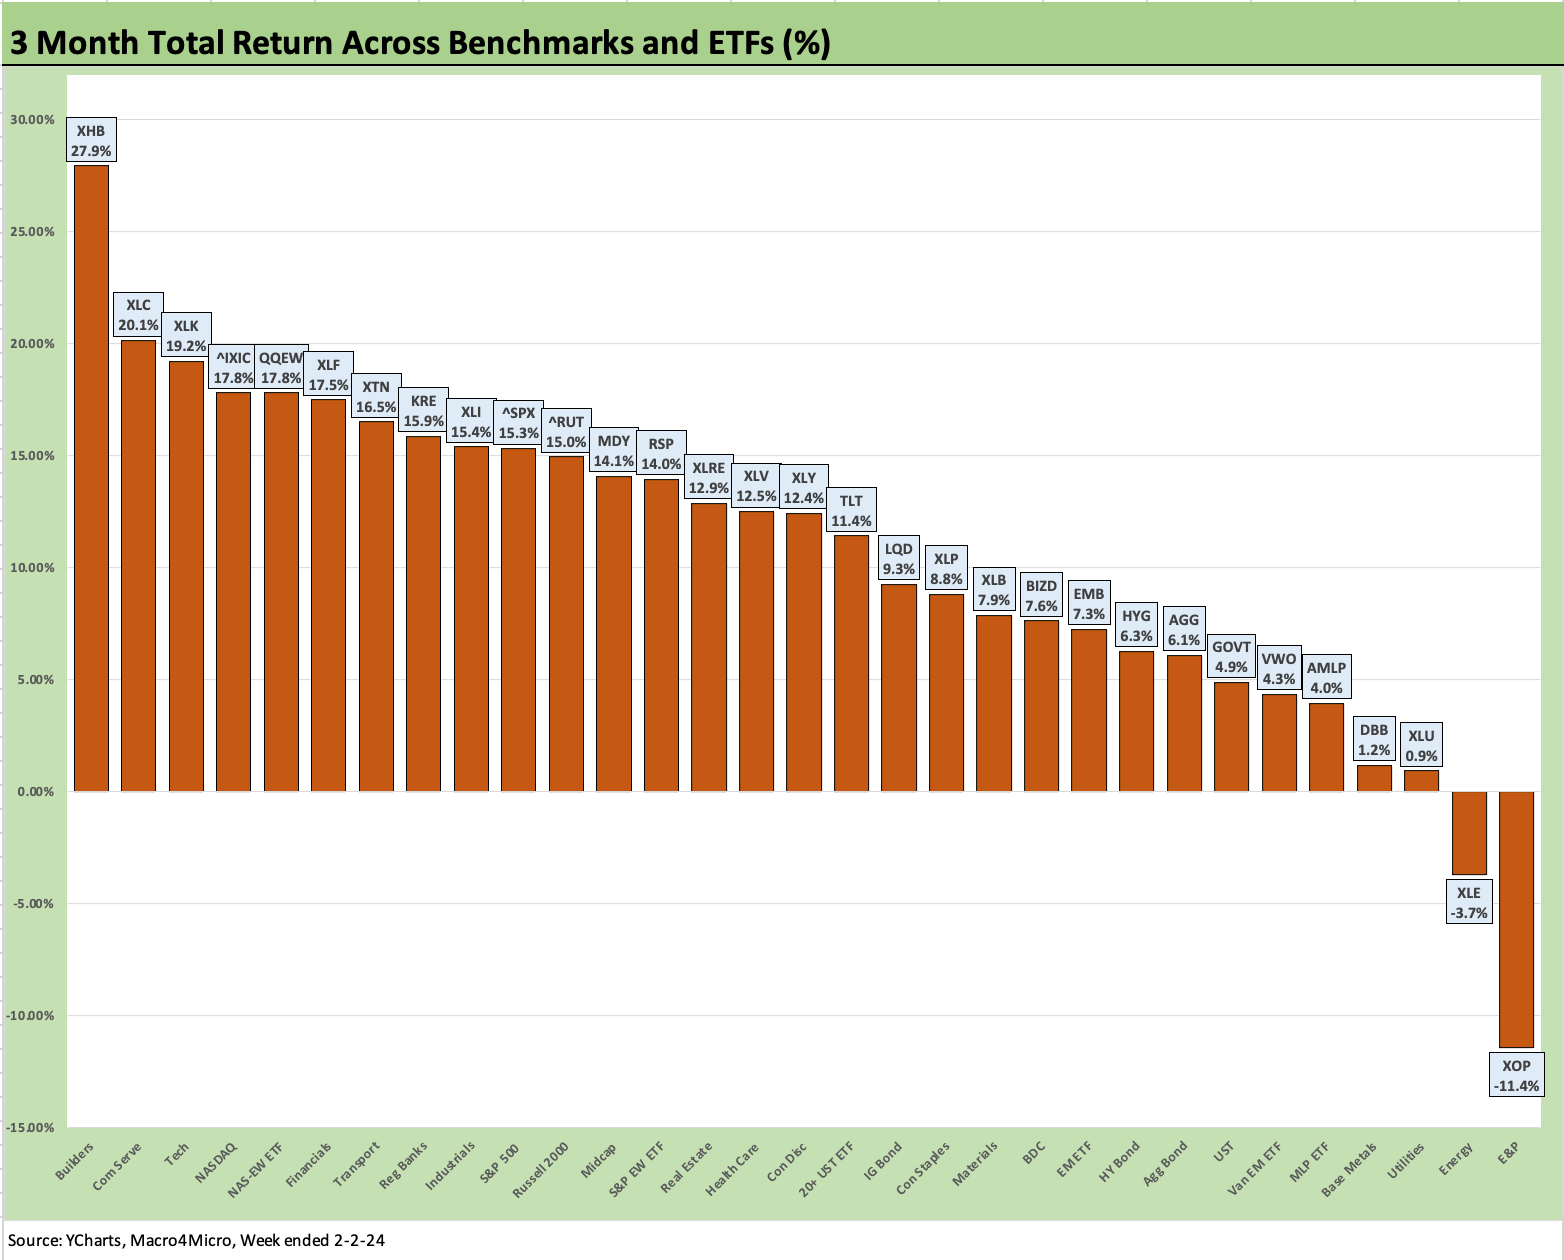
The above chart is still in a holding pattern for 3 months with a score of 29 positive and 2 negative (same as 12-31-23). The only two ETFs in the red zone include the Energy ETF (XLE) and E&P (XOP), which are the same two as at the end of 2023.
The rest of the lineup has seen some movement as Builders (XHB) are back in at #1 after KRE ended the year at #1 for 3 months as part of their 4Q23 rally. After the builders, the next 4 of the top 5 are all tech related before we get to Financials (XLF) at #6. Rounding out the top quartile is Transport (XTN) and KRE after their sharp recent drop reversed part of their late year rally.
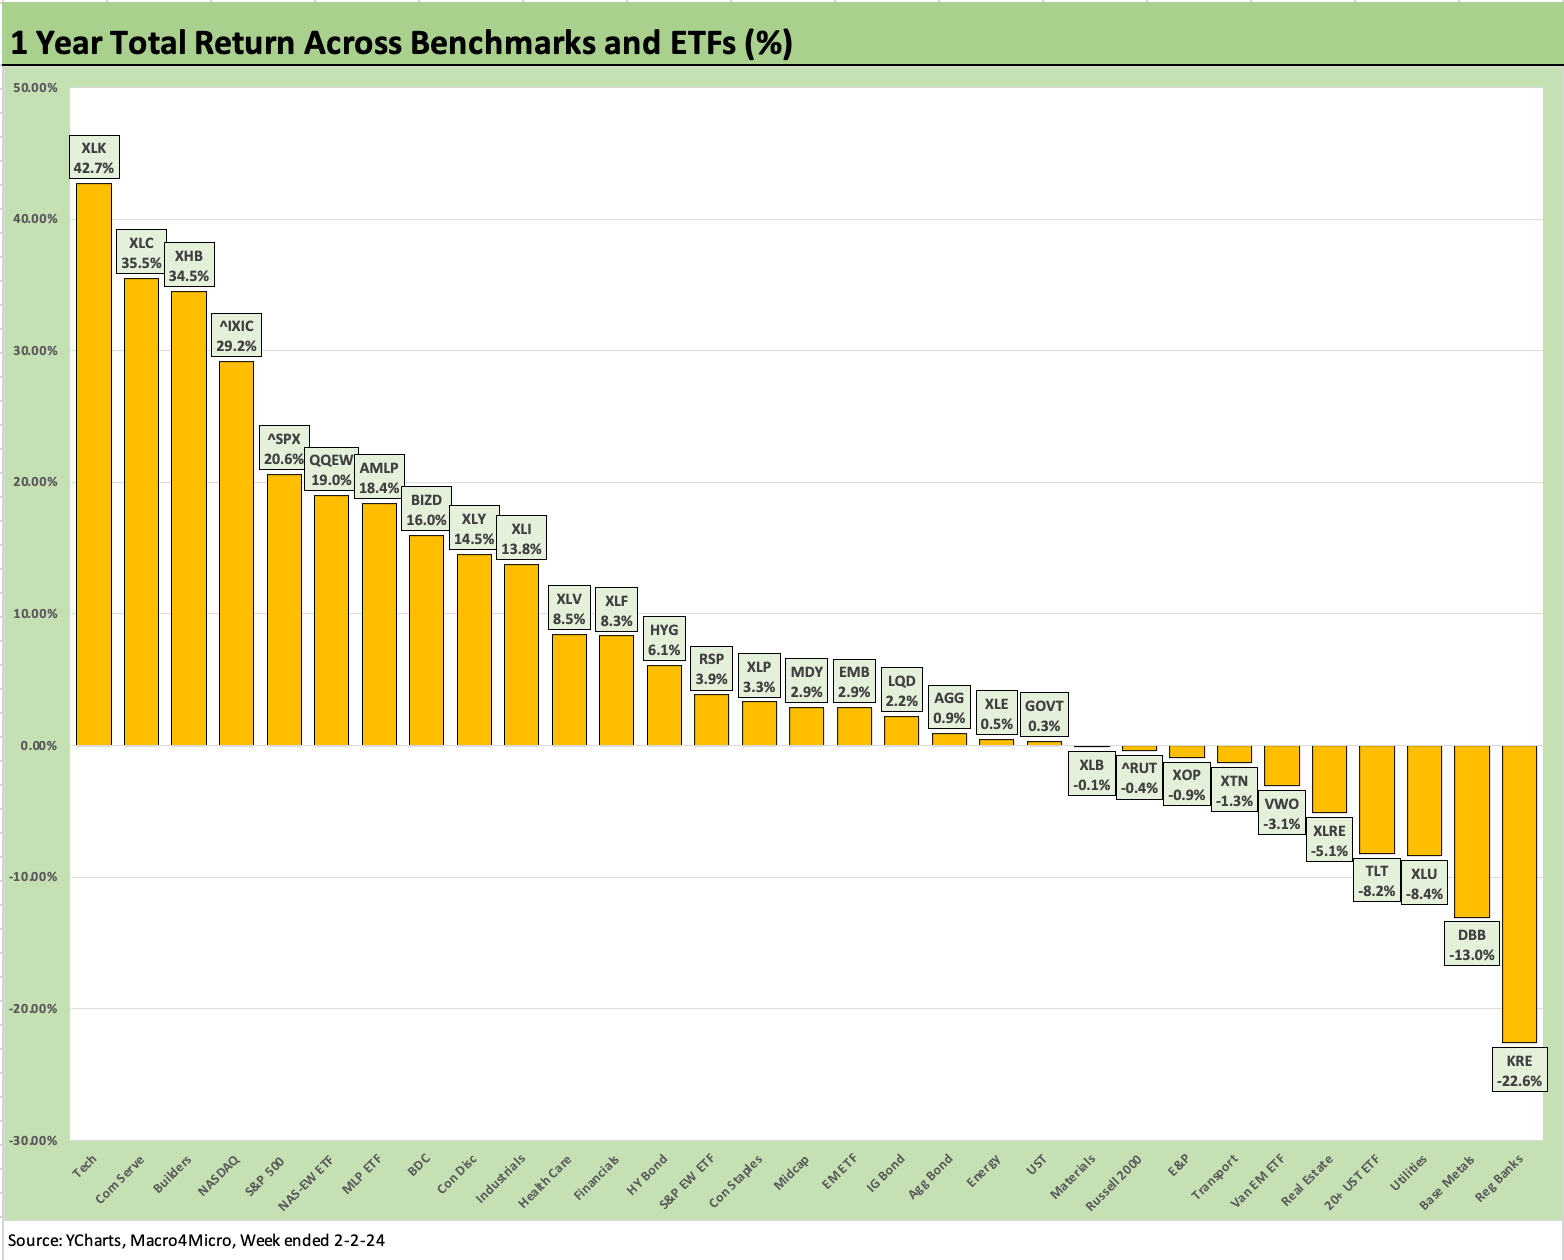
The 1-year time horizon as of Friday sees the negative count rise to 10 for a score of 21-10. That is up from 4 negative to end 2023 with Regional Banks still dead last by a large increment beyond the Base Metals ETF (DBB). Tech (XLK) is now firmly in the lead followed by Communication Services (XLC) as Meta and Netflix have crushed the overall market this month.
Homebuilders (XHB) are hanging in with good numbers despite some mixed concerns around equity valuation after industry leader D.R. Horton reported (see D.R. Horton: Credit Stronger Even if Stock Takes a Step Back 1-29-24).
The week ahead is less eventful in terms of econ releases, but the earnings wave continues with bellwethers such as Caterpillar, Ford, Ares (Ares Mgmt and ARCC), and some smaller scale stories that are very topical such as Spirit AeroSystems (Boeing MAX problems) and Hertz (EV perspective) and a number of OE suppliers in autos.
See also:
Payroll Jan 2024: Big Swing 2-2-24
Productivity: Takes the Edge of the 4% Handle YoY ECI 2-1-24
Employment Cost Index Dec 2023: Compensation Mixed Picture 1-31-24
JOLTS Dec 2023: “Little Changed” on Replay 1-30-24
PCE Release Dec 2023: Consumption Strong, Inflation Favorable 1-26-24
Histories: Asset Returns from 2016 to 2023 1-21-24
Consumer Sentiment: Multiple Personalities 1-19-24
Dec 2023 CPI: Big 5 and Add-Ons, the Red Zone Challenge 1-11-24
Credit Performance: Excess Return Differentials in 2023 1-1-24
Return Quilts: Resilience from the Bottom Up 12-30-23
HY Refi Risks: The Maturity Challenge 12-20-23
Coupon Climb: Phasing into Reality 12-12-23
HY vs. IG Excess and Total Returns Across Cycles: The UST Kicker 12-11-23
HY Multicycle Spreads, Excess Returns, Total Returns 12-5-23