
Payroll Jan 2024: Big Swing
The first payroll at bat for 2024 was a home run for economic cycle optimists but not so much for UST bulls.


The Jan 2024 Payroll increase of +353K almost doubled the consensus (~185K) with impressive positive Dec 2023 revisions piling on with another 126K for the prior two months (the Dec revision alone would be a good month) as new all-time highs in payroll make life a challenge for those trash-talking the economy.
We dig into the occupational line items as Services (+289K) dominates the additions and Goods (+28K) a relatively small contributor for the month with Government (+36K) modestly above Goods.
The +4.5% increase in wages continues the solid wage growth that keeps the Fed on edge even if productivity numbers were solid this past week.
With Amazon yesterday reporting a strong performance in sales online and in physical stores and through third party services for 4Q23, more payroll adds in retail trade in the jobs numbers, and recent releases showing lower savings rates and a big bounce in consumer sentiment, it gets hard to craft a negative consumer sector story line using backward-looking stats.

2024 is off to a bullish start in jobs numbers the same way they started in 2023 with an outsized move higher. A record number of bodies on the receiving end of a paycheck translates into higher consumption and economic activity, and presumably even more consumer credit leverage that a paycheck can bring with credit card eligibility. Those who lost their jobs first can perhaps avoid defaulting on credit cards that they had in place. That aspect of high job additions is a fact of economic life. In a “price x volume” world, sometimes it can be that simple.
What is more complex during an election year is how voters with diminished purchasing power feel about it. A lot more “capitas” in the per capita mix seen in a rising jobs count and wage levels still make for economic expansion. That in turn should be supportive of earnings and a fresh game clock on new borrowers to add some leverage to the system even as more of the legacy consumer borrowers fall into delinquency and rising charge-offs.
At a time when the FOMC game plan on “How many, how soon, how much?” will dominate the springtime market chatter, this latest employment news pushed the UST higher (+16 bps on 10Y UST as we go to print). That comes after a rally this week with some support from the productivity data yesterday (see Productivity: Takes the Edge of the 4% Handle YoY ECI 2-1-24). That news followed a mixed ECI release that was high YoY but at a multiyear low for the rolling 4Q23 period (see Employment Cost Index Dec 2023: Compensation Mixed Picture 1-31-24).
The +4.5% hourly wage number in the payroll report today does not help the FOMC mindset on cuts any more than a huge rebound in jobs, but the spring selling season is dead ahead and there is time to gather more data (notably inflation and more jobs) and handicap what happens in May (Next FOMC meeting March 19-20 with new projections, then April 30/May 1). With March a signaled “no cut” session from Powell this past week, the very next major headline was a monster beat out of payroll.
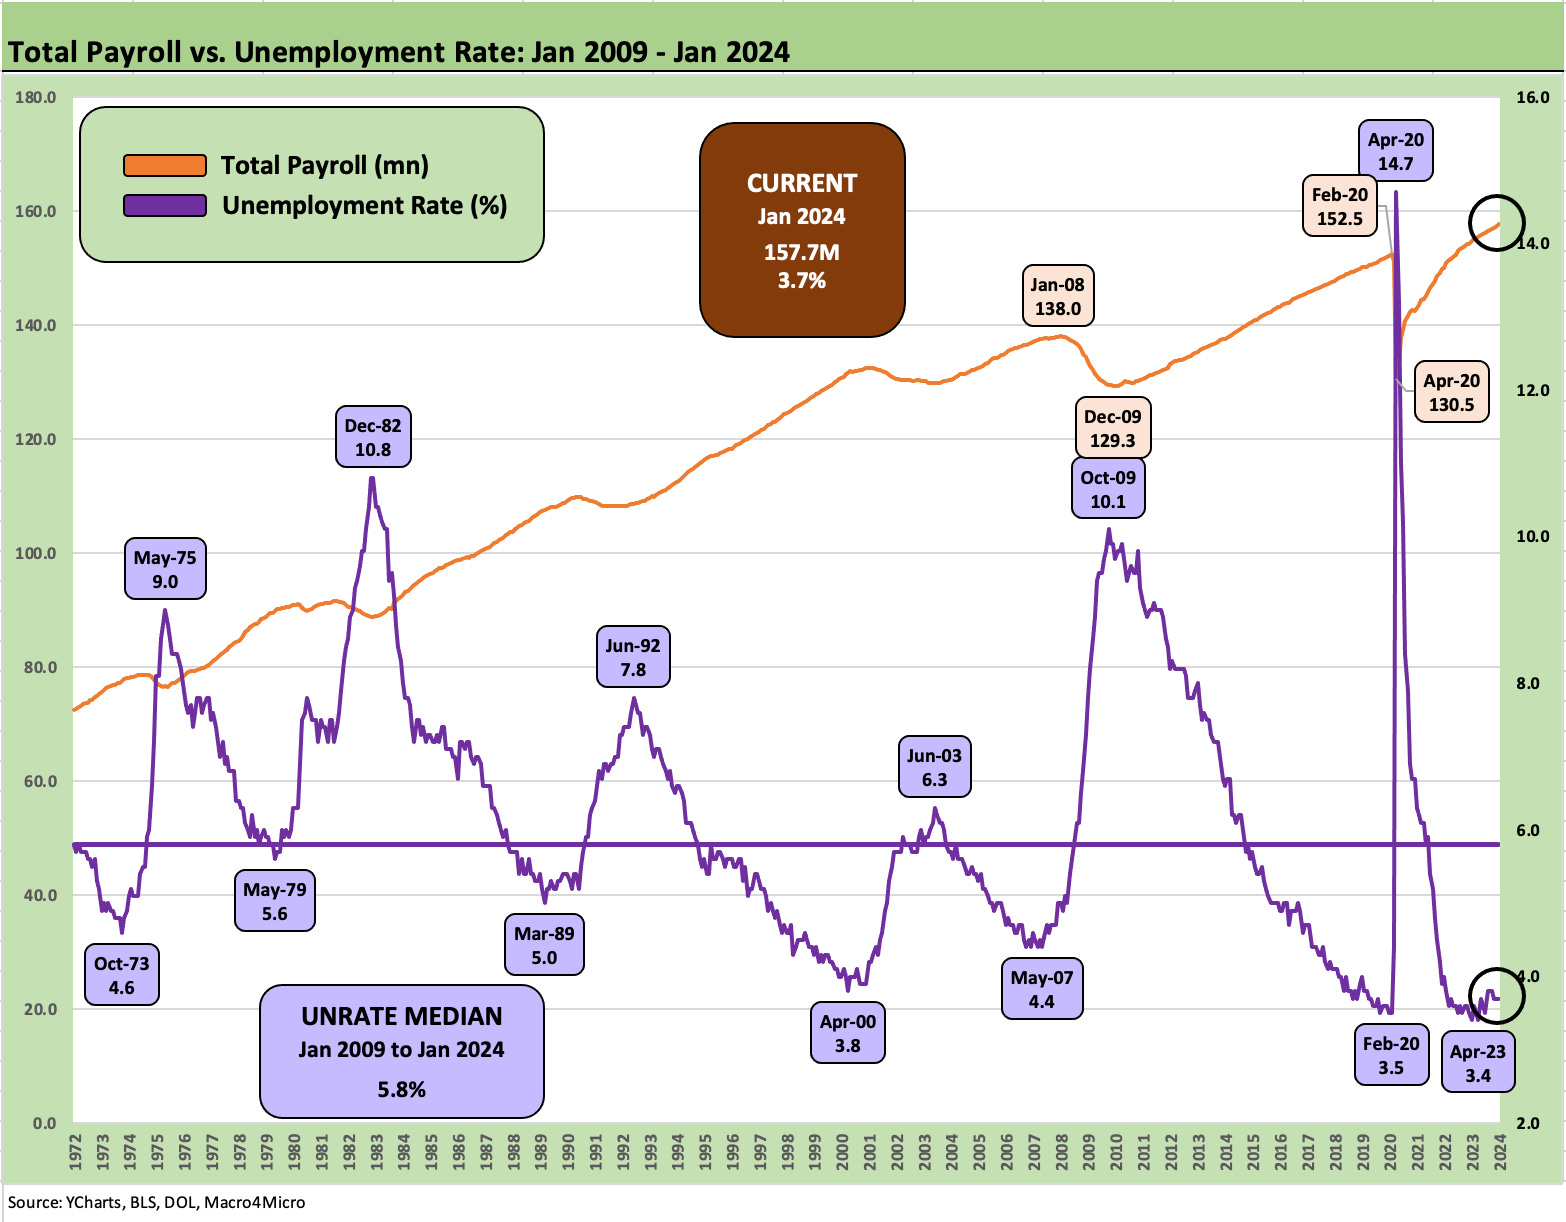
The chart above hammers home how a growing number of bodies in the payroll count today at over 157 million dwarfs past cycles. It is what a good economy looks like when there are favorable demographics and record population. It is as simple as the saying we often use “Mo Jobs, Mo Money, Mo Spending!” The quality of the jobs, structural underemployment, wage disparities and income inequality, and the politics of taxation (federal state and local income taxes, sales tax, etc.) are still secondary to job counts over the short term.
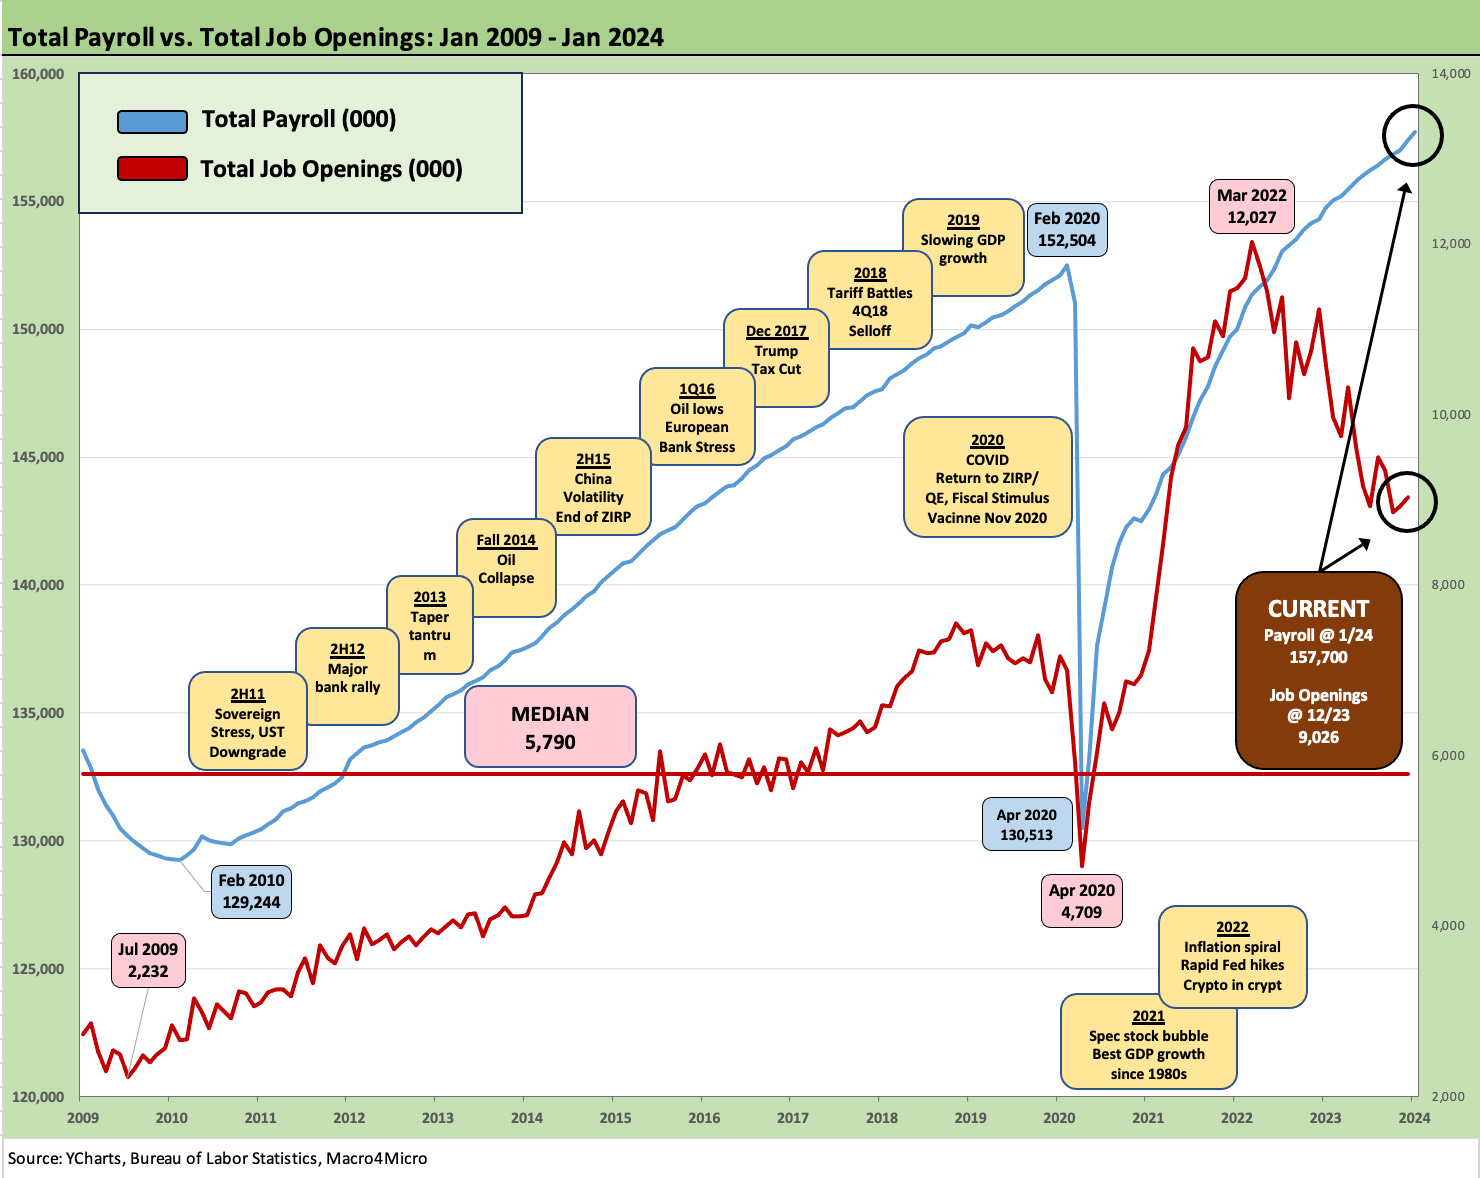
The job openings tally from the JOLTS report of 9.0 million (see JOLTS Dec 2023: “Little Changed” on Replay 1-30-24) is still well in excess of the 6.1 million in total employed to end January 2024. Even if the peak job openings in March 2022 was 12.0 million as the tightening cycle was just starting, the total payroll has risen to a record with plenty of jobs still available.
The “Where do we go from here?” question is not new, and the guidance to this point in the Dec quarter reporting season is not showing net negative signals even with a fair amount of restructuring and job cuts rolling into the headlines. More jobs translating into more spending is not on the leading indicator checklist for recessions, and that is especially the case with most of the handicapping being on when rates are cut and how much the UST curve might shift lower as inflation declines. Monetary policy will be neutral at worst most would agree.
Spring selling seasons for some key sectors (autos, housing) are on the immediate horizon, and there is still a wave of projects underway driving suppliers, OEMs and services providers despite anxiety around EV demand and mortgage rates as a brake on more housing activity in existing home sales.
Below we get into the line item details by occupation. The easy takeaway for the UST bulls is that the good news is concentrated in services and some without the merit of sustainable growth and multiplier effects (retail, health care and social assistance). We have seen lukewarm results out of some volume sensitive sectors such as freight, and consumer credit quality is eroding. Then again, 353K more paychecks are nothing but good for demand and arguably bring a new game clock on some consumer credit to increase buying power.
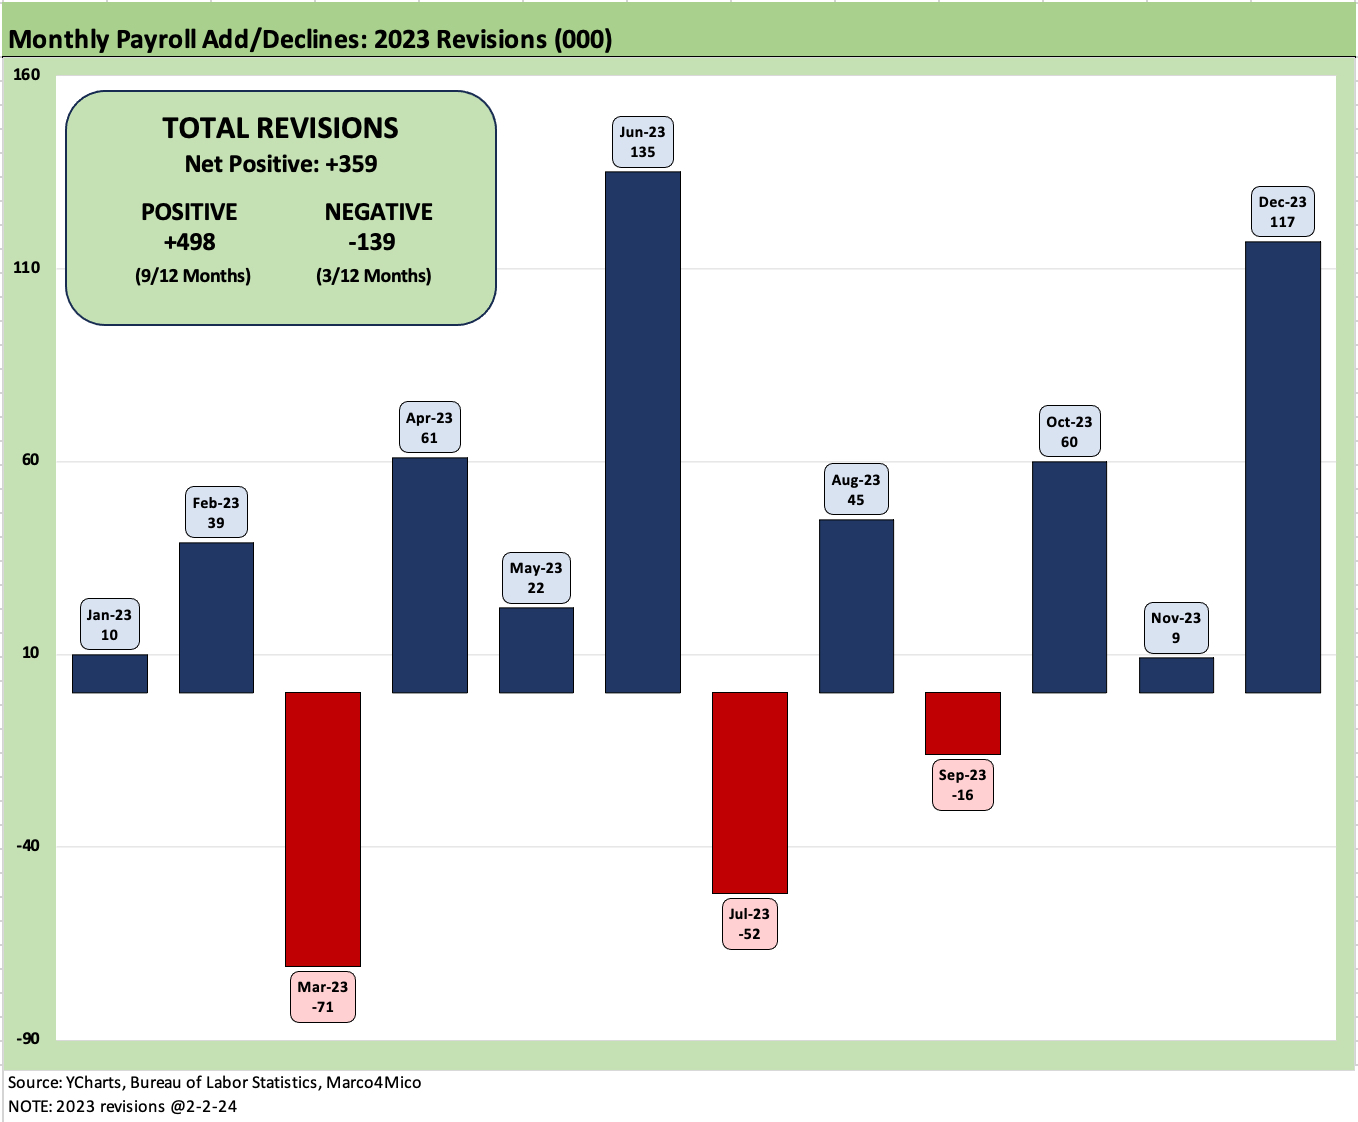
The annual January exercise of seasonal adjustments rolled into monthly revisions as detailed above. We see 9 revised up and 3 revised down. As a side story of “fun with numbers.” this past week I was watching Fox Business (I prefer CNBC but it is always fun to watch how the axed can spin economic numbers).
Fox had a bar chart such as the above on the screen that showed how many negative revisions there were after the first numbers. The inference was manipulation and conspiracy theories. As I recall, almost the entire chart was negative with no net chart provided showing the final numbers for the final adds. For the less informed Fox watcher tuning in, they might have mistakenly thought the whole year was negative when the whole year was decidedly positive every month with material job additions and has been for years.
The reality is that the Biden term has added over 15 million jobs to date for a +10.7% increase. That 15 mn job increase is a record while the +10.7% added is the highest % increase since Reagan’s second term at +11.2%. The post-1972 record in % growth was Jimmy Carter at +13%. Carter entered office a year (1977) after the then longest-recession since the Depression and after a gut wrenching period of stagflation from late 1973 into early 1975 under Nixon/Ford.
While we don’t expect Fox to post the job add chart above any time soon, they also will not highlight that only two presidential terms saw negative jobs since 1972. That was GW Bush’s first term at a small job loss of -85K or -0.1%. That was more than offset in Term 2 by GW. So, in the end GW Bush added jobs over 8 years despite two wars and a credit crisis.
The only other negative job creation for a term was Trump at -2.9 mn jobs lost over his single term and 4 years. If we leave out COVID and year 4, the first 3 years saw a +4.4% increase and 6.4 million added. That was well below Obama’ second term whose 4 years in Term 2 saw +10.3 million jobs at +7.7%. That was the economy Trump inherited. Trump underperformed in his first 3 years also. Those are just the numbers. Not an opinion. Greatest economy ever?
History shows the dagger for Carter was inflation. I had the honor to graduate in college in June 1980 when inflation and unemployment drove the peak of the misery index to 22% with inflation at a scorching 14% handle. When the election came, the recession was a fresh memory (recession trough was in July 1980) in what became a double dip recession in 1981. The misery index was at 20% for the Carter vs. Reagan election.
As of now, the unemployment rate of 3.7% and CPI of 3.4% puts the misery index around 7.1% for Biden. The economy is just off a solid 3% handle GDP advance print for 4Q23 following a +4.9% print in 3Q23. Inflation is trending lower.
Carter is a very limited parallel. Plus, Carter was running against a dynamic leader (Reagan) who carried a very positive message. Reagan had been in the reserve before WWII and served during WWII (even if in the rear echelon of LA). Both Carter and Reagan were veterans. Reagan is a contrast to Trump (see Political Economy: The Contrasts are Not Hard to Find These Days10-3-23), who vigorously avoided service and carries the tag of draft dodger by the objective. He sought to avoid going near those forts named after Confederates. He was not as fascinated with them in 1968.
Should be an interesting year.
The jobs picture by occupation…
In the following charts and table, we update how the occupation lines framed up after this latest release. We look at the composition of this major monthly swing and a range of payroll deltas in broad categories and some important occupation classifications.
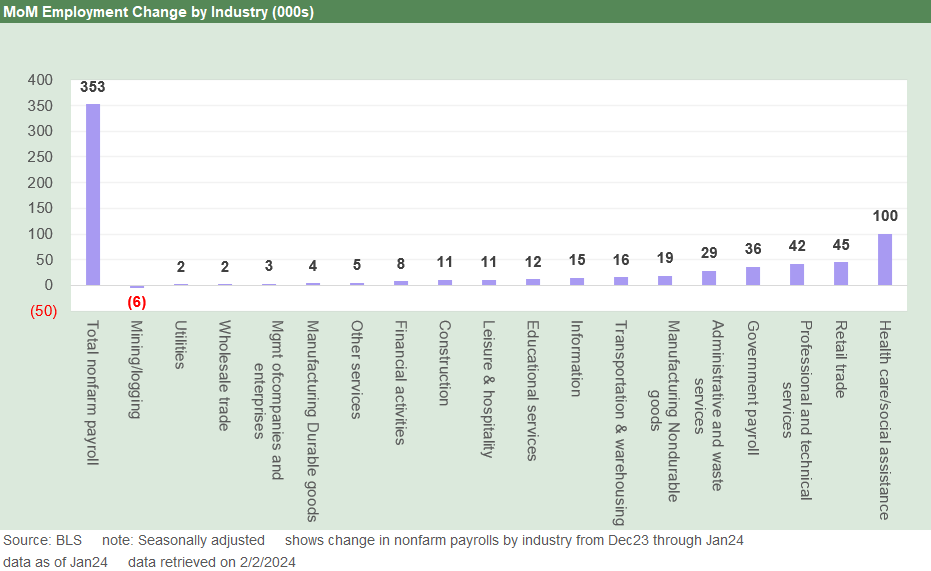
The above chart breaks out the mix of the 353K in job additions. Health Care and Social Assistance lead the ranks followed by Retail. The Health Care and Social Assistance piece can be heavily tied to demographics (growing and aging population) and in part the ability to economically provide services and hire personnel (the Affordable Care Act).
Healthcare will be a hot topic this year as Trump has made it one of his life’s missions to repeal the ACA. The US population is now in its 8th year of waiting to see what he will replace it with. He is a busy man in contemplating the US legal framework, but he clearly has never made the ACA replacement enough of a priority to detail the ideas (GOP had no platform in 2020).
I think back to the debates between Hillary and Obama where it was metaphorically hand-to-hand and literally brain-to-brain combat on the issues. It is easy to doubt the ability of either likely candidate in 2024 to debate and discuss the topics involved and frame the economics of healthcare (around 18% of GDP). But only Trump wants to repeal it.
The macro angle on the risk of repeal thus flows into jobs directly as well as indirectly as health care costs could cripple many consumers and households and discretionary spending would get badly squeezed. That is not partisan. It is math. Some now-dead (McCain) or politically extinct center-right GOP moderates saw that damaging effect on households from their health to the economic knock-on effects. They killed Trump’s one shot at it with no replacement in hand.
The indirect effects on payroll will be hard to see, but the historically understaffed health care profession added 1.4 million jobs since the beginning of 2020 (see reconciliation in Services further below). That million plus jobs are worth thinking about as a starting position on what the ACA repeal would endanger.
If household cash flow gets detoured away from other uses (staples or leisure), some fallout will go under the heading of “multiplier effects.” You can easily connect the dots from a health care cost spike to reduced retail jobs as households spend less. Retail is only back to just above where retail payroll stood just before COVID. So those are the two largest lines of job additions above that would be under siege. This wouldn’t do wonders for hospitality and leisure either.

The above chart updates the running payroll deltas since Jan 2020 just ahead of COVID. The two that we think stand out are at #3 (Transportation and Warehousing) and #4 (Construction). We detail the Construction changes by line item further below, but the infrastructure bill and a range of megaproject public/private initiatives (semis, EV supplier to OEM chain, LNG, etc.) are generating a lot of jobs.
The construction boom (see Construction Spending: Timing is Everything 12-1-23, Construction: Project Economics Drive Nonresidential 10-2-23) has flowed into jobs beyond construction. After all, there is a lot of activity that feeds the projects across materials, components, freight and logistics, supporting services business lines, and the usual array of knock-on effects from the local retail operation to the local tax base.
There is a reason they bring up multiplier effects in intro economics classes. Construction brings plenty of multiplier effects but health care and social assistance “not so much.” Construction overlaps with Transportation and Warehousing given the “smart warehouses” and tech demand along with connected vehicles (and a lot more of them). That includes autonomous vehicle investment and EVs. There is a lot going on out there for those who read the freight trade rags.
The Transportation and Warehousing employment line marks another secular shift with the word “Amazon” at the top of the specific company list. AMZN is the new #1 in transportation services ahead of UPS and FedEx (see FedEx: Stability Counts, Complexity Challenges 1-23-24).
The COVID supplier chain meltdown was a wake-up call for providers of freight and logistics operators as costs of freight soared and infected prices. Supplier chain stress revealed many structural weaknesses that service providers could control. Technology and physical structures and vehicles all played a role. That ties into economic activity from the consumer demand side to the goods and services players.

The above chart breaks out the total sector payroll counts and deltas. The mix of 134.6 million private sector and 23.1 million in public sector (government) comprises the 157.7 mn. The 2.9 million jobs added over the LTM are impressive with 2.3 million in the private sector. For government adds, we would flag that 515K of the 601K were state and local employees and only 80K Federal (ex-post-office).
Manufacturing additions remain anemic at +37K while Construction stood at +216K in the goods-producing buckets. Upstream energy is not directly as labor intensive as services or manufacturing, but there is some overlap with construction on the multiplier effects and mega projects.

The above chart looks at total manufacturing but with a more granular look at durables (the next chart is nondurables). Durables LTM was a solid 71K with nondurables in the negative range at -34K. Transportation equipment was over 100% of the durables total at +77K for LTM with 40K of that in Motor Vehicles.
The investment in EV and related infrastructure has driven a lot of jobs and favorable multiplier effects in both red and blue states. The transplants stay out of the political fray around EVs and just keep investing in the expansion of their operations in the US including finance and dealerships.
Some transplants such as Hyundai are partnering with Amazon on downstream initiatives in online retail. That will perk up the auto retail operators and what they are up to. The dealers will be the sellers with Amazon serving as an e-commerce distribution channel. Hyundai is using Amazon’s AWS unit as “its preferred cloud provider to accelerate its digital transformation.” Online retail will remain a major factor in “leaning” the supplier and distribution chain.
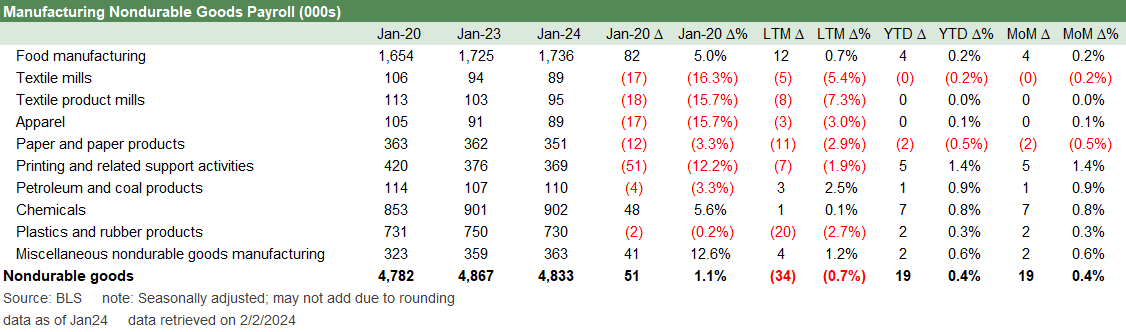
The above chart updates the always-lagging nondurable payroll counts. The LTM delta was -34K jobs, and since Jan 2020 +51K on the back of food manufacturing at +82K and chemicals at +48 with almost all other major categories in the red.
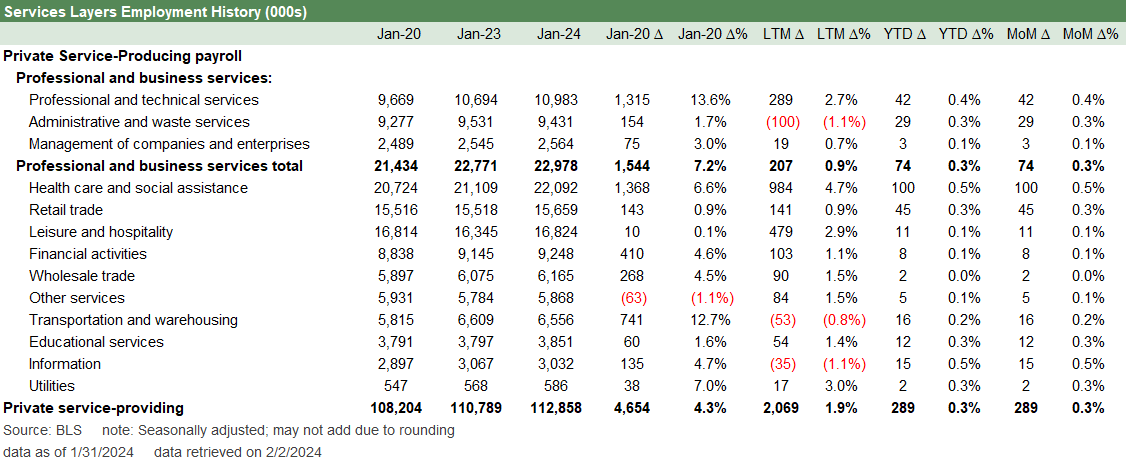
The above chart details Services as the 800 pound gorilla of the payroll count with 4.65 million added since Jan 2020 and 2.1 million LTM. We see Leisure and Hospitality back ahead of Jan 2020 finally at +10K on its base of 16.8 mn payroll while Retail had earlier reached positive numbers vs. Jan 2020 and is now only +143K higher than Jan 2020 with its base of 15.7 mn jobs.
As detailed earlier, Health Care and Social Assistance keeps on riding the demographic wave and improved health care affordability with +984K added to payroll LTM and 1.36 mn added since Jan 2020. The +4.7% LTM increase on a large base level reflects both demand and supply.
The retracement risk of massive job loss if ACA is repealed is not hard to see and is not a major conceptual challenge. That will be a political topic even if many in the GOP would prefer to avoid it. Those turning away Medicaid funds from the federal government on an ideological basis are limiting their job counts and constraining household ability to spend elsewhere. That is a political choice in low-risk political areas.

The above chart updates the construction headcount we have looked at regularly in past commentaries. The 216K adds LTM and the 557K since Jan 2020 are material needle movers. We see a wide range of markets affected from private sector to public sector to residential, commercial, and civil projects.
The construction lines tell a story of skilled and semi-skilled job expansion and more economic activity. That all flows into consumer spending. The multiplier effects are intuitive across materials, manufacturing, freight and logistics, financial services (insurance and lending), local tax base increases, and more.

The above chart updates the Government payroll stats. The material increases and scale of employment at the state and local level sometimes gets lost in translation given the political soundbites around Federal budgets and runaway “big government.”
Budgets are big at the Federal level, but the headcount is only +119K since Jan 2020 at the Federal level with 80K of that LTM. State and local payroll is 87% of total government payroll. Federal payroll ex-Post Office is 10% of total government payroll and 1.5% of total US nonfarm payroll.
An argument worth having is how productive those 23.1 mn bodies on payroll are in their jobs, but that is a different discussion. The same is true in Congress! Anyone running on purging the Federal payroll might lose tens of thousands of votes in the process. Good luck with that.
See also:
Productivity: Takes the Edge of the 4% Handle YoY ECI 2-1-24
Employment Cost Index Dec 2023: Compensation Mixed Picture 1-31-24
JOLTS Dec 2023: “Little Changed” on Replay 1-30-24
PCE Release Dec 2023: Consumption Strong, Inflation Favorable 1-26-24
Consumer Sentiment: Multiple Personalities 1-19-24
Dec 2023 CPI: Big 5 and Add-Ons, the Red Zone Challenge 1-11-24
Dec 2023 Jobs: Not Feeling the Early Ease 1-5-24
Employment: What 200K Handles on Initial Claims Means (Not Much) 12-16-23
It would be extra terrific if the jobs added were more full time and less part time I think I saw 133.2 mil full time a year ago and 133.1 mil full time this month agree paychecks are paychecks but tough to actually live on multiple part time work