
Dec 2023 CPI: Big 5 and Add-Ons, the Red Zone Challenge
We look at the Dec CPI moving parts and add a new chart with Special Aggregate Indexes and our favorite “CPI-ex” metrics.

Overall, the Dec CPI index was a negative for the UST curve and FOMC bulls with headline CPI ticking higher to +3.4% from +3.1%, but the dip below the 4.0% line on Core CPI to +3.9% beats the proverbial stick in the eye.
We frame the YoY CPI trend line by major categories that comprise 75% of the CPI index in the Big 5 and around 86% of the overall CPI index when we include the Add-Ons.
We add a new chart this month with a collection of the special index aggregates that we favor, and we see “All Items ex-Shelter” tick higher to +1.9% YoY from +1.4% in a mild setback for CPI trends.
For some sequential adverse month-to-month moves, Energy moved sequentially higher on the month from -2.3% deflation to +0.4% inflation with some line items such as New Vehicles (-0.1% in Nov to +0.3% Dec) and Apparel (-1.3% to +0.1%) shaving off some CPI support.
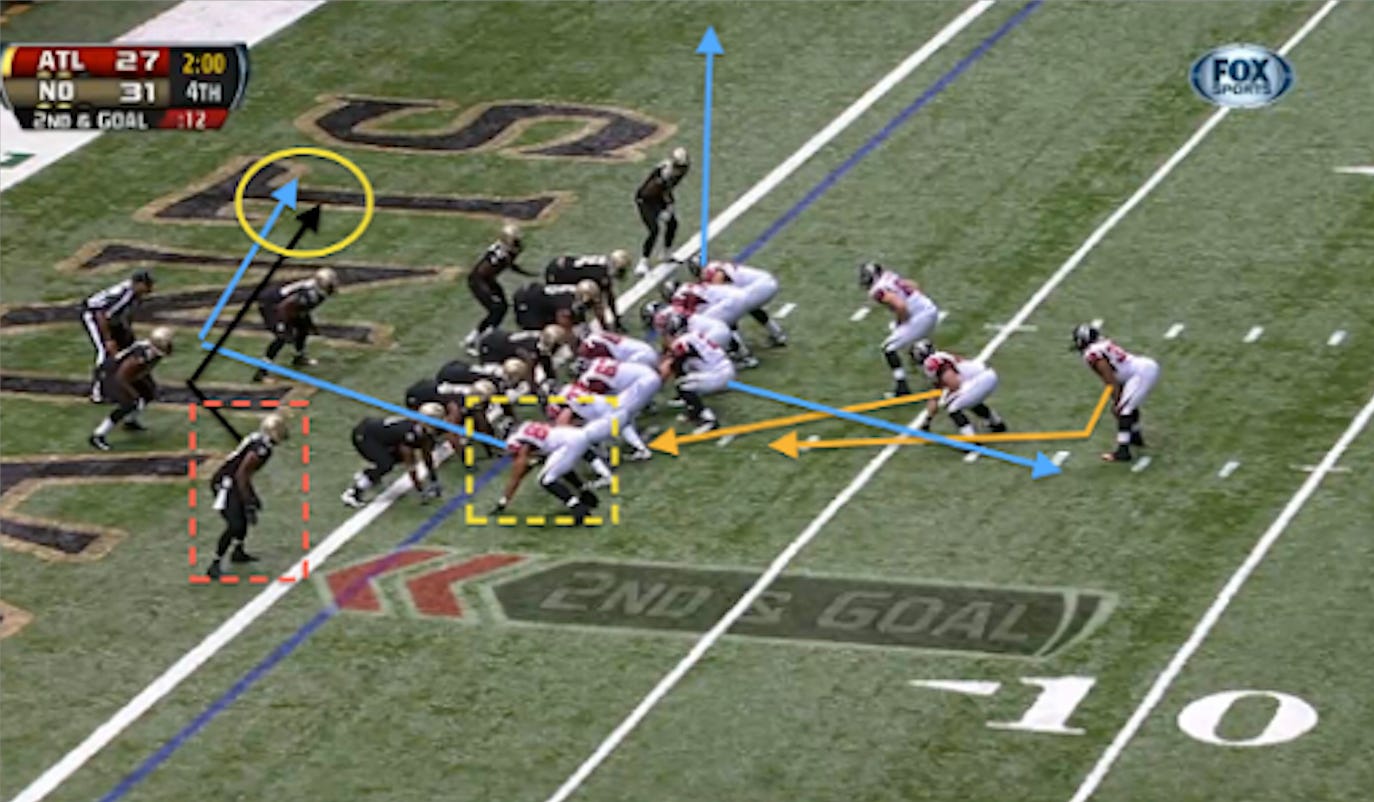
We use the US football metaphor of the “red zone” in the picture above since those last small number of yards to score are usually the hardest. The passing game in monetary policy (tightening) is risky at this point without taking the chance of an interception in the end zone (i.e., a recession). The Dec 2023 CPI number was not reassuring on that last handful of yards.
We expect the Fed to grind this one out in 1H24 until the CPI and PCE numbers get to where they want the data. We will see if PCE inflation later this month gets the FOMC closer to the mark. We get PPI tomorrow and a slew of data next week including Retail Sales, Industrial Production, and a fresh batch of housing stats.
Getting the needle to move with more challenging YoY comps and a robust labor market and coming off a near 5% GDP quarter with some major end markets in recovery (e.g. construction, homebuilding, autos) is the balancing act for UST and equity bulls. The data has been mixed across many of the releases with employment holding in the “no cuts yet” camp.
On the other hand, the ISM numbers are telling a story of contraction (see Dec 2023 Jobs: Not Feeling the Early Ease 1-5-24, Employment Part Deux: Unemployment Claims Update 1-6-24). Some consumer credit metrics are also going in the wrong direction.
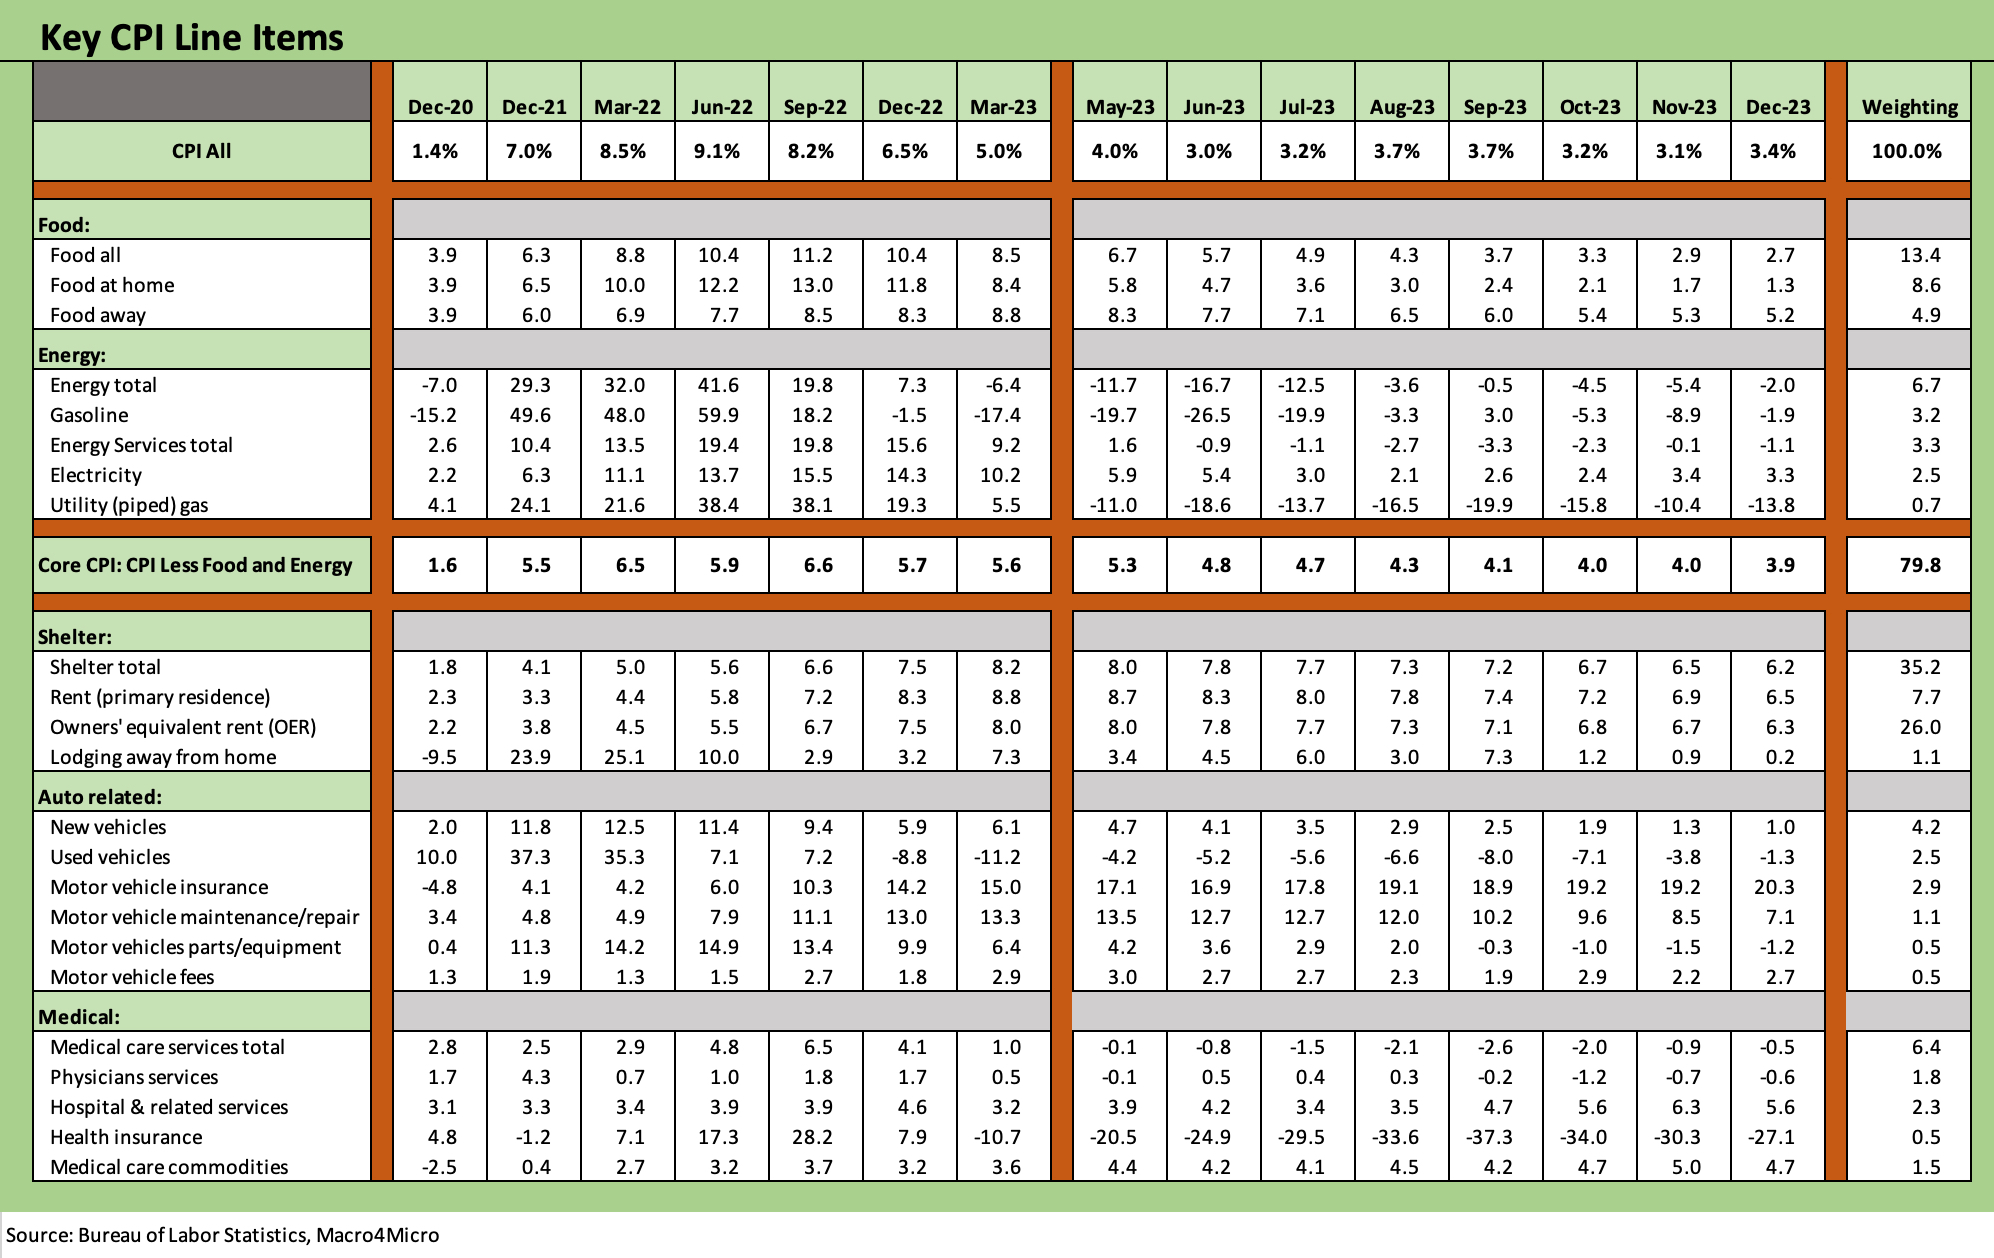
The Big 5 CPI buckets are broken out above. We created our own version of Automotive inflation through a collection of line items to more accurately capture the high cost of owning and using a vehicle in the US (see Automotive Inflation: More than Meets the Eye 10-17-22). Autos are close to the size of Food in the life of the household. We even left out gasoline from the Automotive roll-up since we have it in energy. Gasoline would tack on another 3.2% of the CPI index if we moved that over to Automotive. That would make the automotive segment larger than Food. The most painful line item in the auto mix is insurance while motor vehicle maintenance and repair has moved lower in recent months.
Services remain the hurdle on CPI Core metrics…
Services has been the main culprit in the inflation stickiness theme and headwind to getting CPI lower. That is most notably the case with shelter as we have covered in many past commentaries. We looked at the main long term trends recently with a closer look at Shelter, Energy, and Food (see Inflation Timelines: Cyclical Histories, Key CPI Buckets 11-20-23). Getting deflation in food of the sort you see in Energy is just not a realistic goal based on history as we detail in that commentary.
The push by more economists and brand name market participants to make the goal 3.0% rather than 2.0% is understandable. To beat the metaphor senseless, that would be the equivalent of “taking the field goal” on the 3 yard line. The FOMC needs and wants the discipline of the 2.0% line and has ample historical data to back up that target. Reaching it and sustaining it outside a recession is the goal.
The Big 5 still fighting the Shelter battle…
The frustrating Shelter metric at over 35% of the CPI index is still a big hurdle as that line item has ticked up slightly at the month-on-month level since Oct from +0.3% to Nov at +0.4% and to 0.5% in Dec. The YoY unadjusted for Shelter total is at +6.2% and Owners’ Equivalent Rent (“OER) at 26% of the CPI Index is +6.3% YoY unadjusted. The “Rent of Primary Residence” weighed in at +6.5%.
We have often discussed the OER in the past and will not replay that again, but it came with a changeover in CPI methodology in 1983. It is a theoretical, implied cost of shelter services. It is not a cash cost line item since it is derived from rental data. The idea was the mix of regional rental trends would take this lower in 2023 and into 2024, but that has not happened at a meaningful pace. Saying OER lags would be like saying rings of the redwood lag.
The Add-Ons show mixed pricing power with consumer sector spending…
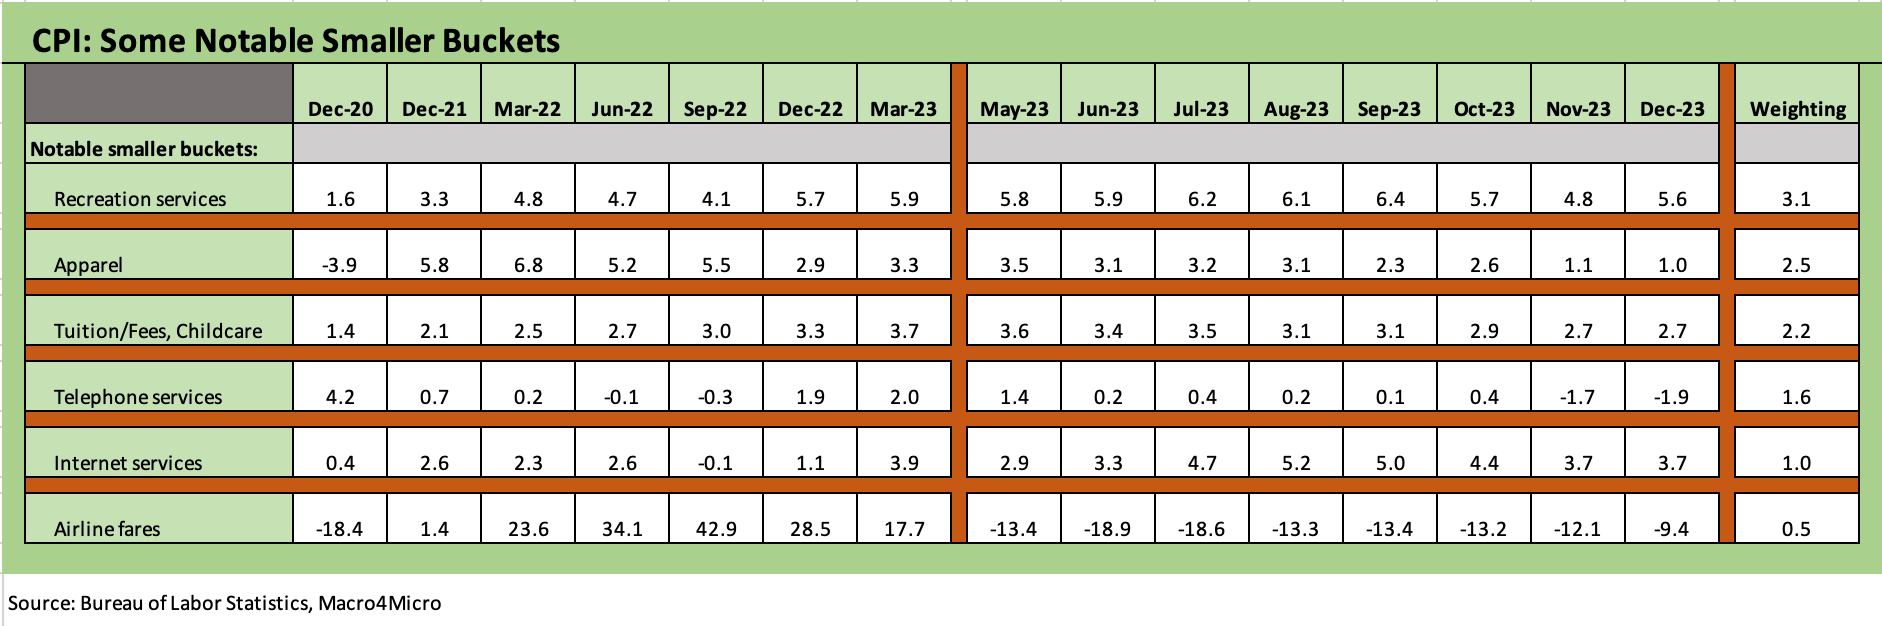
We show these add-ons since they capture another 11% or so of the CPI index weighting each month and are near and dear to the hearts (and budgets) of many households. Apparel ticked higher on a MoM basis Dec 2023 but remain well below its highs at +1.0% YoY with its 2.5% weight in the CPI index. The increase in the monthly sequential move was from deflation into very low inflation.
We see +5.6% for Recreation Services which totals a +3.1% weighting in the CPI index. The price trends show the health of consumer demand with consumers seeking to relax and enjoy a range of services from streaming media to movie admissions. This category should not be confused with eating and drinking out on the town. Food away from home is in the Big 5 and was +5.2% vs. +1.3% for Food at home. Services providers with rising labor costs or delivery costs are likely pressing providers to move the needle on prices.
Special index aggregates and select favorite “CPI ex” metrics…

We add the above chart to our monthly CPI collection to offer up more angles on CPI trends. We tend to look at Table 3 of the CPI release right after looking at the headline and CPI Core numbers. Some of these adjusted metrics offer different perspectives or clarification on what is moving the needle (or not).
All items less shelter: The ex-shelter metric is the first thing we look at on Table 3 since it backs out a number that has more than a few asterisks on it given the murky utility of “Owners’ Equivalent Rent” as a guide to the life of the consumer and the ins and outs of the household checkbook. We saw this metric move higher this month, but it remains quite low. With a running 3 months of 1% handles, we don’t expect that CPI ex-shelter to show up in the GOP election playbook. The main inflation battle is over in the non-shelter services at this point anyway. At some point, multifamily supply is supposed to support lower rental costs and that in turn can fuel OER declines.
All items less food, shelter, and energy: We are not saying “stop eating, stop driving, turn off the heat, and sleep in an alley.” This metric just offers another angle on core trends but removes the highly questionable and overstated (and conceptually much debated) shelter CPI metrics. At 2.2%, the “Less food, shelter, and energy” number shows much of inflation is in check after 6% and 7% handles in 2021.
How OPEC will behave on supply and dovetail with global demand for oil will play out is another part of the inflation analysis. The US is running at record oil and gas production. The price of oil is always a wildcard. Trump is campaigning on the idea that he can control gasoline prices (he is bored with parting the Red Sea, but maybe can wall off the Houthis with his staff. After all, Trump believes he’s done more for Israel than anyone since Moses). Meanwhile, Biden hurt his credibility by going hat in hand (and tanker on standby) to the Venezuelans and Saudis. For those keeping score at home, oil supply is set on a global scale on supply-demand basics while the mechanism is more regionally driven for downstream refined product imbalances.
Durables and Nondurables: As you scroll down to other metrics in the special aggregate indexes such as Durables and Nondurables in 2021, you can see where some of the relief has come from in 2023. The supplier chain imbalances in the face of soaring 2021 demand told a big part of the inflation story as COVID played out with mid-teen inflation in Durables and Nondurables, extending into 2022.
The swing across time in the goods market certainly makes a strong case for “how ugly it was” and for “how much better it is now” with durables deflation in the chart. As we look back at 2021 and 2022, the scorchingly high revenues and soaring profits of the shipping companies had multiplied record profits “many fold” for global freight and logistics providers. Those tailwinds coming out of the COVID meltdown tells a longer and more complex story about inflation. The shipping companies saw profits climb off the charts with rate hikes and port meltdowns playing to excess pricing power.
The shipping costs need to get passed on, and that might have been the hint for the deep thinkers in DC that there was more to the story than a COVID stimulus package here and there. Whether it was the corporate bias of the COVID relief in the bill signed by Trump in Dec 2020 or the more household oriented benefits package signed by Biden shortly thereafter when the election flipped control to the Democrats, supply and demand of “deliverable” goods played a role. That relationship will always matter even if many politicians don’t bring it up.
Our simple view on inflation…
The main point in the chart above is that different line items spiked at different times, and there are reasonable, identifiable, and explainable economic, fiscal, and monetary policies at work. We are not going to revisit all of that here since it has been ongoing since 2022 as we (and plenty of others) were writing about inflation trends in real time.
The shortest form we have for 2021-2022 is as follows:
Crippled supply chains mean supplies of goods are tight.
Fiscal stimulus and cash payments to companies and households turbocharged demand.
Shipping companies with quasi-monopoly power in some cases (notably major container shipping operators), port operational stress, and badly impaired rail and motor carrier functionality led to soaring shipping costs and surcharges that needed to get passed on.
Spiking oil and gas prices drive up fuel costs, operating costs, and material costs that flow into many more sections of CPI than Energy with companies exercising pricing power even as we see the same freight and logistics pricing effects on surcharges.
ZIRP monetary policy further inflamed demand for material and labor and made the supplier congestion worse.
China lockdowns were nothing but bad for supplies with China as the exporter to the world.
Very high pricing power leads to higher profits and those profits are used to reward shareholders and hire more to grow the business.
The revenue and profit cycle feeds the virtuous cycle of consumption and profit and more investment.
More consumers consume, more consumer credit companies lend, more consumers borrow, and more spending continues. You see that in sustained PCE growth.
Prices rise, and then prices rise again.
The pace slows as the Fed tightens and supplier chains somewhat normalize.
Whether consumers run out of excess liquidity and start defaulting on credit cards and jobs get trimmed back for a wide range of reasons in corporate America is the 2024 question.
Of course, there is a lot more infill on inflation points and drivers (Fed, FOMC, fiscal action, the M1/M2/M3 junkies, currencies, etc.,) but it beats just narrowing it to “It was COVID” or “It was Biden.”
See also:
PCE, Prices, Income, and Consumption: Goals and Assists 12-22-23
FOMC: Hail Powell the Dexterous 12-13-23
November CPI: The Big 5 and Add-Ons 12-12-23
Inflation Timelines: Cyclical Histories, Key CPI Buckets 11-20-23