
PCE Release Dec 2023: Consumption Strong, Inflation Favorable
We look at an unusually strong month for consumption that still brought in a positive range of 2% handles on both headline and Core PCE inflation.


Goldilocks is doing a backflip with PCE inflation showing 2% handles in both the headline and core PCE price index while consumer spending remained solid for purposes of framing 2024 economic expectations.
The drop below the 3% line to 2.9% for Core PCE inflation (+2.6% headline YoY) was a mental barrier to cross and follows a favorable PCE price print in this week’s advance 4Q23 GDP release with headline PCE at +1.7% for the quarter (see 4Q23 GDP: Strong Run, Next Question is Stamina).
Personal income growth for Dec 2023 was in line with expectations at 0.3% and ahead of headline PCE inflation of 0.2%, but personal consumption beat expectations and came in even higher at 0.7%.
The debate around whether such good results in spending and inflation should promote caution or inspire confidence on the sustainability of these trends is not getting resolved this month with more color due from next week’s FOMC meeting.
PCE inflation decline outweighs very solid consumption for the market…
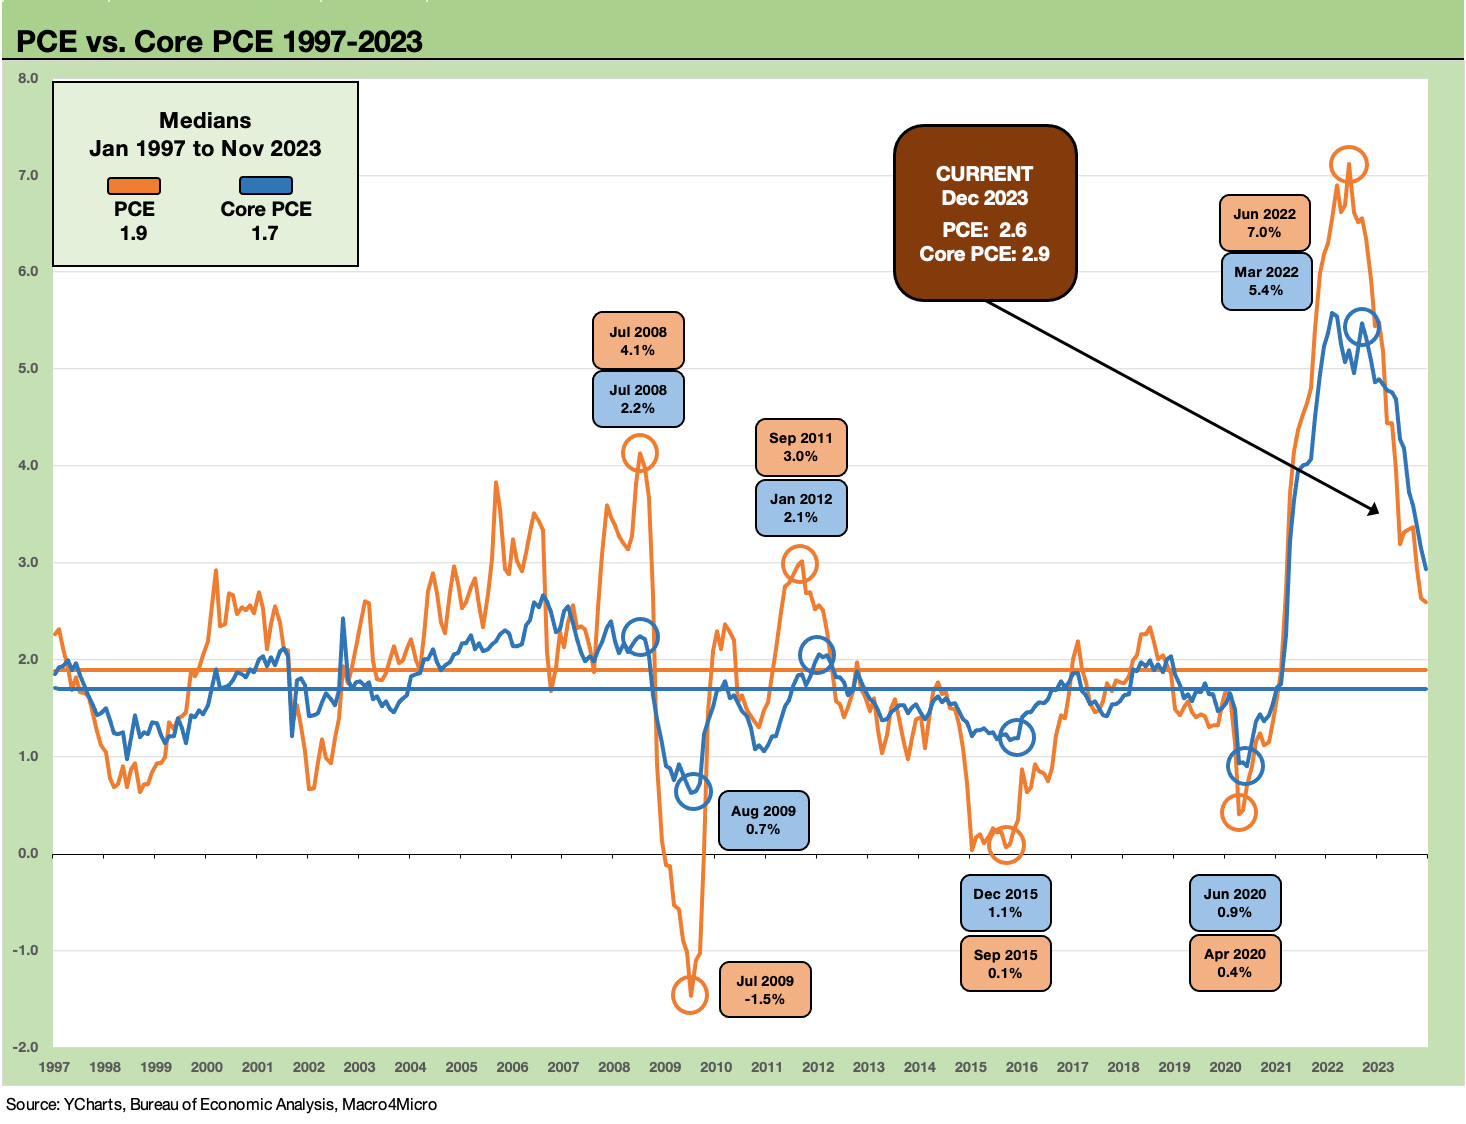
The PCE headline and core trends since 1997 is plotted above. With medians of 1.9% for PCE and 1.7% for Core over those economic cycles and volatile markets, it is not hard to see how the FOMC came up with a 2.0% target.
As we look further below, the longer term timeline medians that include the 1970s and 1980s show medians in the low to mid 2% range. We are closing in on the long-term medians now. The 1997-2023 median levels as targets are still a tough drive to the end zone. The good news is that you get more than 4 downs in this game and years on the game clock.
PCE Consumption was also very solid in Dec 2023 with the PCE line hearkening back to the Sept 2023 numbers that roiled the UST market. The inflation trend line is starting to ease worries on the “good is bad” effect, but as we go to print the UST curve edged slightly higher. The Dec 2023 number for consumption at 0.7% matched the Sept monthly numbers.
The earlier Sept release rattled the UST markets and fueled a steepening into late October as we cover in our weekly Footnotes publication on yields (see Footnotes & Flashbacks: State of Yields 1-21-24). The wrestling match of inflation vs. consumption continues, but the effects on sentiment of seeing 1% handle numbers for headline PCE price index for a rolling 3 months and a 2% YoY handle in Dec 2023 for headline and Core PCE are very reassuring.

The above chart plots the income vs. consumption monthly line since early 2022 just ahead of the end of ZIRP on the way into an inflation spike and aggressive tightening cycle. The consumer sector resilience is a topic already covered at great length.
Now the challenge is framing when is “healthy” PCE “too much” whether for price stability or excessive consumer borrowing that shows up in asset quality blowback.
The fears of the 1970s inflation replay and the history of how the “Fed heads” of the time are depicted in the Hall of Shame are bound to keep some FOMC members promoting caution. That includes more than a few of the Fed talking heads that don’t vote on the FOMC.
CNBC has no trouble lining up guests to say “absolutely time to ease” next to another one saying “way too early.” No one can say that the 2% handle headline PCE for Dec (1% handle for 4Q23) and 2% handle for Core in the face of strong consumption is anything other than good news for now.
The debate of UST auction performance, supply vs. demand for UST (and where that demand should be on the curve) and high deficits and record interest expense bills to fund will be here like the sunrise in 2024, but the inflation battle is going well without so much as a negative month for jobs since inflation spiked and the tightening cycle was in full swing (see Dec 2023 Jobs: Not Feeling the Early Ease 1-5-24).
PCE inflation in long term context…
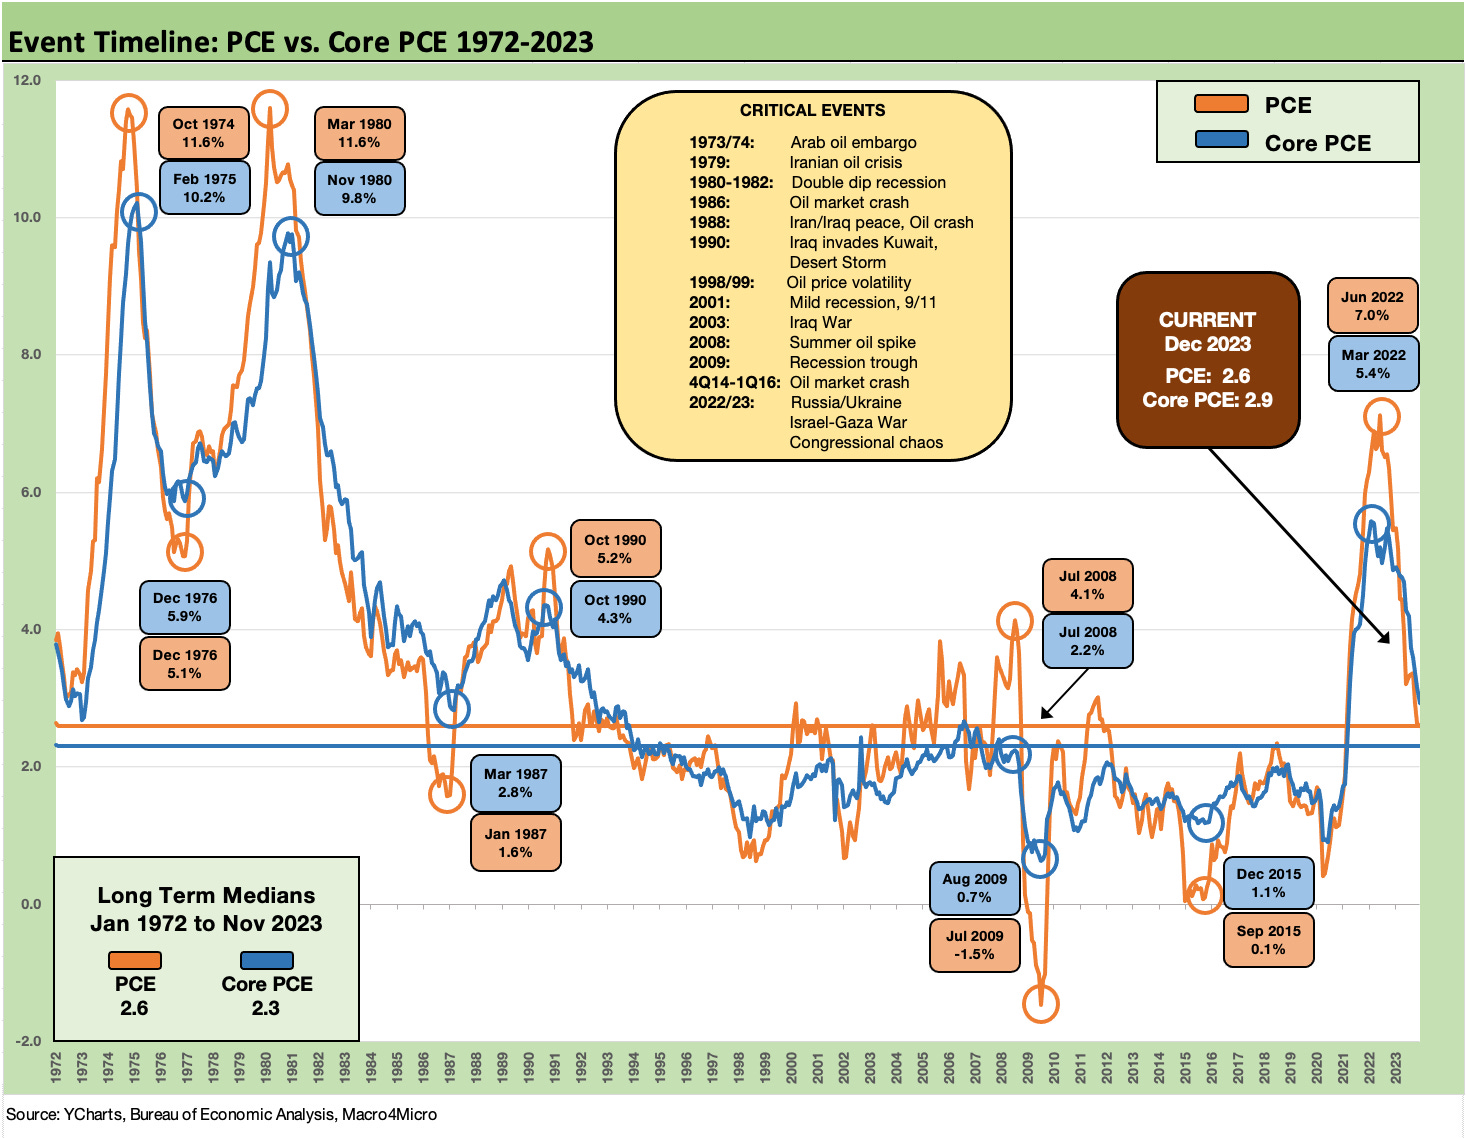
The long-term history of PCE and Core PCE is worth pondering in the context of the next Fed actions since there actually can be a more realistic discussion about the topic of the 2% target. As the chart above shows, the long term PCE line is in the neighborhood of where we are now, but there is more to go on Core PCE.
Overall, this means patience can be supported empirically and especially if there is some sense that wage expectations will moderate, growth will slow, and credit availability will see a modest squeeze at the consumer level continuing as asset quality erodes (but is not plunging) at the household level.
The market always wants relief…
We would highlight that many in the market were screaming for a pause in the fall of 2022 when the real fed funds rate was actually negative – which essentially was still accommodation. Making noise and being loud in demands for easing by the Fed is not new. We have not heard it so regularly in over 40 years. That is except for Trump when he demanded Powell match Germany’s negative rates and threatened to fire him, which he could not do (Although if he gets his way with the Supreme court, he can just shoot him next time).
Donald Regan (Secretary of the Treasury under Reagan and former CEO of Merrill Lynch) and some cabinet members wanted to shoot Volcker (they were not aware of the “S” on his chest…the bullets would have bounced off him). The debate around the role of monetary policy vs. fiscal policy under Reagan during the stagflation years still runs on through today in some quarters. Ideology is as ideology does.
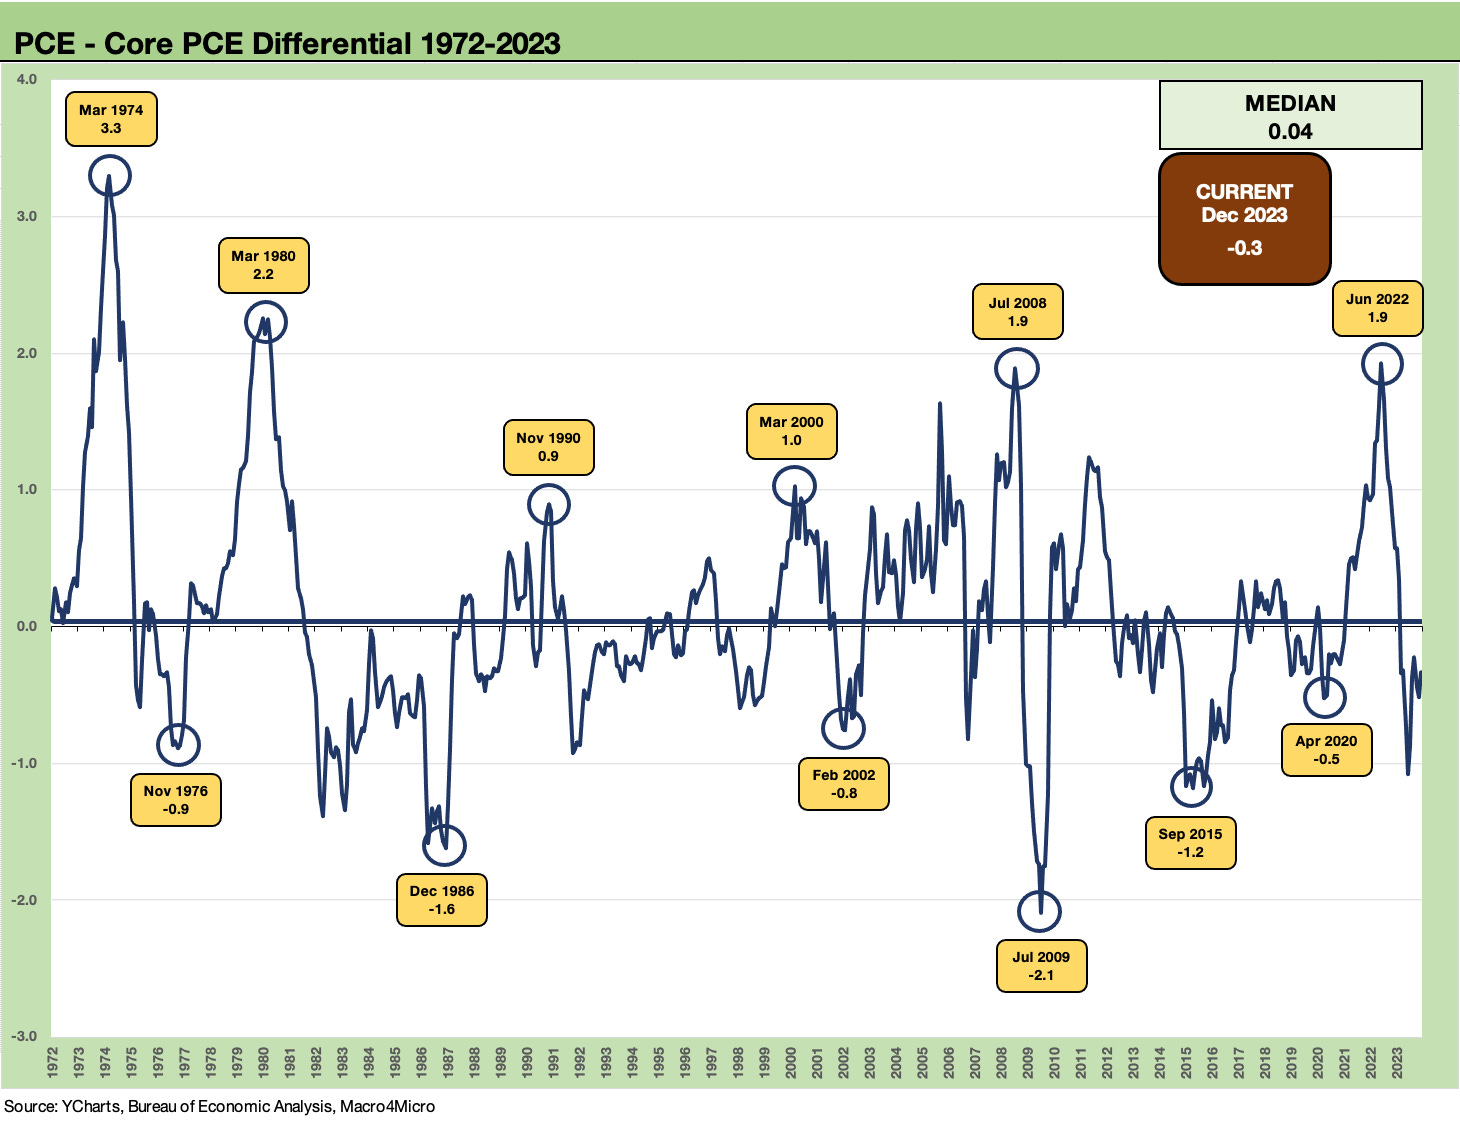
The differences between headline PCE and Core PCE offer a reminder that the topic of oil and gas prices is not something that can be easily predicted as a variable. Sometimes it seems that the relative “headline vs. core” focus toggles on what the real target rate should be seems more about convenience of the moment. Lower oil and gas prices are very important at the household level as well as in the goods and services chain based on input costs or the services expense line.
From home heating to the car/truck engine, energy is a major factor in discretionary household cash flow. Petrochemicals are also heavily wagged by hydrocarbons (notably natural gas in the US), so the negative relationship of headline vs. Core PCE now is significant. Wages and shelter are tougher battles on the sticky factor.
In the “ex-energy and food” definition, only food almost never sees a bout of deflation across past cycles as we reviewed in a recent commentary (see Inflation Timelines: Cyclical Histories, Key CPI Buckets 11-20-23).
The bad news is that food inflation has been a political dagger whether it was Ford or Carter. It has been that long since it might be a swing factor in an election. That said, anyone who has been around for a while (or reads) know the late 1970s and 1980s were very different periods in the economy and with respect to the occupational diversity of employment and with less cyclical services industries now.
The consumption vs. income details…
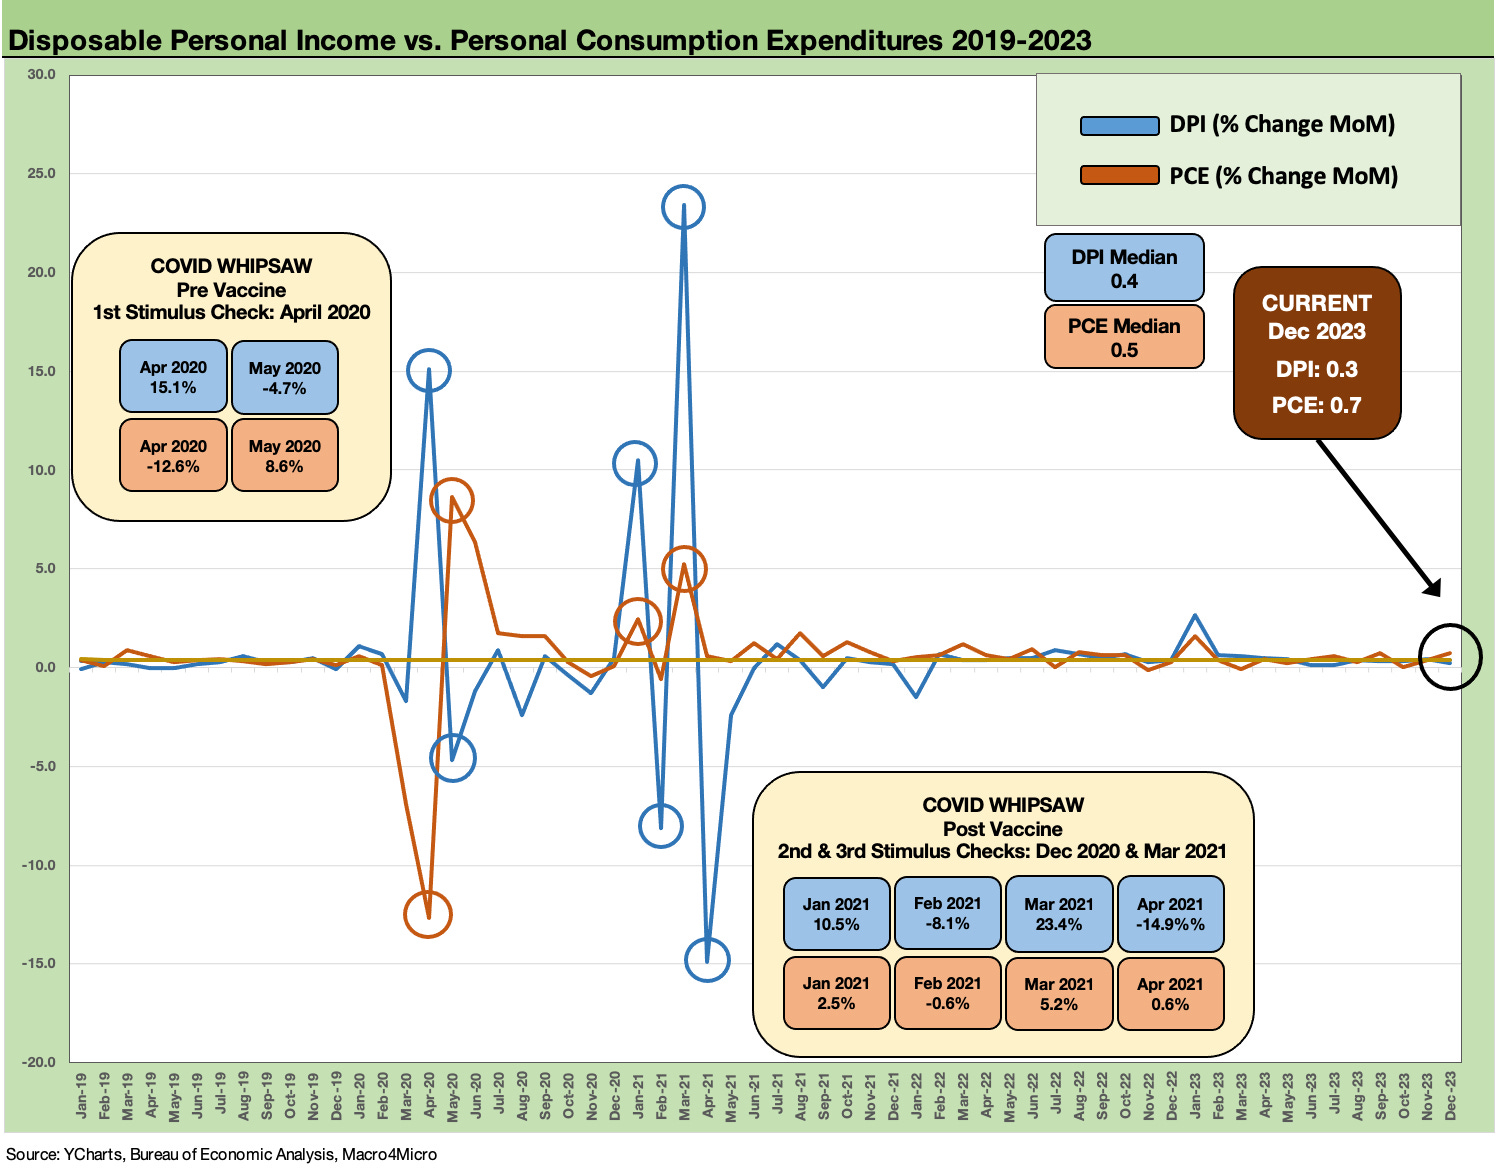
The above chart breaks out the DPI vs. PCE lines since 2019 and then across the wild stretch of COVID and stimulus actions. We look narrowly at those periods in other commentaries, and there were no shortages of unusual distortions from the income and consumption side (see Inflation Rorschach Test: Looking at Relief and Stimulus 2-7-23).
The more recent moves have been smaller in such context, and we look at those in the more granular chart below. The takeaway from this month is that a +0.7% number for monthly consumption is a very strong one in “normal times.”
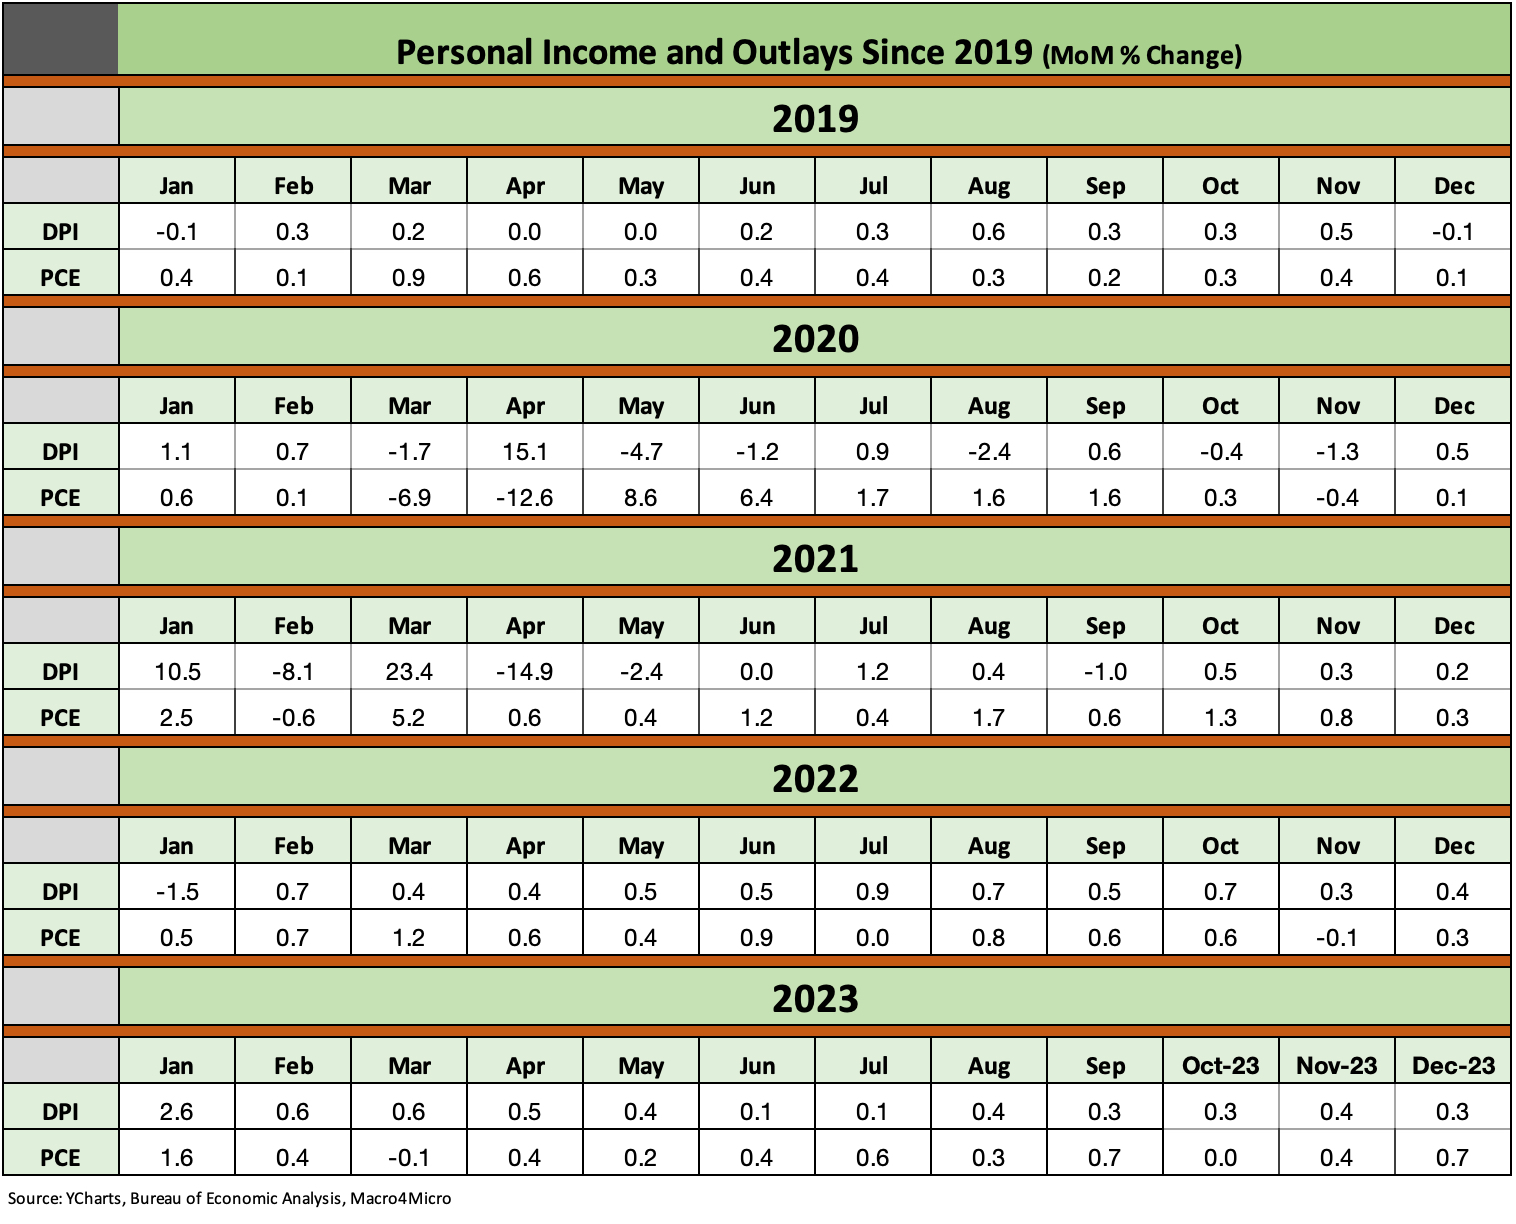
The above chart runs across the monthly run rates for DPI the PCE line. The Dec 2023 number was tied with Sept for second-highest in personal consumption during 2023 with the DPI number below the median. That fits in with the recent Consumer Sentiment story line (see Consumer Sentiment: Multiple Personalities 1-19-24) as consumers keep on spending.
See also:
Dec 2023 CPI: Big 5 and Add-Ons, the Red Zone Challenge 1-11-24
PCE Prices, Income and Consumption: Goals and Assists12-22-23
PCE Prices, Consumption, Savings: Good News is Less News 11-30-23
Inflation Timelines: Cyclical Histories, Key CPI Buckets 11-20-23
Savings Rates: Context Across the Cycles 10-27-23
Inflation Rorschach Test: Looking at Relief and Stimulus 2-7-23