
HY Refi Risks: The Maturity Challenge
We take a top-down look at maturity schedules, credit quality mix, and some dollar price buckets.


We use a few charts to frame the challenge as dollar price discounts and fear of rising interest costs are tied more to coupon repricing than outsized refi risks for the BB tier and quality B tier names.
The term “maturity wall” tends to get overused across the cycles since the base of AUM targeting credit assets can aim a wave at the wall – a wave of demand.
We expect the demand from investors for bonds with current coupons relative to the low coupons on legacy bonds will be high in the new year based on the recent bullish sentiment taking over the market.
A big question will be how quickly some of the issuers will move or whether they will look to play chicken with the risk of a reversal in yield curve sentiment and risk appetites.
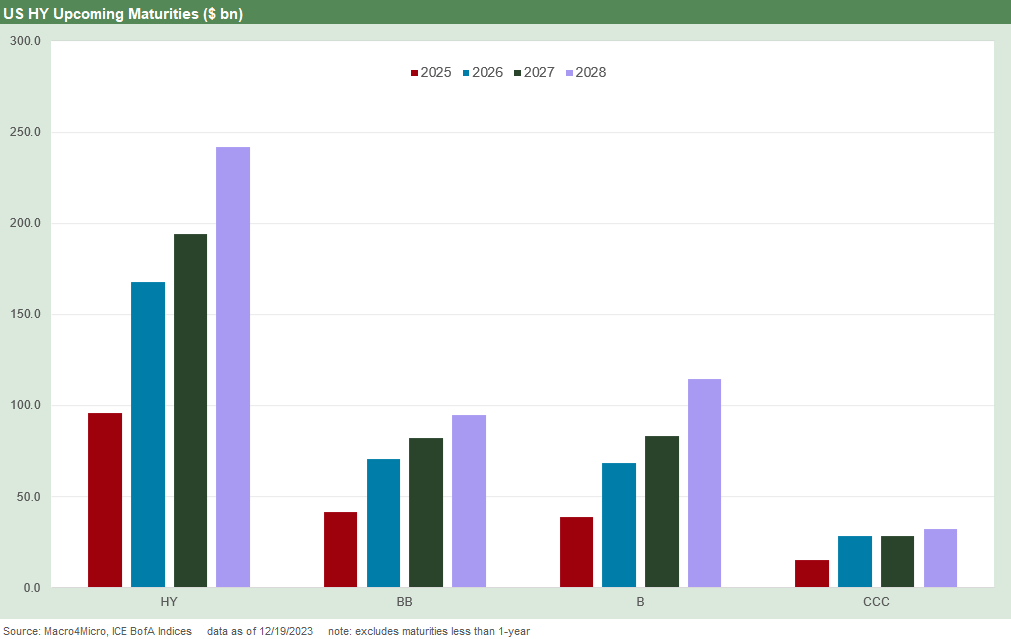
The above chart breaks out HY bond maturities across the years from 2025 to 2028 for a snapshot of bond refinancing needs. In this commentary, we are framing the subset of borrowers who could face massive revision in current coupon rates vs. outstanding average coupons (see Coupon Climb: Phasing into Reality 12-12-23). We see the refi demands across HY stepping up from $96 bn in 2025 to $240 bn in 2028. We do not see that as the structural threat often portrayed. The default cycle forecast in historical context is also relatively mild.
Our main theme is tied to the asset allocation shifts underway in so many portfolios with the newly repriced UST curve levels and shifting dynamics around easing (and fed funds handicapping) for 2024. The balance of risks for now has set off a scramble for credit exposure in the bond markets. The mix of IG vs. HY and the pitchbooks for private debt and direct credit allocations bode well for an orderly cleanup of maturities for higher risk issuers barring a market shock or some “event” on the geopolitical front. With wars in Europe and the Middle East, escalation is always impossible to rule out.
We see HY spreads as very tight, but the all-in yields have been driving the bus in both IG and HY (see HY Multicycle Spreads, Excess Returns, Total Returns 12-5-23). That translates into demand with pension allocations in need of both yield and cash flow for benefit payments at the top of the list.
Whether playing IG for a mix of yield and duration or HY for credit risk (or allocating to both), the demand side of the refi trade is a matter of timing and price and overall not about the lack of access to credit markets (see HY vs. IG Excess and Total Returns: The UST Kicker 12-11-23). IG had a very good run of late on UST and duration winnings, and most of HY has ample room to widen and still present economic borrowing rates.
Better to start striking while the iron (and demand) is hot…
Many HY names are already feeling interest expense pressure in the loan layer, but the time is fast approaching when maturity cleanup will begin for the bond layers. More issuers will see it as prudent to get the refi process underway and start rolling in the interest expense reality.
The recent UST rally and spread compression across the tiers (including CCC) may be the shot in the arm some financial execs needed to get some answers from their street capital market professionals on some refi plans – potentially including loan-to-bond refi if some issuers want to free up some structural subordination for a rainy day. There is a very wide range of HY issuers out there with varied capital structures.
HY issuers and their financial management teams and relationship liability advisory bankers are used to working through refi and extension waves that can get postponed even as refinancing priorities get closer. The current delay in cleaning up maturity schedules is grounded in the material coupon differentials and for most not a matter of an inability to tap markets. That said, the weak credits with uneconomic yields are not a new challenge, and the current weak B and CCC tier is a lower part of the index mix than most past cycles. We look at the mix below.
With a high BB tier mix and tighter spreads overall in the HY market, we consider the imagery of the “maturity wall” as somewhat exaggerated in terms of the threat. The forecast by so many of lower fed funds and lower UST will be the catalyst needed for more action.
Refi early and often is an old rule in HY…
The desire to keep a clean bond maturity where possible and extending out beyond the bank line terms if possible is liability management 101 for HY issuers. That practice can get derailed by steep credit market selloffs or crises and shocks that can pop up from time to time. We saw that in dramatic fashion with the credit crisis, the upstream oil and gas plunge, and the initial COVID paralysis before the Fed and Washington came to the rescue.
The current period is distinctive and contrasts with the usual underlying reasons for the new refi cycle stall. This market comes with a turbocharged tightening cycle and inflation battering not seen since the HY market was in its formative years in the very early 1980s. That aggressive tightening cycle and UST migration higher generated a lot of defensiveness in 2022 for good reason as recession debates played out.
Instead of waiting for perfect timing, HY borrowers have to make a decision around a massive coupon hike with the new curve that will hit their interest expense line. The demand would be there for current cash coupon levels for most. For many companies, that interest expense line is not very material as a % revenues, but there is also a timing issue around when issuers will bite the bullet to take the dilution. For the most leveraged HY issuers, they are already feeling the pain of the floating rate bank lines depending on what type of hedging program they had in place.

The above chart frames the credit ratings tiers for the maturity schedule ahead. We line up the mix in order of quality with CCC tier on the top, the B tier in the middle, and BB tier on the bottom. The reality of the HY mix overall is one of the positive secular attributes now of the HY index as we enter a period with what is shaping up as a constructive view on fundamentals.
The mix of the CCC tier in the near-term maturity schedule is slightly higher than the 13% face value mix in the index while the BB tier is lower than the 47% face value mix in the index. The BB tier has more long dated fallen angels and also more issuers that can tap the HY market at 10Y and beyond.
We cannot tackle this exercise all at once, but the drill at the issuer level is to look at the industry mix, detail the issuer names for each year, then check out the call schedules/prices and how busy the capital structure is in terms of maturity selection.
There are some BB names that are crowded over the intermediate term horizon with few open slots for logical liability management. After so many bank lines were cleaned up, we would assume there is plenty of room for the substantial majority of issuers inside 10 years.
Figuring out who has some price upside on redemption moves is a matter of portfolio maintenance and trying to make the call on which might refi sooner than others (no one said it would not be labor intensive). That is what liability managers and capital markets coverage professionals do, and the solid spreads and bullish UST color from the banks will be keeping them busy.

The above chart frames the mix by broad dollar price bucket. We frame them by par plus (>100) at the top, 90 to 100 dollar price in the middle and below 90 at the bottom. The chart is meant as a snapshot of the dollar price mix.
In contrast to how this exercise would usually be done (i.e. 90 as an indicator of a marginal, risky credit), this price mix is largely about the massive coupon differentials in outstanding bonds vs. the new UST. Many legacy bonds came in the age of ZIRP and notably in the COVID refi boom. Consistent with old school bond math, the discounts increase with a modest move out the curve to 2028 maturities.
For some calming context, the world will not end with a wave of 6% and 7% coupons on refinanced paper with a few years left to maturity. For some frames of reference looking back to the pre-crisis years, we can start with the year 2000 as HY was heading into the TMT implode-a-thon and multiyear default cycle and before Greenspan went wild on easing in 2001 (see Greenspan’s Last Hurrah: His Wild Finish Before the Crisis 10-30-22).
The first half of 2000 came as the NASDAQ was peaking, inflation was ticking higher, and the Fed was tightening. At that time the HY market had 9.6% coupons. For the BB tier, the weighted average coupon was 8.4% and CCC tier was 10.9%. In other words, the boom years of HY saw coupons materially higher than what we would see today in a refi wave.
The UST was at higher levels as well in those earlier cycles. If anything, higher coupons can also draw higher asset allocations and notably for credit tiers and issuers that have low default risk. For example, the BB tier has minimal long term average default rates below 1%. The B tier is facing minimal forward default rates as well in this market relative to history.
Rolling ahead to the bear flattening and boom in HY demand that followed the 2001-2002 default wave, the HY index posted a weighted average coupon of 8.6% in 1H03 (more than 20 years ago) and that was just ahead of one of the biggest credit rallies of all time from 1H03 to 1H07. The BB tier coupon was over 8% (8.1%) in 1H03 and the CCC tier was 8.4% after waves of downgrades and HY and CCC tier index exits on default on the way out of the TMT bubble default cycle. The BB tier was down to 7.5% by 2005 and the CCC tier was still hanging around 8.4% for coupons. (Note: we are citing ICE Index histories).
The bottom line on these three top-down charts is that taking low coupon HY bonds with a substantial majority of coupons below 5% to bonds at par with higher coupons will not bring the world crashing down in a market where the UST is also below those seen in 2005 and 2006 and spreads are tight. A few quarters could end up being a long time with shifts in forecasts and sentiment ahead, so some big timing decisions are in the pipeline for borrowers and liability managers.
If the forecasts being embraced by so many come to pass (lower Fed funds, UST shift lower, and solid fundamentals in a soft landing at worst), the HY refi effort could be in play in a major way and the liability cleanup could start up again in earnest. In that scenario, bond coupons go higher but interest on floating rate liabilities goes lower.
We are still mixed on the forecast for the UST being embraced given the solid fundamentals we keep seeing in recent releases. We still see the need to fund an intergalactic budget deficit and find the right market clearing level for UST beyond 5Y UST if that “no landing” or “soft landing” plays out. Those have been topics in other publications.
As we covered in asset returns this past week in our Footnotes publication, the Pleasantville plot in the movie did not work out as planned with everything staying perfect (see Footnotes & Flashbacks: Asset Returns 12-16-23).
Contributors
Glenn Reynolds, CFA glenn@macro4micro.com
Kevin Chun, CFA kevin@macro4micro.com