Silicon Valley Bank: How did the UST Curve React?
The UST curve offered up a material reaction to the SVB news as layers of potential scenarios get assessed.
“George, a guy named Thiel called me about you…”
We take a look at how the UST reacted to the Silicon Valley Bank (SVB) events as inflation debates and the nuance of Fed policy choices dropped to a distant second as the risk symmetry gets sorted out this weekend and in coming days. Time is short.
Handicapping outcomes for SVB’s uninsured depositors offer a set of risk factors that punches well above the weight class of just SVB depositor exposure with so many banks sitting on similar losses on the asset side from the UST curve shift and thus vulnerable to second guessing.
The ability of the regulators and bankers to move quickly to minimize losses for uninsured depositors is a crucial test in stabilizing a market where confidence is justifiably shaken.
A buyer of the entire bank or major asset sale deals (as in right away) would go a long way in mitigating the threat of risk aversion taking broader hold in the bank funding markets.
The rapid collapse of Silicon Valley Bank (SVB) has turned the market’s priority list on its head for now (we would guess even the Fed’s as well). The largest bank collapse since WAMU and the second largest in history has left the market shaken. The shock is heightened by the focus on the venture capital and tech-centric financial ecosystem that has made the US the envy of the world since the 1990s – as volatile a ride as related assets may have been across the cycles.
Over the last two trading days, the news flow has wrestled with how to explain the speed of the SVB collapse. It dominated the news on Saturday as well. It’s a Wonderful Life beat Mary Poppins for the most-cited examples to explain a run on the bank to audiences. The run on the bank is the easy way to explain how the fuse was lit. The tricky part from here is explaining how many paths the events could take when so many companies have seen their liquidity sources sent into limbo.
The Bailey Building & Loan parallel from “Wonderful Life” is the better example of what happened for a few reasons. For one, it folds in the asset liability mismatch better and has parallels to the 1980s. With S&Ls in the 1980s thrift crisis, savers ran to higher yield money market funds and saw a flight of capital from thrifts to far more attractive cash alternatives. The struggles with asset-liability mismatches and the perils of “hot money” also ties into the regional housing market stress and notably in the oil patch of the late 1980s. The long-dated UST holdings of SVB could just as easily have been the houses of Bedford Falls (renamed Pottersville in the alternate history).
To beat the metaphor senseless, the market awaits next week to find out if Jay Powell will play Clarence and get his wings (dove, not hawk) with a “pause” in tightening to sort this out. In theory, FOMC actions should be heavily influenced by the potential knock-on effects of SVB even if the Fed and UST will not admit it with their outside voices (they need to sustain a confident front).
The bank system broadly has a massive base of underwater UST securities, and while SVB had very distinctive depositor profiles, the concept of regionals as exposed to confidence problems cannot be ignored. As another lookback exercise, the Fed easing in fall 1998 after Russia and LTCM offers some hope. They got back to tightening shortly after that worked out.
We will write some of the issues up in shifts, but the dominant questions will include:
Will the Fed and FDIC give more color to reassure not only the uninsured depositors but also investors and depositors in other banks that lack the low cost and habitual cheap depositors of the largest banks?: The Fed will always describe the banks as resilient and voice confidence, but how can they do otherwise? The FOMC is well aware of the effects of risk aversion and how that leads to credit contraction. On the other hand, we think back to the FOMC meeting of August 2008, when two vocal members said inflation was the biggest threat and systemic risk had been eliminated (tough market timing on having that documented in a transcript only weeks before Lehman and AIG.).
Will SVB Financial head for Chapter 11 soon at the holding company?: The bonds were down around 40 points with a flat dollar price curve (per ICE) on Friday. That Chapter 11 would be one more highlight for a regional bank round of risk aversion, and the same for smaller banks. How can a bank analyst who eats, sleeps and drinks bank earnings models and NII estimates make a call on depositor panic? The flashback to Texas banks in the late 1980s is in the memory collection (Lehman was slammed on MCorp auction rate preferred after it wanted to defend the auction as the “inventor” of the world’s worst money market product). We also recall some thrift holding company moments (I remember one where the bonds dropped from 90 handles to 6 in a few days. Bad days the office for those owners.)
Can the regulators and deal bankers move fast enough to keep a downward credit spiral from hitting the customer/borrower/depositor group?: Between the base of deposits ($173 bn at year end) that are overwhelmingly uninsured and the $59 bn in unfunded credit commitments listed in the 10K at the end of 2022, there is a stunningly large liquidity base at risk that will have multiplier effects along the services, tech, and supplier chains (Tier 1, 2, and 3). The commercial real estate space will also take a beating with tenant risk soaring and setting off vicious cycles that reverberate to other lines in many banks and securitized structures. Disorderly asset sales will not be like the SIV scenarios of 2007-2008, but it would not do wonders for the pricing of private credit assets.
The clock is ticking on loan counterparties whose cash is not available: The start-up and early-stage operators usually have to keep all their cash at the lender. So the longer the borrowers can’t get their cash, the more likely they are to default. Brain drains will not help if personnel check out to get a paycheck. That means the entity (SVB) liable to them for the deposit is also going to see the credit quality of their asset erode as well at a time when they are looking for buyers. That is a cruel irony for both sides of the deal. Speed and execution will be priority #1. Regulators need to rise to the occasion on this one. The interesting fact is that the aggregate credit metrics of SVB look pretty good in the 10-K. That of course has a very short time limit when they have their cash held hostage.
We will keep looking at some of these layers, but the ability to move fast with so many diverse asset line items and so many of them “two sided” (lender and customer in the same party), the complexity of pricing so many assets (notably loans) on a short game clock is a tense one for many companies and employees, landlords, etc.
How the UST curve played out on the week ahead of the CPI release…
Below, we zero in on the UST market’s reflection of “what happened.” The disclosure of the asset mix in the 10K is a useful place to look since the disclosure is very good and depositors can get a sense of how diverse and deep the asset pool is for SVB. That will be part of our next swing at this topic. Depositors should be confident they will get a lot more back than their minimum insured levels, but like any bank line items, there are always a lot of assets that are “closet impaired” relative to book value in the loan portfolio. The Held to Maturity portfolio is a separate can of worms as well.
UST curve rallies, but the 3M UST awaits CPI numbers and the FOMC…
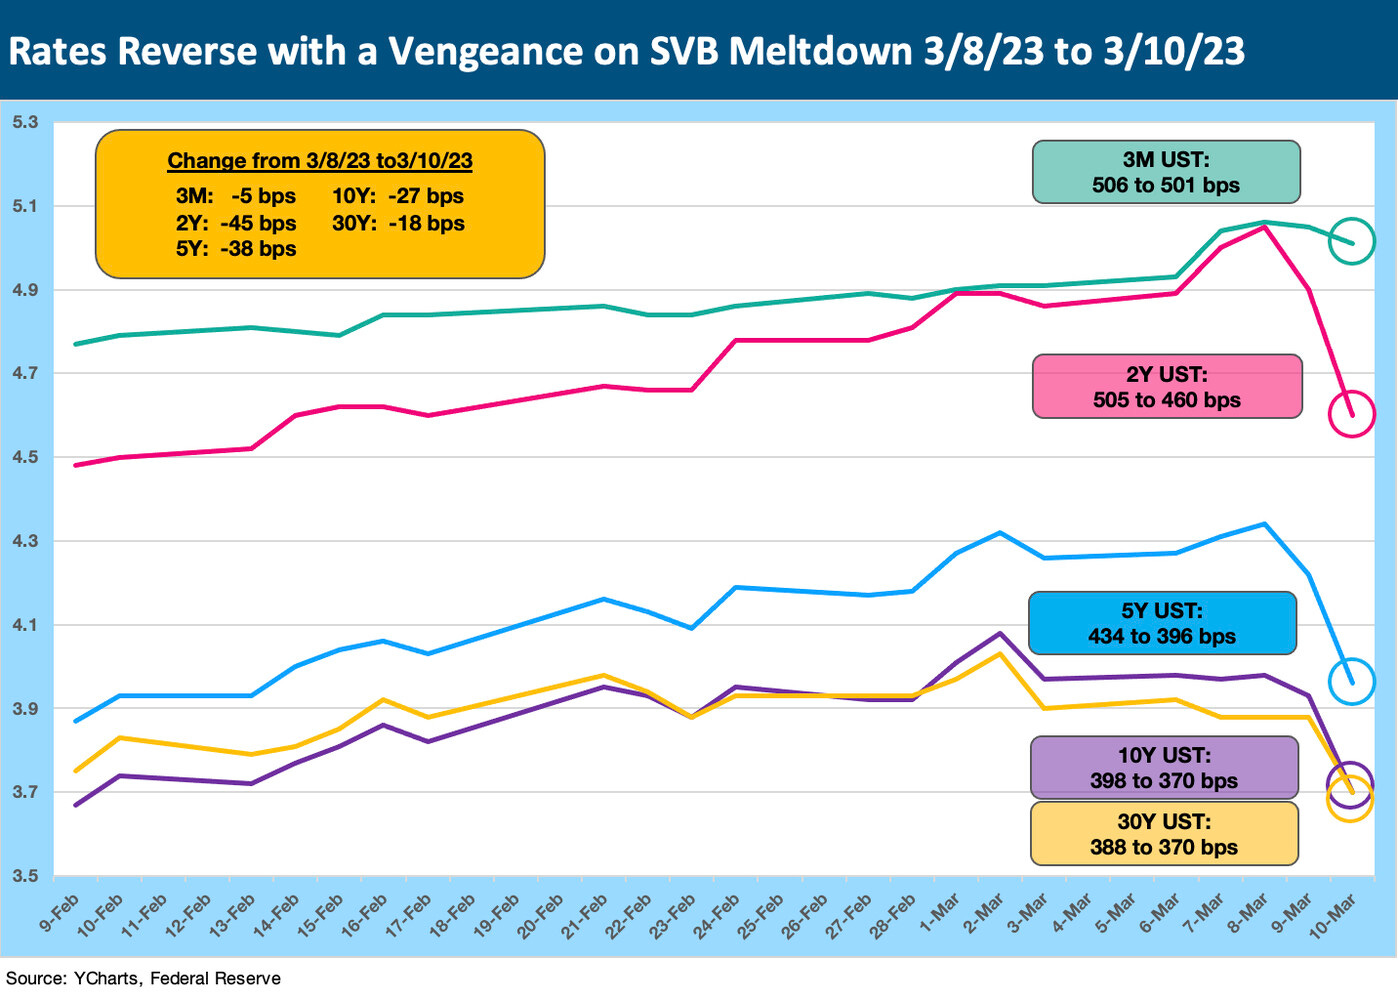
The trend line for the UST curve offers an indicator on how confused and nervous investors will (and should) remain as the next week plays out. Rates were clearly heading higher last week until SVB.
The above chart underscores how materially the market move in UST unfolded to end the week after the SVB headlines cranked up on Thursday (3-9-23) and SVB hit the wall on Friday (3-10-23). The box in the chart details the moves in the UST from Wednesday (3-8-23) through Friday close. The brief 1-month time series offers some details on the day-to-day moves across the yield curve for the past week to offer up some raw numbers on the moves (source: Fed-supplied data from YCharts).
The above table gives a little more granularity to the movement of the yield curve across more maturities. We roll in the Fridays plus the last five trading days.
The devil and angel on the shoulder for Chairman Powell will be fighting inflation vs. reassuring the markets (corporate cash deposits and high net worth managers of liquidity and deposits) that they do not have to start reassessing all their deposit levels by bank and pull out billions into short UST.
Of course, then liquidity managers need to ponder the debt ceiling course of action ahead and what that means for UST safety. Gauging the intent of the strong-but-demanding contingent of hardliners on the economics policy short bus is more worrisome than not. There are literally some in the House who actually want a default to establish their brand. (The political cults of the right and left picked a bad year to stop sniffing glue).
The backdrop near term could go quite well with the right moves and good execution (notably by regulators in quickly finding buyers and freeing up cash for depositors). The outcome could also go terribly wrong and send markets, investors, lenders, counterparties, and trade creditors (e.g., LOC risk just rose) in the direction of credit contraction, decision inaction, and investment distraction.
The idea that regional banks with major unrealized losses could be seen as a “no fly zone” could have material effects on the broader economy (credit contraction) as well as bank system risks (the interconnectedness problem). Framing counterparty exposure at the single name level (vs. more generic net categories) has the transparency of a brick. That sets the stage for some hedges turning into credit risk rather than serving as portfolio risk management (notably in OTC swaps).
One worry will be how the political class will weigh in on the mess given an election on the horizon. Both sides will start reinventing history around the TMT crisis and credit crisis of 2008 (or in some cases get briefed on it for the first time on an index card or text message). It will not be too much of a leap to assume hardliners on both sides will weigh in and see it as a “Big Tech” thing and go to talking points (who knows what Bobo, Maj, and the Gaetz of Hell will say with their newfound powers). Meanwhile, many will be wincing about what will come out of the mouths of Senators Sanders and Warren et al on their likely desire to triple down on regulation and redistribution while driving credit contraction and slowing investment.
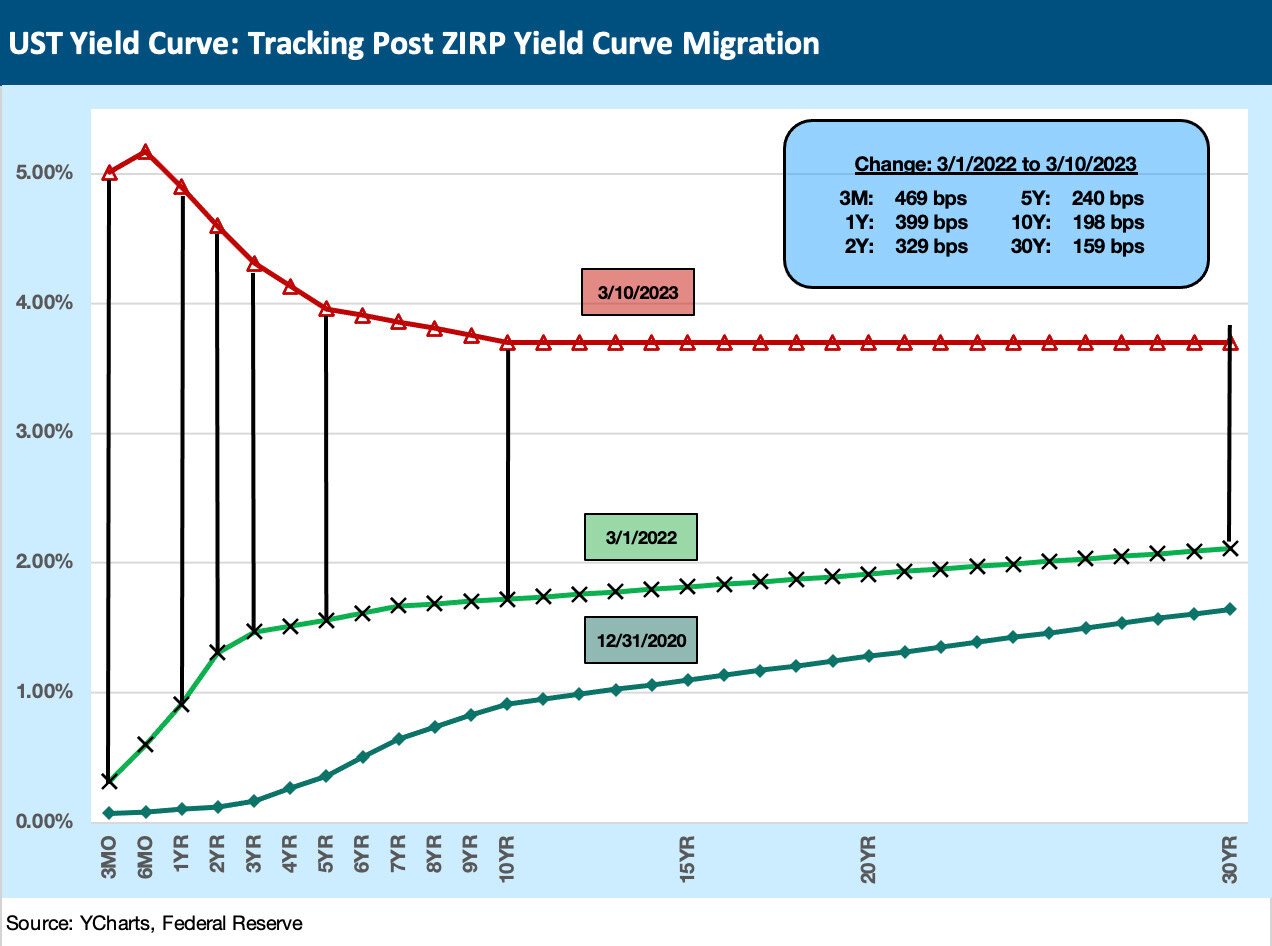
The above chart is just our weekly reminder of the bear flattener/inversion pain since the end of ZIRP that we include in each weekly (see Footnotes and Flashbacks: Week Ending March 3, 2023). The upward shift from the beginning of March 2022 (the month ZIRP ended) saw all the UST differentials in the chart narrow from the prior Friday with the exception of the 3M UST, which is still somewhat more wrapped around fed funds. As covered in the prior chart, the 3M peaked on Wednesday and then notched down slightly on Friday.
The dramatic upward shift (with an inversion kicker) in the chart above is the flipside of how much unrealized loss pain SVB had parked in its AFS (Available for Sale) portfolio as it pondered means of boosting liquidity, raising equity, and reinvesting in higher yielding current securities. That obviously did not go as planned as realized losses and equity issuance sent depositors into Mach 1 flight.
Who knew cash could be so risky with such a massive bank?
An investment grade bank with assets north of $200 bn and pretty solid asset quality metrics was not expected to see a Herbert Hoover moment. That said, the dramatically unexpected happening is not new ground in financial markets. AIG was the largest and most profitable insurance company in the world with legions of PhDs roaming the halls with expertise in a wide swath of risk management products. Then again, 100 or so wannabe rainmakers in NYC area were somehow greenlighted to take on de facto risks that were almost unlimited. The fact that the Western European and US bank/securities markets were hanging by an AIG thread in one business line was only learned later.
If the new yardstick for bank safety is loss exposure in Available for Sale holdings or Held-to-Maturity Holdings, the demand for short term UST products is going to go up quickly. After all, the financial media has made the unrealized losses out of the UST curve spike a recurring theme with this SVB headliner. Rumors are now working their way into the markets that the rating agencies were looking at potential downgrades and that prompted some of the decision-making exercises that blew up in SVBs face. That is secondhand media accounts, so we assume the agencies will be out with details more publicly on how they are now viewing deposit flight risk and these mark- to-market contingent risks.
The above chart updates our 3M to 5Y UST slope history (see UST Slope Update: Some New Inversion Highs 12-8-22, The Cash Question: 3M-5Y Yield and Slope 10-19-22). The inversion had hit a post-1983 high in January 2023 as cash took on the flavor of a viable asset allocation strategy as the tectonic plates were moving around in inflation and monetary policy. That is still the case but “cash” after SVB might be more geared to only the biggest and best banks and short UST.
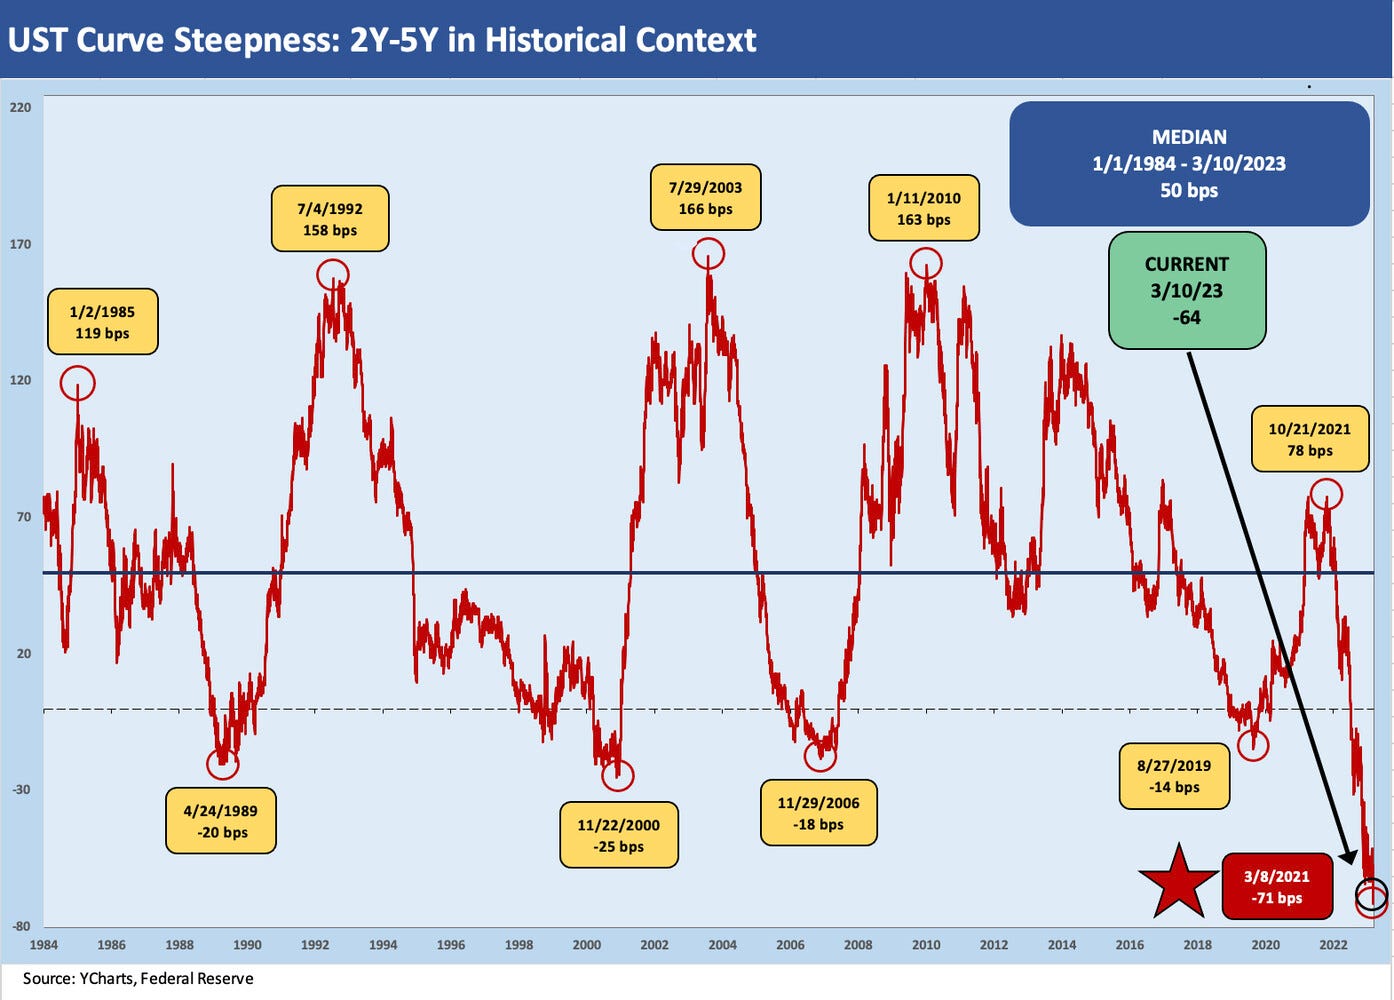
The above chart shows the history of the 2Y to 5Y slope with the inversion hitting a record high this past week at -71 bps before wrapping the week at -64 bps. As we have covered in other commentaries, these slopes we detail start after the most extreme of Volcker policies in the 1980-1982 double dip, when the market saw both record inversions and record steepness. The inflation history of the 1970s and early 1980s was not seen again until the latest inflationary wave. The 2Y to 5Y slope may scream recession to many, but the duration of the period for that recession to get here does not have a preset game clock. If SVB is not resolved in favor of depositors, then that recession timeline likely got a lot shorter.
The events of the past week were looking like the Fed was heading to more pressure to add a 50 bps hike rather than a 25 bps move. The world just changed with SVB, however, and the events around SVB could lead to quite a bit of scenario reworking if investors start smelling credit contraction, bigger problems in the tech world, and cascading effects in the area of tenant credit risk in commercial real estate among many other of the practical multiplier effects from SVB.
If I am a regional bank right now, I am giving serious thought to pushing my deposit rates higher and doing a lot of PR commentary on how healthy I am in asset quality. I don’t announce the need for a sale of equity and a desire to realize massive material losses as part of it (i.e. don’t do what SVB just did). Presumably, the Fed looks to take some action to shore up liquidity backstops and jawbone support to mitigate outflow risk.


