
Footnotes & Flashbacks: Asset Returns 5-19-24
Good times for running asset returns with record highs in equities not reconciling with the political noise on the economy.


“You handle domestic. I will handle international."
The markets post another good week for asset returns with the trailing returns for our high-level major benchmarks all positive over trailing 1-month, 3-months, and 6-months with the 1-month for major equity benchmarks especially impressive from 5% to 7% handles.
The all-positive returns for 1-month come only 3 weeks after all the asset groups in our major benchmark table were negative in both fixed income classes and in the major equity benchmarks.
The group of 31 benchmarks and ETFs we track weighed in at 26-5 for 1 week, 30-1 for 1 month, 29-2 for 3 months, and 29-2 for the trailing 1 year. That seems to qualify as a good performance trend.
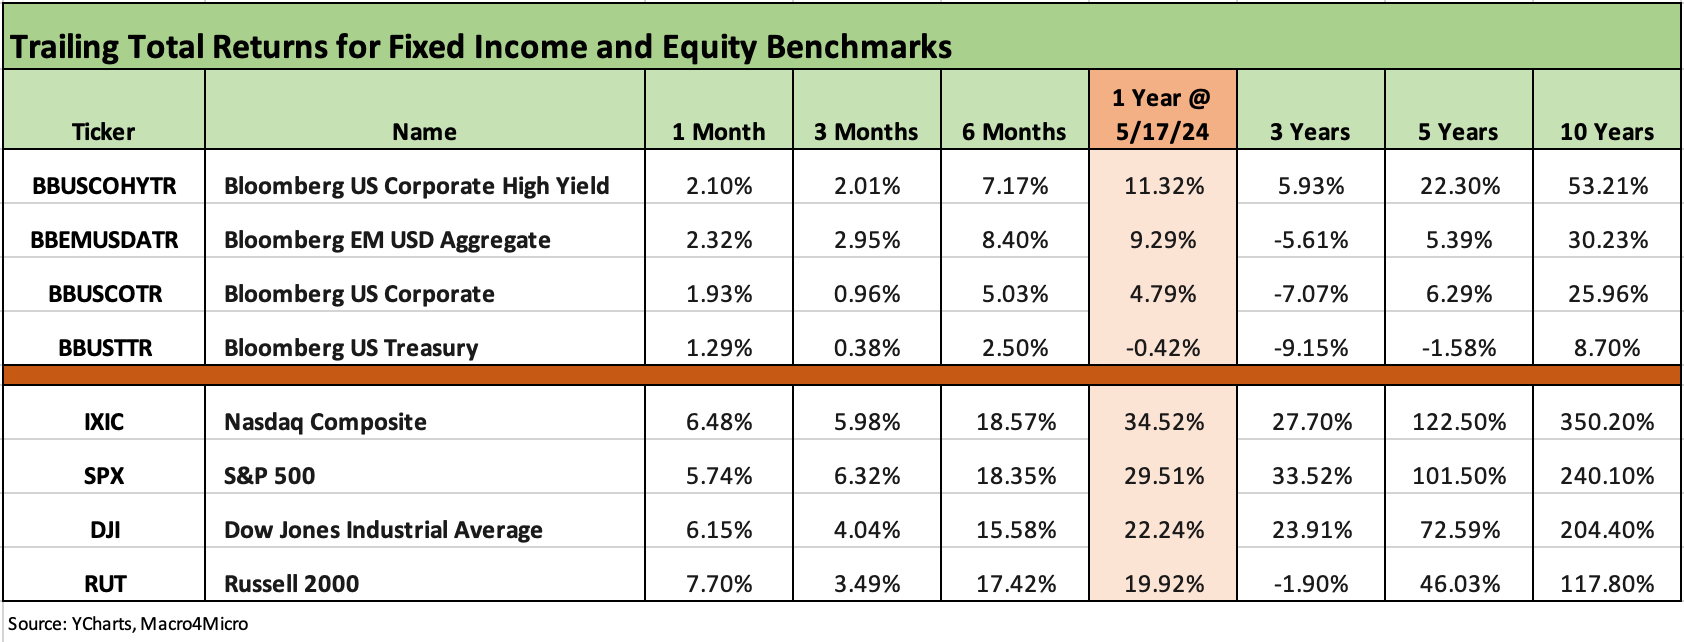
The above chart updates our high-level asset class performance for the main benchmarks we track each week in the debt and equity asset classes. The 1-month column in the above chart highlights the favorable trends of late with all the debt and equity classes in positive range for the month ending 5-17-25. Those same lines were all negative as recently as our publication covering returns through 4-26-24 and only one barely positive (HY bonds) for 1-month returns through 5-3-24.
The equity benchmark returns highlight how stock valuations are plugged into the UST curve and inflation action. In IG credit, spreads were already extremely tight, so the direction of performance there is more married to bond math than shifting IG spreads.
For US HY, spreads are 30 bps tighter YTD, and HY has taken less of a beating from the UST curve action as we detailed in our separate Footnotes publication on yields (see Footnotes & Flashbacks: State of Yields 5-19-24). We still see a minimal negative return for the 1-year UST in what has been an unrewarding stretch for duration with the notable exception of the big Nov-Dec 2023 rally.
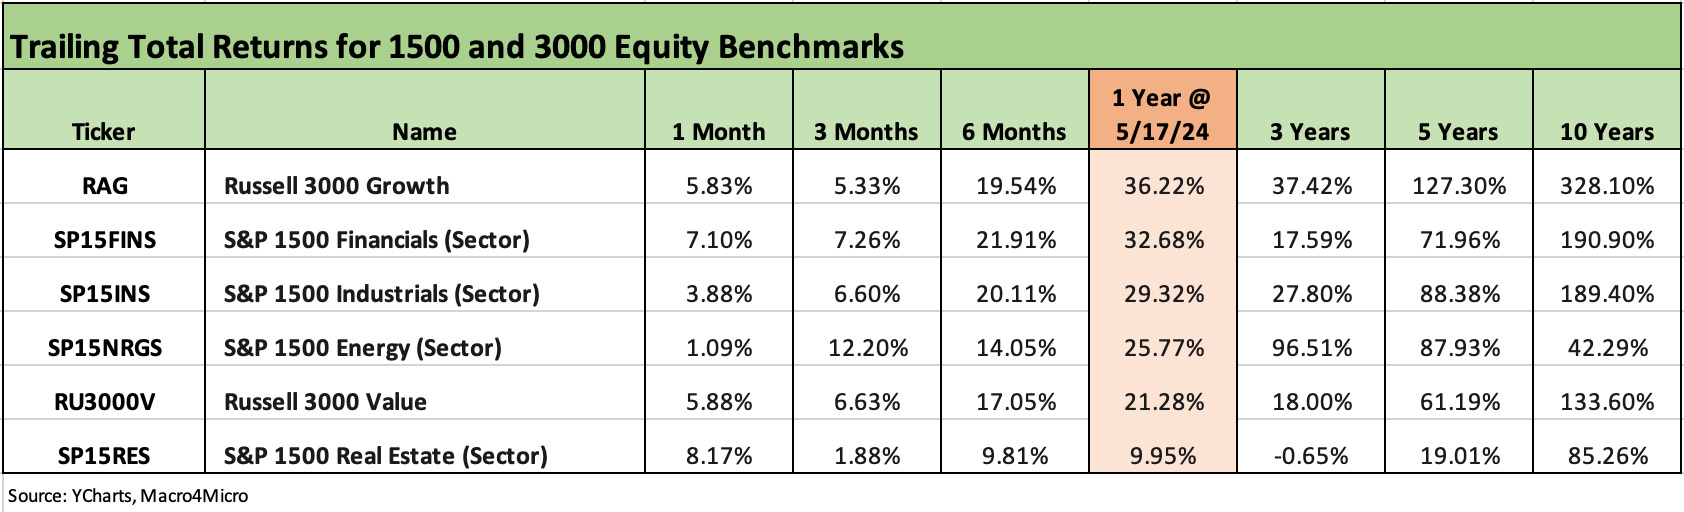
The 1500 and 3000 series also gets the performance history back into the all-positive zone with only the recent struggle of the ever-volatile energy sector barely in the black. Even the Energy numbers are impressive over 3 and 6 months.
The rolling return visual
In the next section we get into the details of the 31 ETFs and benchmarks for trailing periods. Below we offer a condensed 4-chart view for an easy visual before we break out each time period in the commentary further below. This is a useful exercise we do each week looking for signals across industry groups and asset classes.
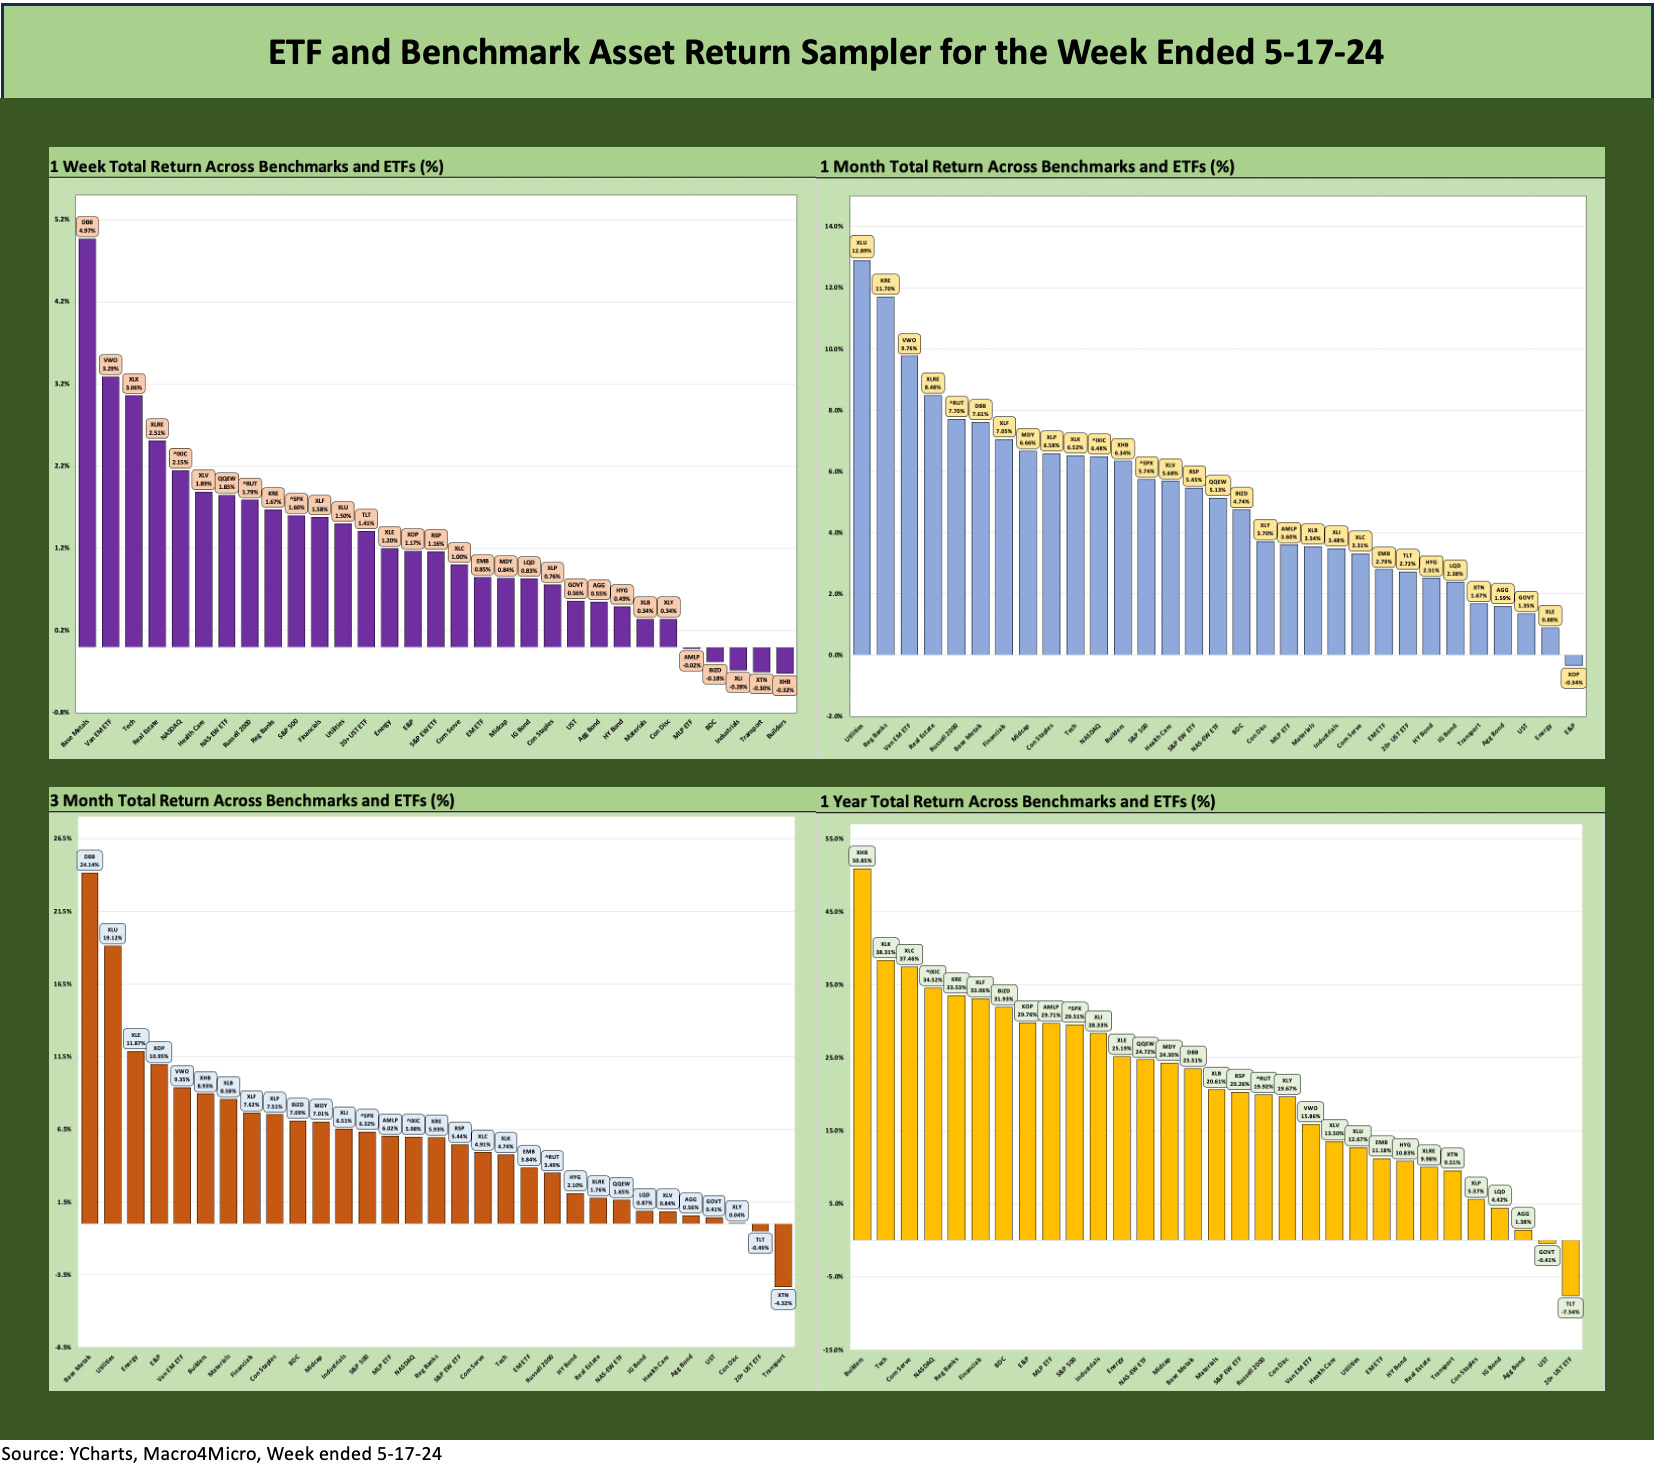
The above chart offers visuals on the return mix with positive returns dwarfing a small group of “short” negative return bars across diverse sectors and time horizons. It is tough to complain about the pattern even if more success on inflation would make more of the bars taller.
The old rule of thumb around “up and to the right” for the equity class returns into the future is working in 2024, but the potential for the UST curve or some shock to spoil the party never goes away in an election year like this. We have Taiwan and Ukraine lurking, and Iran always a wildcard around the oil-based inflation threat.
That rule of thumb of “up and to the right” was amputated back in 2000 to 2009, so the handicapping of shock risk will always be a matter of mood. Of course, the 2000 to 2009 period included the effects of TMT excess to start the timeline and the structured credit and mortgage implosion to end it. Those were exploding bookends and left some benchmarks negative over the decade.
The Magnificent 7 heavy ETFs…
Some of the benchmarks and industry ETFs we include have issuer concentration elements that leave them wagged by a few names. When looking across some of the bellwether industry and subsector ETFs in the rankings, it is good to keep in mind which narrow ETFs (vs. broad market benchmarks) get wagged more by the “Magnificent 7” including Consumer Discretionary (XLY) with Amazon and Tesla, Tech (XLK) with Microsoft, Apple, and NVIDIA, and Communications Services (XLC) with Alphabet and Meta.
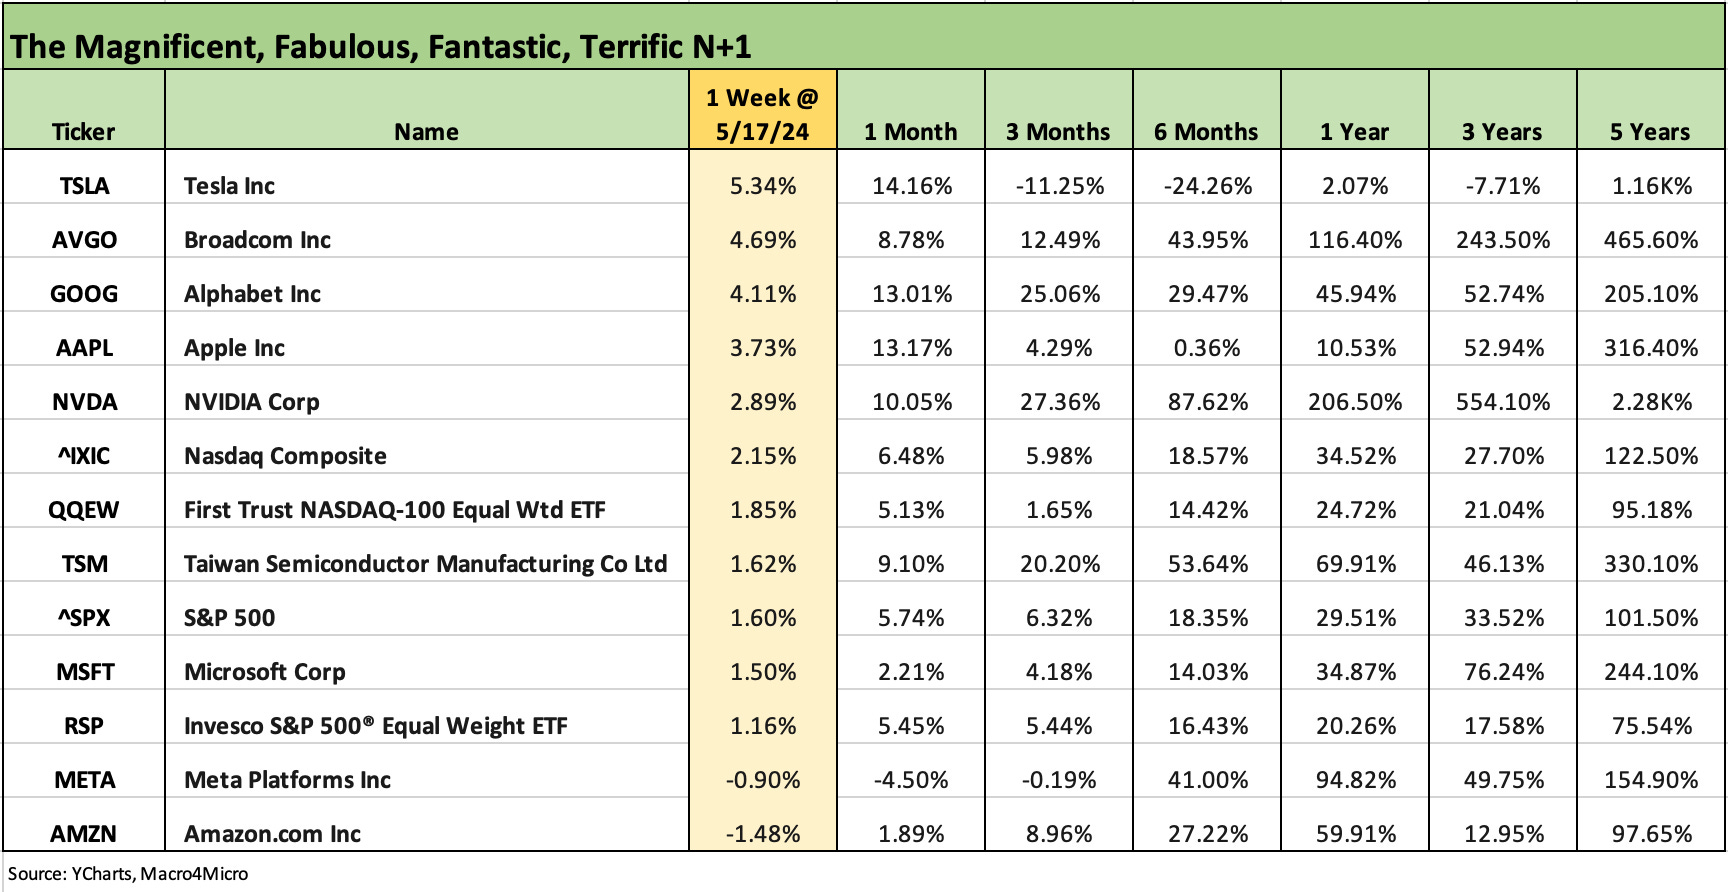
We recently added the above chart to the weekly so we can track the headline mega-names and see which might have wagged certain ETFs or the broader capitalization weighted benchmarks. We line up some of the major large cap Tech-centric names in descending order of total returns for the most recent week.
We include the S&P 500 and NASDAQ along with the equal weighted NASDAQ 100 Equal Weighted ETF (QQEW) and the S&P 500 Equal Weighted ETF (RSP). A table of the big tech names from the Mag 7 to the broader collection of “headline types” streamline the weekly review if one of the big ETF names is impacting performances.
We see the often-volatile Tesla putting together a winning stretch the past week and month after being taken to the woodshed over 3 and 6 months. The top down EV story seems to be getting worse by the day. For those who like reading auto trade rags (I never did take up golf), the coverage of EV has not been pretty of late. Meanwhile, Trump may hate EVs even more than the ACA in health care even if only because they both have Obama and Biden in common.
That EV policy threat will up the ante on economic risk in EV investment on the production side or for the EV buyer (consumers or fleets). As blared across the news wires, Trump has asked for $1 billion from the oil industry and is targeting EVs (his words). That will not help forecasts and demand or trade-in values for pricey cars that are in the crosshairs.
Away from the noisemakers, the EV story line is seeing the problem of high costs, weaker demand, and the fact that the buzz is going out of the sector (maybe they should call them AI EVs?). The worst publicity is the demand weakness, price cuts, margin pressure, and steep cash bleeding in the buildout stages. We also have the story from Hertz and their painful losses on EV residual values and that is not going to inspire potential fleet buyers. The challenge for Hertz in the liquidation of only 30,000 EVs (in their case Tesla EVs) without massive write-downs is going to give pause to many (see Credit Crib Note: Hertz 5-14-24).

The 1-week time horizon returns for the group of 31 weighed in at 26-5 positive with the Base Metals ETF (DBB) continuing a strong run that has pushed it to #1 over the trailing 3-months. Any good news from China is usually enough to wag that mix of base metals, but the speculative commentary around base metals (notably copper) has been catching a lot of recent headlines. The fact that EM equities (VWO) is second (a distant second) over 3 months is not a coincidence with VWO also at #5 over 3 months. VWO is heavy on China exposure through the combined totals of China and Taiwan.
We see Tech (XLK) back in the top 5 with real estate having a good week on the UST curve. NASDAQ rounds out the top 5 and the NASDAQ equal weighted ETF (QQEW) is at #7 in the top quartile.
We already discussed the relatively favorable performance of the bond ETFs in our separate “Footnotes” publication on yields. All were positive with 4 of 6 bond ETFs in the third quartile and one in the second quartile. That is rare in a positive equity week. Only HY (HYG) was just across the line in the bottom quartile on minimal spread tightening and limited duration rewards for HY on the curve moves as covered in the yield footnotes publication.
We see the Builders (XHB) on the bottom taking a rare week off from its steady performance, but XHB is still a top quartile line for the rolling 3 months and #1 for the trailing year. Cyclical signals may have stalled Industrials (XLI) this week on Industrial Production mediocrity (see Industrial Production April 2024: Another Softer Spot 5-16-24).
Midstream (AMLP) and the BDC ETF (BIZD) were in the bottom quartile for 1 week, but have been steady over the trailing 3 months on the high income payouts with some BDCs getting tagged with earnings disappointments. The BIZD has been a top quartile performer over the 1-year time horizon, a second quartile performer over 3 months, and on the higher end of the third quartile over 1 month. AMLP has been similar to BIZD over 1 month and 3 months but just fell short of the top quartile LTM and is a few notches behind BIZD. Those are two high dividend ETFs for the income oriented.

The 1-month period posted a 30-1 positive score. The only line item slightly in the red was E&P (XOP). We framed the 1-month time horizon comeback across the asset classes earlier in this commentary, but the top performers are a diverse mix from Utilities (XLU) at #1, Regional Banks (KRE) at #2, EM Equities (VWO) at #3, Real Estate ETF (XLRE) at #4, and small caps (RUT) at #5.
The Utilities position at #1 is harder to nail down the rationale these days since it is defensive and also interest rate sensitive. XLU is now running at #2 over 3 months after a lot of time in the lower end of the rankings (lower end of the third quartile over the past year).
The secular view could simply be major buyers (and legacy holders adding or holding) on the expectation of sustained high growth for power and an ocean of demand for power from data centers, AI growth, EVs, etc. Defensive + interest rate sensitivity can attract UST bulls and secular demand growth has been in the mix of high-level themes.

The 3-month mix shows Base Metals (DBB) on top, XLU a strong second, Energy (XLE), and E&P (XOP), and the EM Equity ETF (VWO) taking the top 5 with Builders (XHB), Financials (XLF), and Materials (XLB) right behind them in to wrap the top quartile with the defensive Staples ETF (XLP) just across the line. We don’t see any of the major Tech ETFs or major benchmarks in the mix until we get down to NASDAQ at the low end of the second quartile for 3 months. That might surprise some.
The only two in the red are the struggling Transports (XTN) on the bottom and the long duration 20+ Year UST ETF (TLT) in second to last. We see 4 of 8 in the bottom quartile from the bond ETF universe with TLT, GOVT, AGG, and LQD feeling the duration struggle. HY and EMB round out the bond ETF mix just over the border in the third quartile.

We wrap with the 1-year trailing returns that show the Builders (XHB) still holding down a comfortable lead over Tech (XLK), Mag 7 heavy Communications Services ETF (XLC), and the NASDAQ (IXIC). Right behind that in the top 5 is Regional Banks (KRE), which is being measured from the spring 2023 starting point on the way back from the regional bank crisis.
After the top 5, we then have the broad Financials ETF (XLF) followed by the BDC ETF (BIZD). There is a mixed array of themes in those top performers, but imminent recession risk is not one of them. A contraction outcome for now would still take a shock whether geopolitical or some reckless policy actions radiating out from the Beltway Buttheads.
See also:
Footnotes & Flashbacks: State of Yields 5-19-24
Industrial Production April 2024: Another Softer Spot 5-16-24
CPI April 2024: Salve Without Salvation 5-15-24
Retail Sales April 2024: Get by with a Little Help 5-15-24
Footnotes & Flashbacks: State of Yields 5-12-24
Footnotes & Flashbacks: Asset Returns 5-12-24
Consumer Sentiment: Flesh Wound? 5-10-24
April Payroll: Occupational Breakdown 5-3-24
Payroll April 2024: Market Dons the Rally Hat 5-3-24
JOLTS March 2024: Slower Lane, Not a Breakdown 5-1-24
Employment Cost Index March 2024: Sticky is as Sticky Does 4-30-24
PCE, Income, and Outlays: The Challenge of Constructive 4-26-24
1Q24 GDP: Too Much Drama 4-25-24
1Q24 GDP: Looking into the Investment Layers 4-25-24
Durable Goods: Back to Business as Usual? 4-24-24
Systemic Corporate and Consumer Debt Metrics: Z.1 Update 4-22-24