
Footnotes & Flashbacks: Asset Returns 5-12-24
A good week in equities and flattish stretch for debt sets the stage for some big news this week and potential volatility with another round of CPI and PPI.


"He's all talk...I think...I hope…."
A quiet week for economic releases made for a gentler time for bonds and easier stretch for equities with across-the-board positive returns from large cap to small cap as the market gears up for the next round of CPI and PPI data.
The 31 benchmarks and ETFs we track posted a score of 28-3 favoring positive for the week with 2 of those 3 in the red from bond ETFs with a more defensive bias in the top quartile and bond ETFs making up the bulk of the low quartile.
The trailing 1-month is riding a few good weeks of equity results with a score of 25-6 with the E&P ETF (XOP) and Energy ETF (XLE) holding down the last two spots on the bottom of the list while only the long duration 20+ UST ETF (TLT) was in the bottom quartile of the group.
The stakes are high for this week’s CPI and PPI numbers that will come with another Retail sales release with late springtime being a classic test period for sectors such as housing, autos, and ticket bookings with airlines and hotels.
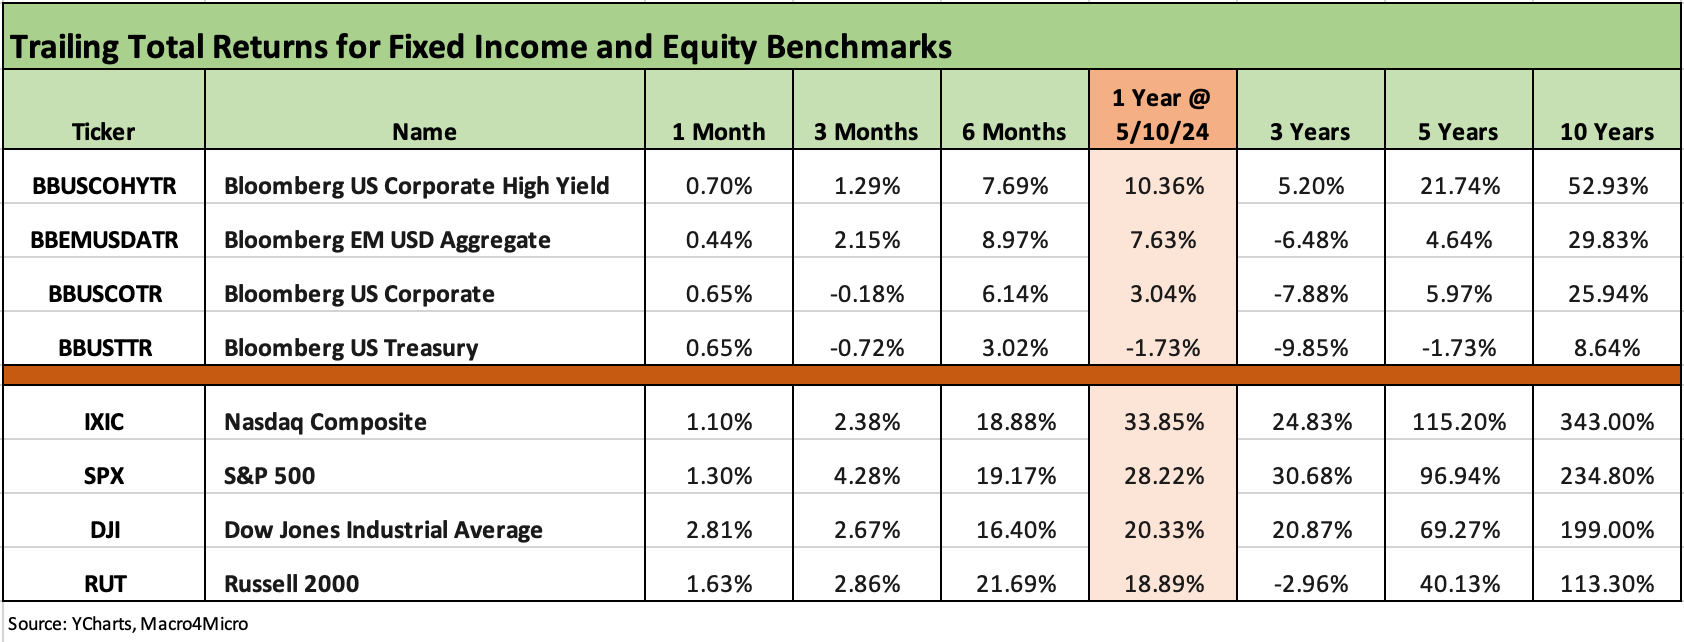
The above chart details the trailing returns for the high-level debt and equity benchmarks we watch. We line them up in descending order of total returns for the trailing 1-year horizon in what has been a run of very strong equity returns with the Russell 2000 in last place among the Big 4 stock indexes with an impressive +18.9% return and the NASDAQ weighing in at #1 with +33.9%.
For the trailing 1-month, we see all 4 debt and all 4 equity benchmarks in the positive zone even if only slightly in the black for debt. With the shifting timeline, the 1-month moved from 3 out of 4 negative in debt to all 4 positive this past week. Last week, equities were all in the negative zone for the trailing 1-month period, but that group is back in the positive zone for all 4 benchmarks.
Looking back 6 months, we are still seeing strong numbers with a piece of the late 2023 rally factored in. The earnings season has been on balance favorable for fundamentals but has not supported UST bulls.
As we get into the 31 benchmark and ETF breakdowns later in the commentary, we see a mix of financials and cyclicals doing well for the trailing 1-month period, and those sectors have offered more support in aggregate than the leading tech benchmarks and Mag 7 heavy ETFs.
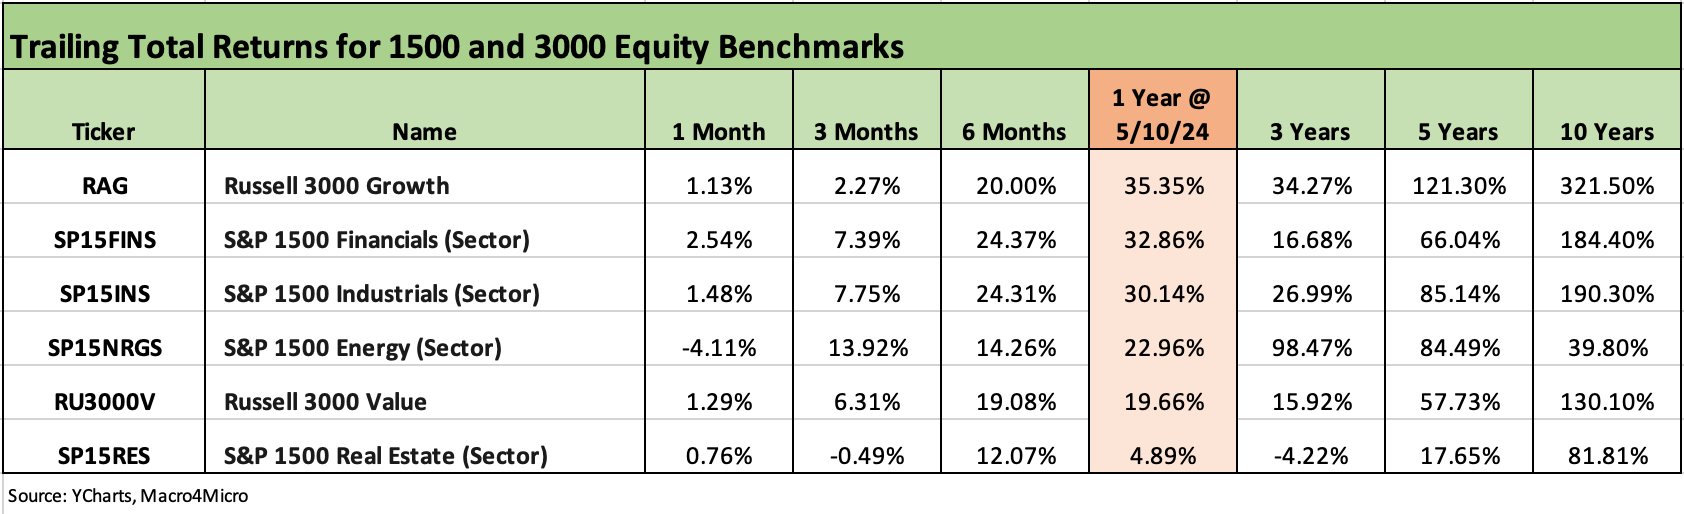
The above chart updates our 1500 and 3000 series, and that list of 6 also sharply improved since last week for the trailing 1-month. Last week the 1-month grouping saw all 6 in negative range while this week we see a shift to 5 out of 6 positive with only Energy still posting a -4% handle negative return. The 1-year numbers are exceptional, as are the 6 months, with the exception of the volatile but generally underperforming Real Estate index. The rolling 3 months for Real Estate is still in the red.
The rolling return visual
In the next section we get into the details of the 31 ETFs and benchmarks for trailing periods. Below we offer a condensed 4-chart view for an easy visual before we break out each time period in the commentary further below. This is a useful exercise we do each week for signals across industry groups and asset classes.
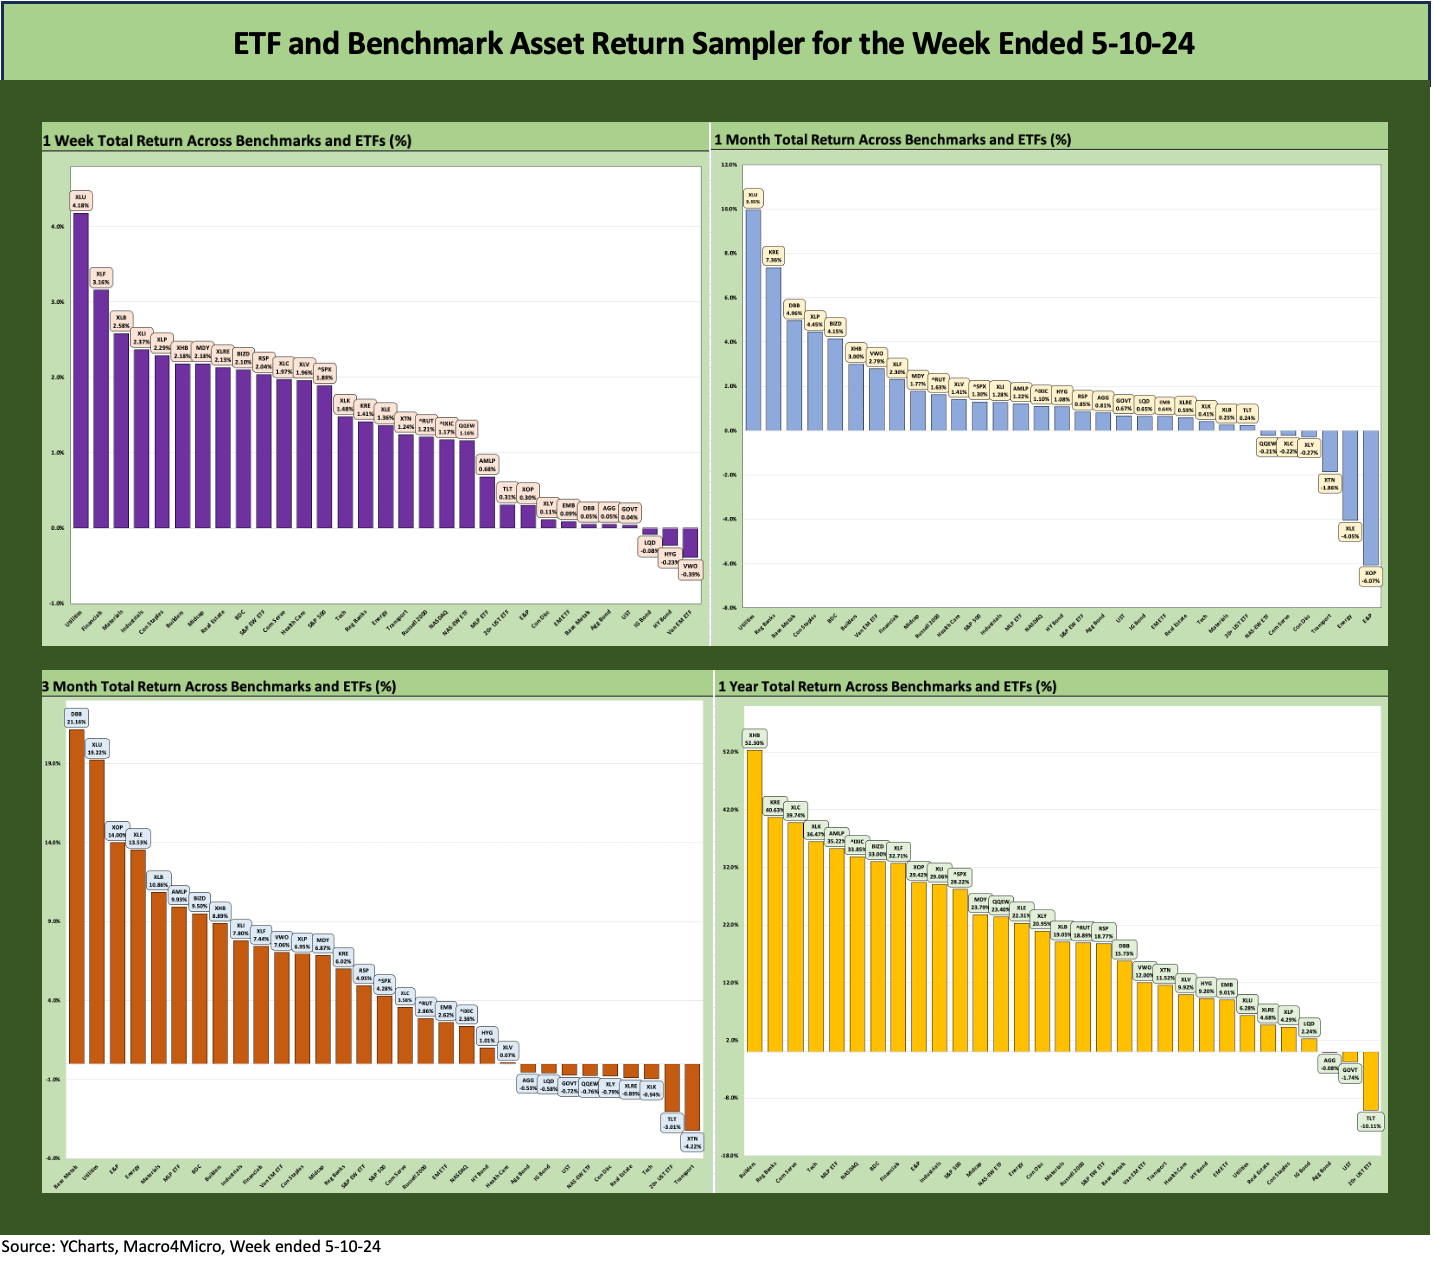
The above chart is one of the easier visuals on return mix with an overwhelming base of positive returns across diverse sectors for the time horizons cited.
The Magnificent 7 heavy ETFs…
Some of the benchmarks and industry ETFs we include have issuer concentration elements that leave them wagged by a few names. When looking across some of the bellwether industry/subsector ETFs in the rankings, it is good to keep in mind which narrow ETFs (vs. broad market benchmarks) get wagged more by the “Magnificent 7” including Consumer Discretionary (XLY) with Amazon and Tesla, Tech (XLK) with Microsoft, Apple, and NVIDIA, and Communications Services (XLC) with Alphabet and Meta.
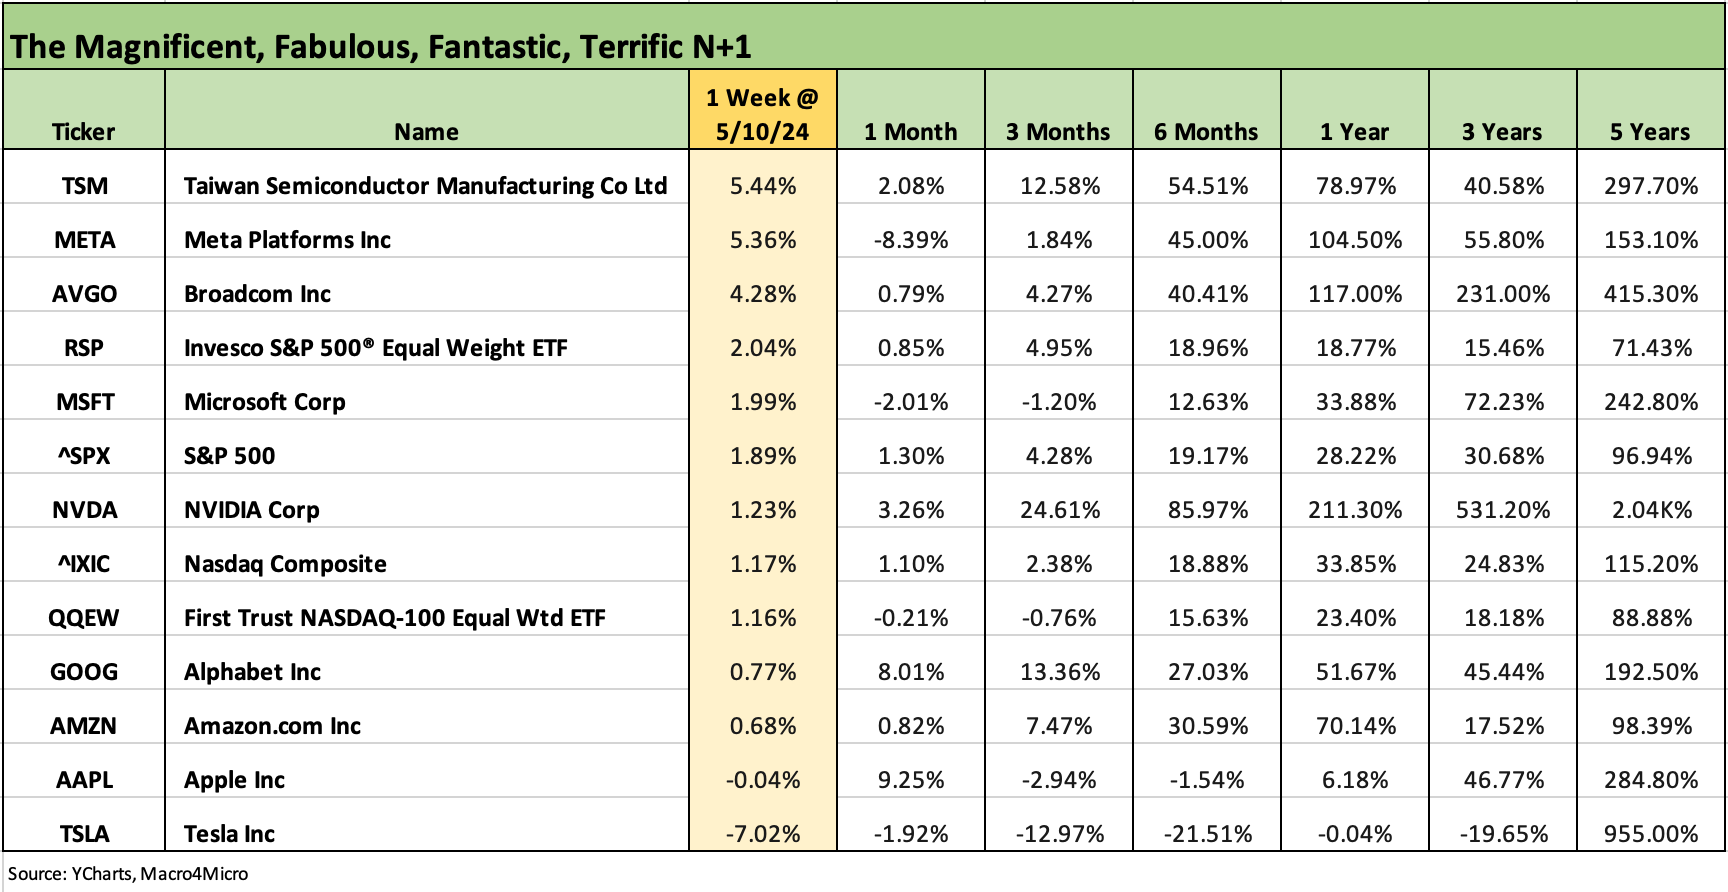
We recently added the above chart to the weekly so we can track the headline mega-names and see which might have wagged certain ETFs or the broader capitalization weighted benchmarks. We line up some of the major large cap Tech-centric names in descending order of total returns for the week.
We include the S&P 500 and NASDAQ along with the NASDAQ 100 Equal Weighted ETF (QQEW) and the S&P 500 Equal Weighted ETF (RSP). A table of the big tech names from the Mag 7 to the broader collection of “headline types” streamline the weekly review if one of the big ETF names is driving performance.
Taiwan Semiconductor took the lead this week on the list as a lot of excitement lies ahead for TSM and China-US trade politics heats up. We see Tesla taking another battering the past week that left TSLA negative in trailing time horizons all the way back to the trailing 3 years. Looking back 5 years, however, only NVDA has beaten TSLA. NVDA has crushed the group over 1 year and 3 years.
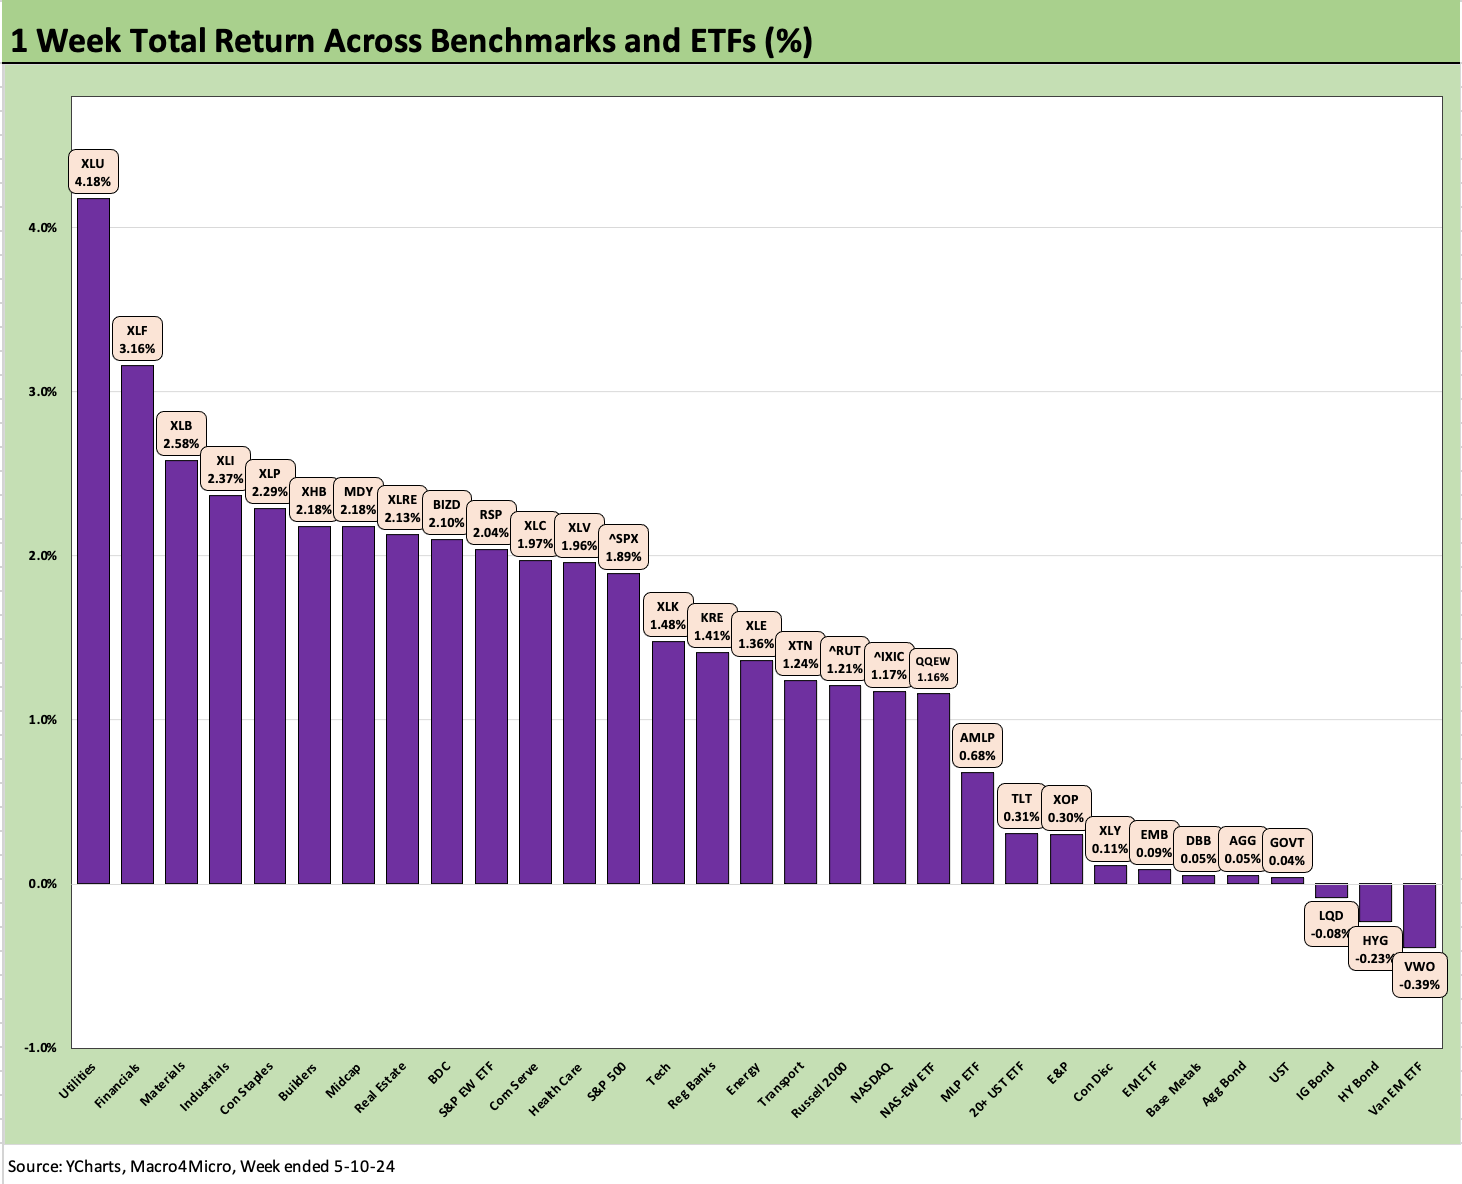
The above chart frames the trailing 1-week returns for the 31 line items. We see a score of 28-3 positive with 2 of the 3 negative being bond ETFs (LQD and HYG) on a small adverse UST move inside 10 years and a slight spread widening of 4 bps in HY.
We see some winners among defensive equities in the top quartile with Utilities showing up as #1 again this week and Staples (XLP) joining the top tier. We see the tech-heavy benchmarks not making the top quartile and the same for the Mag 7 heavy ETFs.
The top tier includes some bellwether cyclicals including Materials (XLB) and Industrials (XLI) while the major Financials ETF (XLF) weighed in at #2. As we noted earlier, the bottom quartile was led by bond ETFs once again with only the long duration TLT bond ETF making it into the third quartile on a firmer long end of the UST curve this past week.
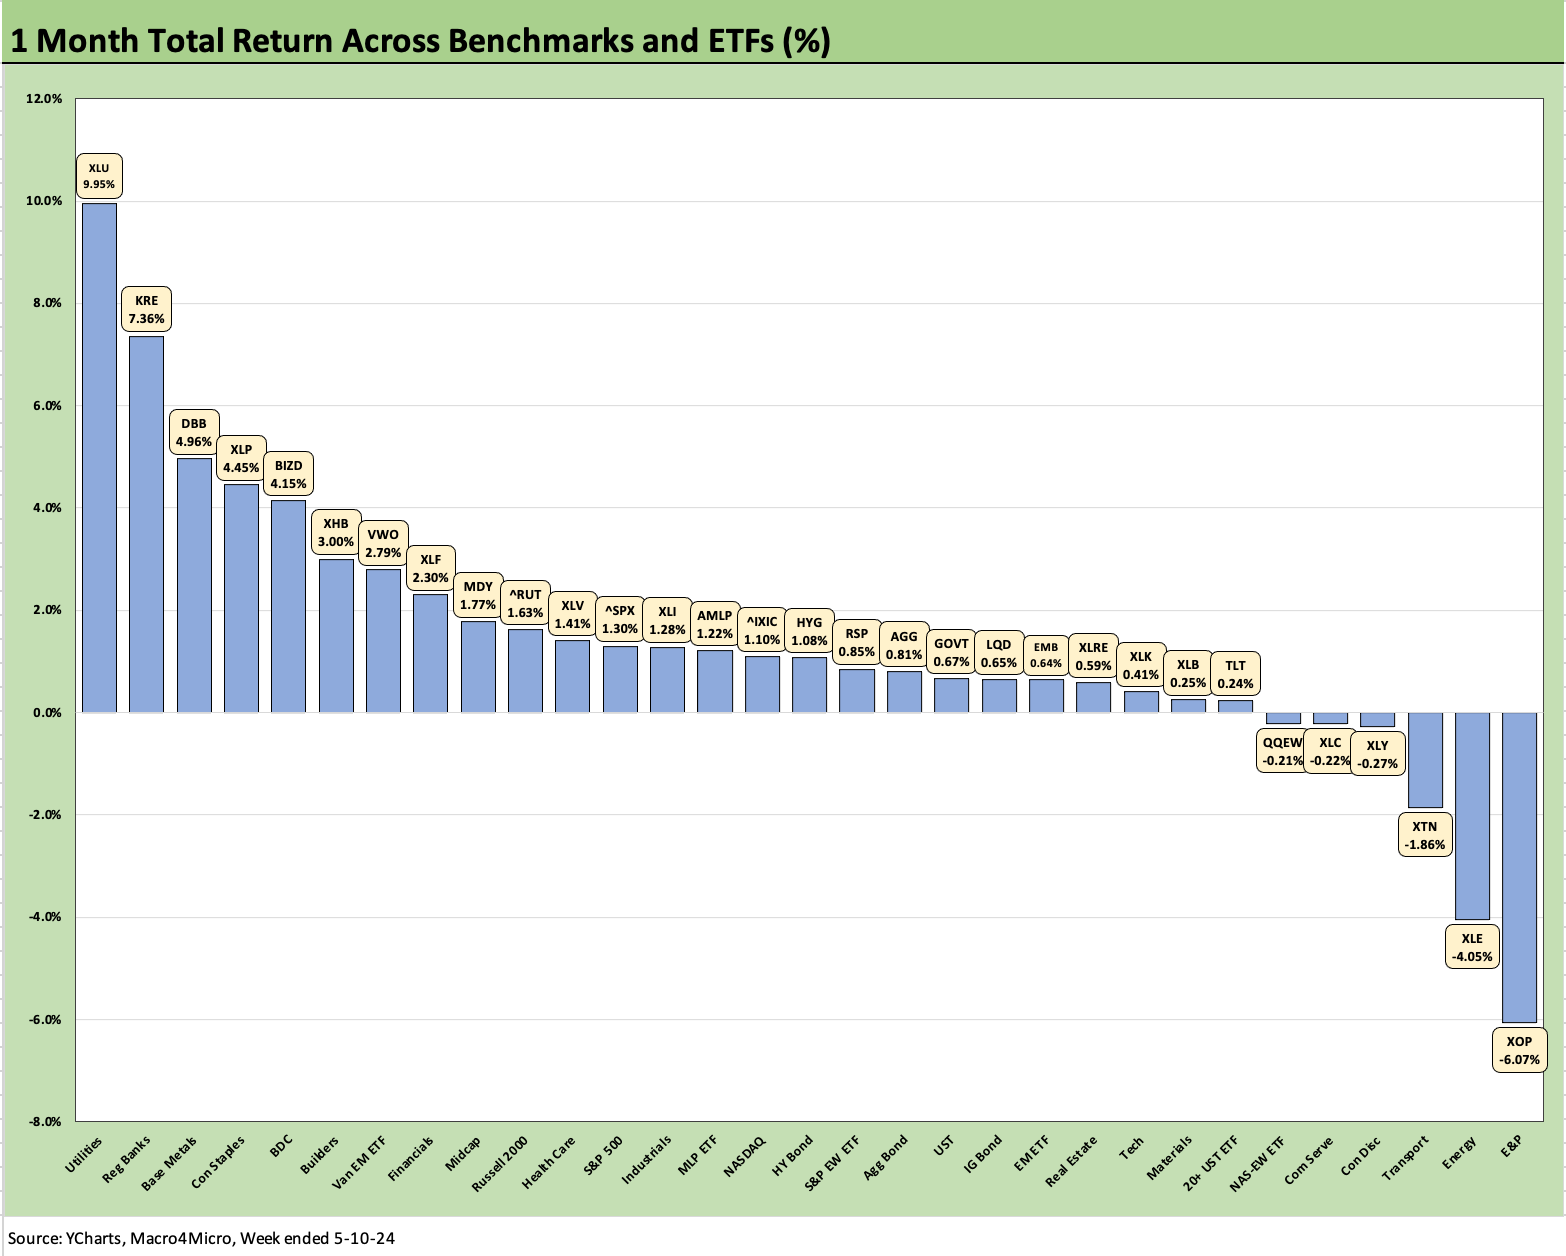
The 1-month time horizon keeps the good cheer going at 25-6 favoring positive after sitting at 7-24 last month. We see Energy names on the bottom (XOP, XLE) and Transports (XTN) dragging at third off the bottom. The Consumer Discretionary ETF (XLY) has been hurt by Tesla and not helped by Amazon the past month while the Communications Services ETF (XLC) was hurt by Meta.
The winners over the past month include defensive names such as Utilities (XLU) and Staples (XLP) in a sign of defensive moves in the market while the erratic regional banks (KRE) are putting together a rally. The builders (XHB) have been consistent and put up some very strong March quarter numbers with impressive orders and a proven ability to negotiate 7% mortgage headwinds through their creative incentive programs.
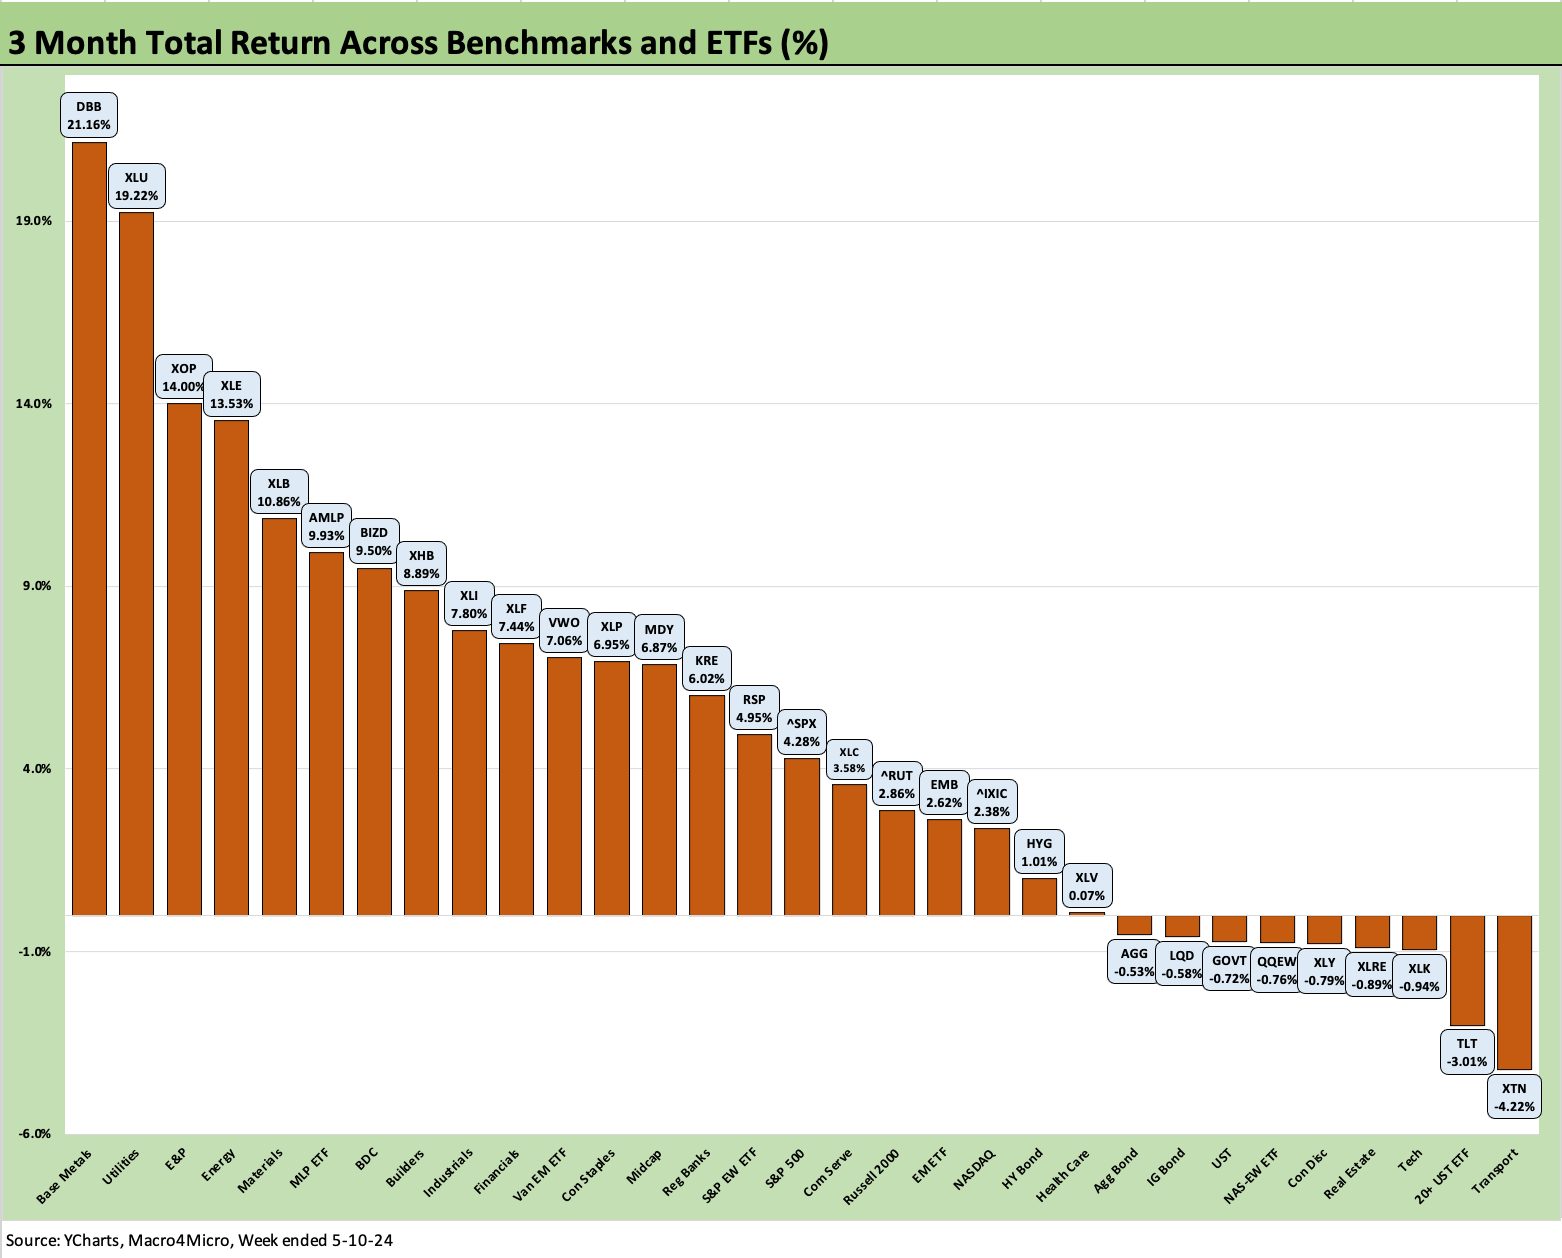
The above chart frames the 3-month numbers that weighed in at 22-9 after a 23-8 week in the last issue and 22-9 in the one before that. In other words, the rolling weeks of volatility have not unsettled the balance of moves in a period where we had a bad April and an unfavorable mix of inflation indicators (direct and indirect) related to market expectations.
We see 4 of the 9 negative line items comprised of bond ETFs with the long duration 20+ Year ETF (TLT) in second to last with Transports (XTN) still struggling and sitting in last. It is notable that the bottom quartile also includes the Tech ETF (XLK), Consumer Discretionary ETF (XLY) with Tesla and Amazon, and the Equal Weighed NASDAQ 100 ETF (QQEW).
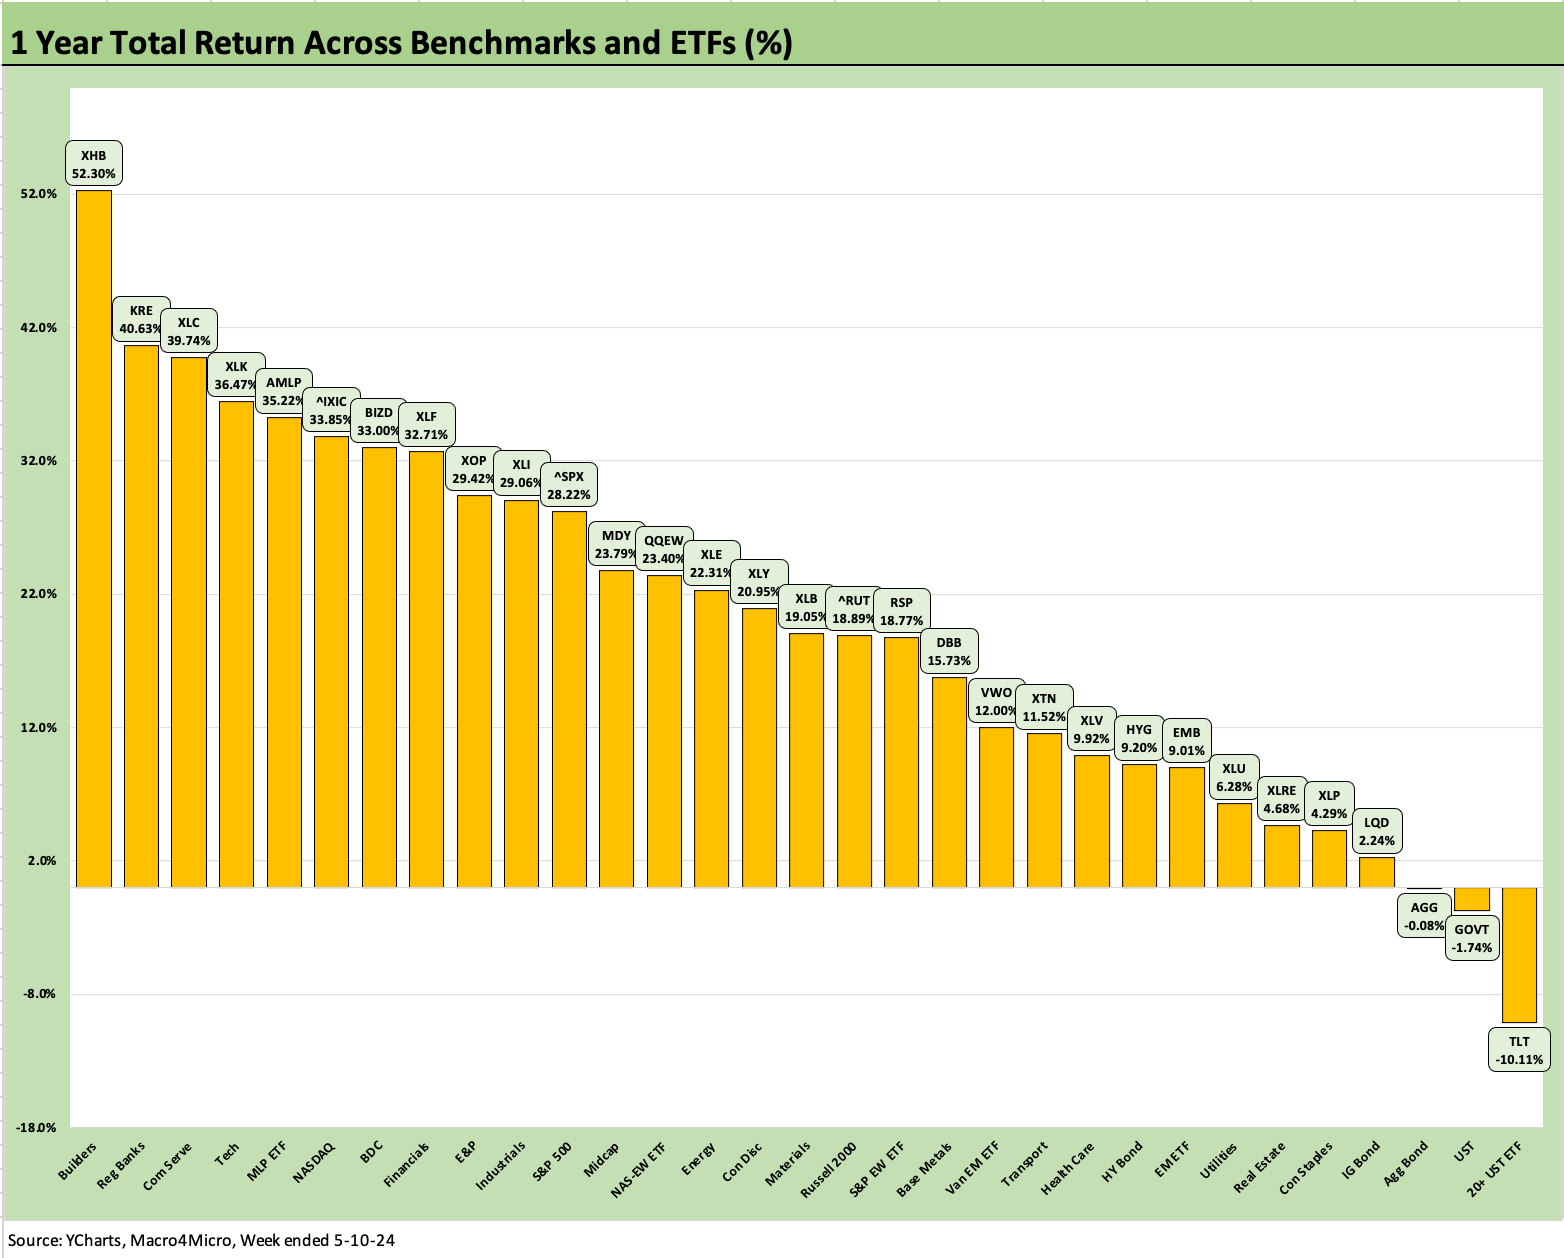
The trailing 1 year is still at 28-3 this week with the same 3 bond ETFs in the red zone. That about tells the story of the UST bull scenario of multiple cuts into 2H23 and 1H24. We see TLT on the bottom at -10.1% with GOVT and AGG at a distant second and third to last, respectively.
Looking back across the LTM period, we see Builders holding their very impressive performance at over +52% at #1. Regional Banks (KRE) are showing the recovery from the crisis spiral of March 2023, and Communications Services (XLC) and Tech (XLK) are still showing the power of the rebound from the tech pummeling in the brutal tightening year of 2022. We also see NASDAQ in the top quartile.
Rounding out the top quartile for the year we see Midstream Energy with high cash dividend payout rates and the reality of record oil and gas production volumes. The BDC ETF is in the top quartile along with Financials (XLF). The XLF performance presents a vote of confidence in asset quality and the risk symmetry of the UST curve for interest margins looking ahead. That of course ties into FOMC handicapping.
For BIZD, the BDC earnings reports have generally been solid with a few misses from the March quarter, but it would be hard to see more buzz around private credit than we see right now. The BDC story still comes down to the quality mix, floating rates, a heavy mix of structural seniority, underwriting execution, and how the cash income flows into total returns. There is also the incentive of the managers to not screw up publicly when they are seeking to raise a small nation of assets under management to manage private credit and sell related products/services.
In the interests of disclosure, I had been a regular owner of individual BDC equities over the past two years but have scaled back in relative weighting, selling some names that I owned in the green and in the low red zone. Some that were in the red I just kept on clipping the dividends along the way. As a group, the BIZD names show the sector has done well but there certainly has been plenty of divergence across the peer group in performance since 2021.
See also:
Consumer Sentiment: Flesh Wound? 5-10-24
Footnotes & Flashbacks: State of Yields 5-5-24
Footnotes & Flashbacks: Asset Returns 5-5-24
April Payroll: Occupational Breakdown 5-3-24
Payroll April 2024: Market Dons the Rally Hat 5-3-24
JOLTS March 2024: Slower Lane, Not a Breakdown 5-1-24
Employment Cost Index March 2024: Sticky is as Sticky Does 4-30-24
PCE, Income, and Outlays: The Challenge of Constructive 4-26-24
1Q24 GDP: Too Much Drama 4-25-24
1Q24 GDP: Looking into the Investment Layers 4-25-24
Durable Goods: Back to Business as Usual? 4-24-24
Systemic Corporate and Consumer Debt Metrics: Z.1 Update 4-22-24