
Credit Crib Note: Hertz (HTZ)
We look at the financial and fundamental operating profile of Hertz and provide some history.


CREDIT TREND: Negative.
Eroding leverage metrics, a highly encumbered balance sheet, strained liquidity, and the fallout from material losses will continue to weigh on Hertz (“HTZ”). Another major fleet misfire from Hertz has sent the company back into a zone of cash flow drain and balance sheet pain with the banks already needing to take protective action on restricted payments and shorten the leash on shareholder rewards.
This time around, the problem was swinging for the fence on Electric Vehicles (“EV”) after HTZ emerged from Chapter 11 (June 2021) in search of some buzz (100K Tesla EVs + Tom Brady with his final Super Bowl ring). The hits to residual value and additional depreciation badly damaged the income statement and cash flow profile and dug a hole that needs to be filled in by necessary operational improvements ahead. The result into 2024 will be lower margins and sustained higher leverage after printing a negative LTM and seeing corporate debt moving higher from $3.1 bn at 3Q23 to $3.45 bn at 4Q23 and to $3.9 bn at 1Q24. That amounts to almost $780 mn in additional secured debt in two quarters.
As we revisited in an Avis Crib Note published last week (see Credit Crib Note: Avis Budget Group 5-8-24), vehicle depreciation is a cash expense with only non-vehicle depreciation added back in deriving EBITDA. The big miss on EV residuals and additional impairments taken on the remaining fleet to be sold thus has a material cash flow impact when the smoke clears on the adjusted fleet mix to fewer EVs.
Hertz with a bad replay…
The last time HTZ aggressively deviated from the industry fleet profiles in car rental in pre-COVID years resulted in HTZ paying a price in the form of a major earnings surprise and more volatility in their stock and bonds. A major miss on guidance shortly after giving reassurance to investors in the peak 3Q16 period drove HTZ into some market credibility problems. That in turn prompted another CEO turnover and HTZ needing to turn to the 2L bond markets.
The HTZ case was not helped when Avis pushed right through that period without notable surprises and setbacks. In other words, it was issuer-specific trouble. Back in 2015-2016, the problem was too many compacts that left the US RAC operations badly exposed to poor estimates on vehicle depreciation. This problem was not mirrored at Avis during that same time period.
We know how aggression at HTZ had a history of backfiring (debt-heavy Dollar Thrifty deal, too many compacts, too many EVs) and that HTZ ended up running out of funding room in 2020 when they needed it with COVID. Avis did not have that problem. The themes around how they get back on track the past two quarters had a lot of familiar-sounding points covered. Their unsecured bonds now trade like CCC tier securities with double-digit yields and at a steep discount on their low coupon bonds issued in the $1.5 bn Nov 2021 bond financing ($500 mn 4.625% of Nov 2026, $1 bn 5% of Nov 2029).
OPERATING PROFILE:
HTZ emerged from Chapter 11 as a more distant #3 player in car rental behind Avis with the industry leader in car rental still being Enterprise by a wide margin. HTZ brings a very complicated history and very troubled recent past into a problem-plagued story line that includes a May 2020 Chapter 11 filing.
Wild ranges around valuation are intertwined with car rental evolution…
The initial wave of price action after Chapter 11 underscores how the forward views of a financially stressed car rental company can swing around. Back in May 2020, the initial shock sent unsecured bonds down to around 9 points and 2L to a 27 price. Recovery estimates were all over the map with a swing from 26 (CDS auction) to a par-plus recovery and equity return to shareholders as a bidding war unfolded in 2020 and into 2021.
It seems like a long time ago, but during the June 2020 chaos shortly after filing we estimated a 50 value for unsecured and full coverage for 2L and par plus on secured. The wild ride from there was about bidding scenarios, and the optimism was unleashed.
Since its descent into bankruptcy during COVID after 3 CEOs in 3 years moved on to 4 CEOs in 4 years, HTZ Has now added a few more CEOs to the count. That is never reassuring on what is going on “over the wall.” The backgrounds across the years included an auto parts exec (former CEO of Tenneco), two airline execs (UAL and now DAL with the latest CEO), a GE fleet manager (who was a GM board member), a retail executive with an extensive Walmart history, a former Ford CEO who hatched the Tesla EV plan, and a Goldman Sachs CFO (recently replaced). Those are serious pedigrees.
With the smoke cleared after emerging from Chapter 11, the Hertz Americas Rental Car segment (“RAC”) operations ended FY 2023 with the global fleet downsized from 2019 by over 26% with both the Americas and International segments smaller but International reduced by more proportionately (note: US RAC became Americas in 2021). The Americas average fleet in 2023 was over 4x that of the International RAC operations, but the Americas EBITDA was only double International as EV exposure and Americas depreciation misread took a toll.
FINANCIAL TRENDS:
The 2023 Leverage and EBITDA levels looked very different and were already much worse than what was seen by Hertz in 2021-2022. For the LTM 1Q24 period, leverage just got worse. LTM EBITDA in 1Q24 was negative after Net corporate debt/EBITDA posted 4.5x leverage in FY 2023 after 0.8x in FY 2022 and 0.3x in FY 2021. The plan sponsor activity and debt reorganization made for a busy 2021, but now the story will be about HTZ getting its earnings and cash flow back in order.
As Hertz takes the body blows from the severe losses it generated from EVs, there is still no hiding from the fact that Hertz still has a highly encumbered balance sheet as we detail in the capital structure further below. That makes them intrinsically more exposed to shocks as we saw with COVID. They need to be able to accurately estimate residuals, price accordingly, and get unit economics in line. That is not a new theme and was always a front burner topic and challenge for HTZ even before COVID.
The car rental industry over the decades has seen fortunes change quickly when highly leveraged players get hit by business line headwinds. This comes after the rate of cash flow generation at HTZ and resulting capital allocation during 2021-2022 had reached a mind-bending scale including $2.5 bn in stock repurchases in 2022. That came after the waves of capital structure activity in 2021 that included a rights offering, the repurchase of the preferred stock for $1.8 bn, and even more stock repurchase activity as broken out herein. The recent agreement with the banks in April 2024 will shut down repurchase activity for a while, so the banks are back on alert.
The news initially had been all good after emerging as HTZ was teeing up its reorganization process in 2021 after sorting through a bidding war for the company. HTZ emerged from Chapter 11 into soaring margins on the back of a travel boom, record low unit costs, and record high used car inflation that drove gains on fleet sales and boosted cash flow and shareholder distributions. That was supposed to be a new lease on life for its financial and operating profile under all-new management, but then EV fleet miscalculations took HTZ back to some bad memories for investors in car rental stocks and bonds. Management keeps turning over, but the same rules of basic industry economics have not changed.

The recent headlines and abysmal Hertz earnings are dominated by the EV issues as HTZ made decisions to scale back its EV fleet in two shifts with the first group comprised of 20K vehicles announced in connection with 4Q23 earnings and the second group adding another 10K EV vehicles for “disposal.” Each action includes “losses on sale” that flows into depreciation costs while additional impairment charges needed to be taken to reduce the carrying value of inventory targeted for sale.
During 1Q24, HTZ posted $276 million in losses overall on disposal of revenue earnings vehicles vs. $46 million in gains in 1Q23. That $276 mn number flowed into $969 mn in depreciation for 1Q24, more than double the $381 mn in 1Q23. The second EV disposal group in 1Q24 drove $114 million in write-downs to fair value. The EV problem resulted in more losses, more cash outflow, and more management turnover.
For 4Q23, the 20,000 EVs in the Americas unit (1/3 of the global EV fleet) were classified as “held for sale” at the year-end balance sheet date at a carrying value of $542 million. That value came after a write-down of $245 million. The EV challenges checked off included low revenue per day (RPD), higher operating costs, and higher “damage incidents.” That initial 4Q23 “EV disposal group” was followed by another 10,000 vehicles in 1Q24.
The level of write-downs is a pretty damning statement on the expectations for EVs and the fleet risk that buyers would face if the fleet owner needed to turn over fleet on a routine basis.
The operating results across time for Hertz show some of the same wild swings in car rental unit costs (notably depreciation) across the post-COVID period that we looked at in our separate Avis report. We detail some more quarterly data points in depreciation per unit metrics (“DPU”) below for Hertz.
We also address the quarter-to-quarter margin swings below, but the pre-COVID EBITDA margins underscore that Hertz always had a lot of cost structure wood to chop and operational improvements to roll into place.
We include the 2018-2019 margin details in the chart above, but there was no shortage of operational problems well before then as well. The average Adjusted EBITDA margins from 2014 to 2019 was around 6.2%. Those were below industry standards, earlier forecasts from Hertz in the pre-COVID years, and the margin potential as evident at Enterprise (back then closer to 20% than 10%).
The Adjusted EBITDA lines are the most useful metrics in recent years for Hertz since so many restructuring charges get run through the income statement across 2020-2021.
The revenue line for FY 2023 was not back to 2019 or 2018 levels yet on materially smaller average fleet size in 2023. International average fleet is down by almost half while Americas (segment changed from US RAC to Americas RAC in 2Q21) is around 17% lower even with the additional regions included in the Americas segment.
The revenue line is dictated by pricing, volume, and fleet size with Revenue per Day (RPD) materially higher now along with higher costs in all areas after over two years of vehicle inflation among other expense lines driven by inflationary effects.
The interesting twist on the inflation spike and the higher vehicle financing rates that come with the tightening cycle is that there was a temporary – but massive – positive impact from the spike in used car values that helped pump up margins. Those are gone but the other cost challenges remain.
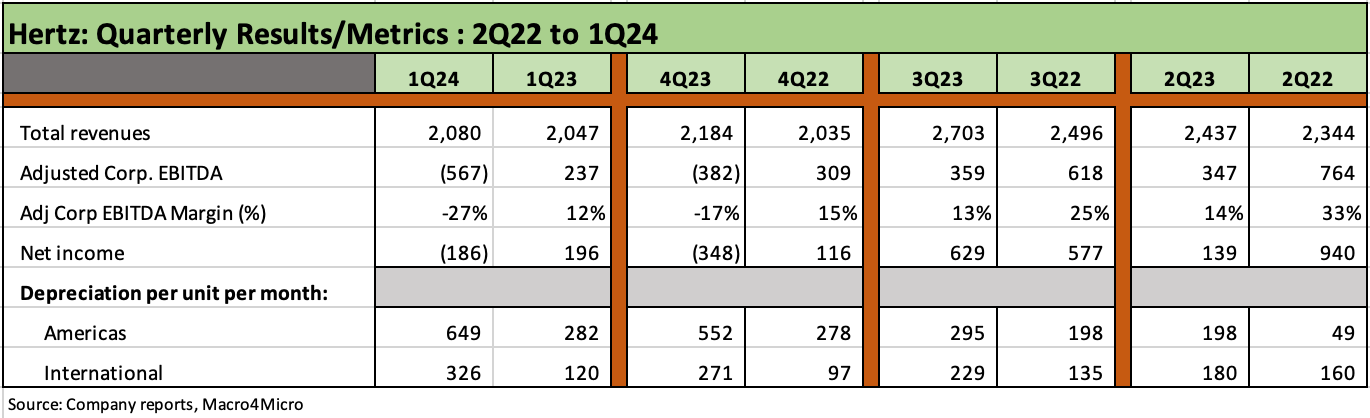
The above chart takes you on the quarterly timeline from 2Q22 to 1Q24. We present each quarter alongside the prior year quarter (1Q24 vs. 1Q23, 4Q23 vs. 4Q22, etc.). In the following chart we cover the other quarters from 2Q20 through the 1Q23 vs. the 1Q22 comparison.
The two time series together start with 2Q20, (the quarter Hertz filed Chapter 11 and marked the COVID financial lows for car rental), and we cover all the YoY quarter comps up to 1Q24.
The 3Q periods are the seasonal peaks, the 1Q quarters the seasonal lows, and the car rental companies build fleet to a peak at the end of 2Q period on the eventual path to the fleet lows at the end of 4Q.
The quarterly charts also break out each quarter’s Depreciation Per Unit (“DPU”) per month for the Americas and the International segment. As a reminder, the Americas segment was set up in 2Q21 to replace the US RAC segment. The DPU numbers are notable and very significant to the trend line in EBITDA.
The table above begins with the second-best EBITDA quarter (2Q22) as the tightening cycle was underway after the Fed started hiking in mid-March 2022 (effective 3-17-22). The 2Q22 quarter weighed in with the #2 gross EBITDA line for a quarter during the period as Hertz posted a 33% EBITDA margin.
The four 2022 quarters added up to a record annual EBITDA year for HTZ as noted in the prior chart with FY 2022 EBITDA ($2.3 bn) only modestly above the massive rebound year of FY 2021 with an EBITDA of $2.1 bn.

The above chart runs from 2Q20 when HTZ filed Chapter 11 and COVID impacts sent volumes and travel into a downward spiral. The 2Q20 period gets framed against 2021 when margins hit 34%. We end with the 1Q23 vs. 1Q22 comparison.
The table above starts with the 2Q20 collapse that generated a -71% negative EBITDA margin on a collapse to -587 mn on the EBITDA line as Hertz scrambled to address the drain from fleet costs. HTZ posted a negative EBITDA for FY 2020 at -995 mn.
The year 2021 was the last full fiscal year of ZIRP and when travel rebounded impressively and demand for goods (including used cars) was booming. The demand for car rental coincided with supply strain in the new car production chain that brought spiraling used car inflation set against the backdrop of very low financing rates for fleet funding in the ABS market. The 2Q21 quarter period also marked the emergence of HTZ from Chapter 11.
For 2Q21, the gap between the very impressive 34% EBITDA margins and the low net income for that period related to $633 mn of reorganization expenses on the way to exiting Chapter 11.
The 3Q21 period noted in the table was the #1 EBITDA quarter in dollars ($860 mn) and margin (39%) as the seasonal peak. The 3Q21 DPU per unit for the Americas was $21 followed by $26 during 4Q21.
These DPU numbers are extraordinary in comparison to the numbers for DPU in a normal year. As an example, the FY 2021 DPU per unit for Hertz in the Americas segment was $ 81, or the lowest level in a fiscal year. During the period from 2015 to 2018, US RAC had averaged $286 per year. The 1Q24 number was $649 while FY 2023 for the full year was $332.

We assembled this chart to show the timeline for the worldwide DPU per month from 2Q15 through 1Q14 and to underscore how wild the swings were in a visual. The Hi-Lo range is stunning across the post-COVID period after a fairly steady range (in relative terms) from 2015 to 2020.
The chart above shows a median DPU of $249 across the period from 2Q15 to 1Q24, so the recent gap higher in DPU begs an explanation. Hertz provided one, and that revolves around EVs while HTZ pushed investors more in the direction of expecting a low $300 range over time.
We emphasize that this chart is worldwide DPU and that the difference in DPU in the Americas segment (US RAC gave way to an Americas segment in 2021) and International DPU are detailed separately in another table further below.
During the peak margin quarters, the mid-to-high $200 normal pre-COVID gave way to supply-demand dislocations that saw used car values rise sharply and gains on vehicle sales materially reduce DPU in 2021 and into early 2022. The $592 DPU for 1Q24 includes around $119 for EV residual adjustments, which can take that number down to an adjusted $473 ex-EV.
When HTZ took an additional charge for EV units held for sale, they framed the ex-EV costs resulting in a DPU rate of around $315 per unit. That still marks a material cash impact on the company that cannot be imagined away since the EV hit is now impacting cash flow and thus balance sheet trends. Furthermore, used cars could remain somewhat in flux as we have seen in past cycles. 2024 is a painful adjustment year.
Looking at the bar chart history, we see the DPU expense had one quarter where depreciation expense was actually income (1Q22) at -42 as lower costs drove profits and cash flow to record levels.
What was not expected in 2021-2022 as the market rolled into a new set of cyclical conditions in 2023 was a fresh bout of setbacks in fleet management and EV charges and residual value problems.
The EV problems delivered a 1Q24 DPU of $592 after $498 in 4Q23. The rolling 4 quarter DPU average of $242 from 4Q22 to 3Q23 was back in the pre-COVID range. The range is likely to be in the $300 area in future quarters.

The chart above gets into the segment disclosure for the Americas RAC segment while the International RAC segment is broken out in the next chart. We highlight some impaired comparability given the changeover to an Americas RAC from US RAC segment in 2021, but that does not change the basic trends. One thing Hertz does not lack is “impaired comparability” moments across a pandemic and Chapter 11.
The segment tables for Americas RAC and for International include both segment revenues and profits as well as the main operating metrics used in framing volume, pricing, and cost trends.
The pricing structure of car rental is Revenue Per day (RPD) and Revenue per unit (RPU). These show how pricing has trended relative to the cost of vehicles, labor, and operations.
For RPD, we saw low 40-handles in 2018-2019 move up to 60-handles from FY 2021 to FY 2023. Revenue per Unit also moved from $1062 in 2019 to $1523 in FY 2023. Demand (travel) and fleet discipline will set the bar for where RPD moves during the peak travel periods ahead.
The Americas average vehicle fleet size for HTZ is lower and down by almost 17% from the 2019 pre-COVID fleet. That is still over 4x the size of the International fleet for FY 2023.
For the Americas as well as the pre-COVID US RAC segment, we highlight the poor segment EBITDA margins in 2018-2019 as Hertz struggled badly with execution (notably on fleet) while investing to upgrade its technology and operational efficiency.
We highlight the depreciation per unit (DPU) elsewhere in this report. The news was great during the post-COVID rally and now is back in trouble subject to fleet adjustments.
We do highlight the “program car” mix in the segment table above with “guaranteed depreciation” deals only relating to 1% of the ending fleet for FY 2023 (they don’t update quarterly). That 1% at year end is in line with only 1% of total annual fleet purchases being program cars (Note: as we see in the International RAC segment with 18% of fleet at year end but 44% of total purchases during the year, there can be seasonal program car purchases).
Program cars are a “thing of the past” in the US. From here, a return to a guaranteed depreciation structure might be a necessary incentive for car rental players in the US to stock EV fleet after the HTZ EV disaster. That will be a matter of negotiation if the OEMs want to see the benefits of car rental EV marketing. It will be interesting to see how that plays out away from Tesla with so much EV production planned. For now, it was a flop for HTZ.
The pre-COVID problems are a story we spent a lot of time on in prior lives, but the 2016-2017 challenges brought Hertz problems to a head and Avis had presented a notable contrast while Enterprise was generating EBITDA margins at a multiple of Hertz.

The International RAC segment posted weak 1Q24 numbers on seasonal patterns after a solid post-COVID stretch. We see some pressure on depreciation also at $326 in 1Q24 vs. $120 for 1Q23 and $203 for FY 2023. That comes despite the higher mix of program car purchases during FY 2023 by the International RAC segment at 44% with 18% of fleet at year end.
Revenues per Day (RPD) and Revenue per Unit (RPU) are both higher in International RAC but less than in the Americas in absolute dollars as well as in the delta vs. 2018-2019.
The average fleet size is at a multiyear low for International, but there are some mix questions in the equation around how much was transferred over to the new Americas segment in the 2021 segment change.
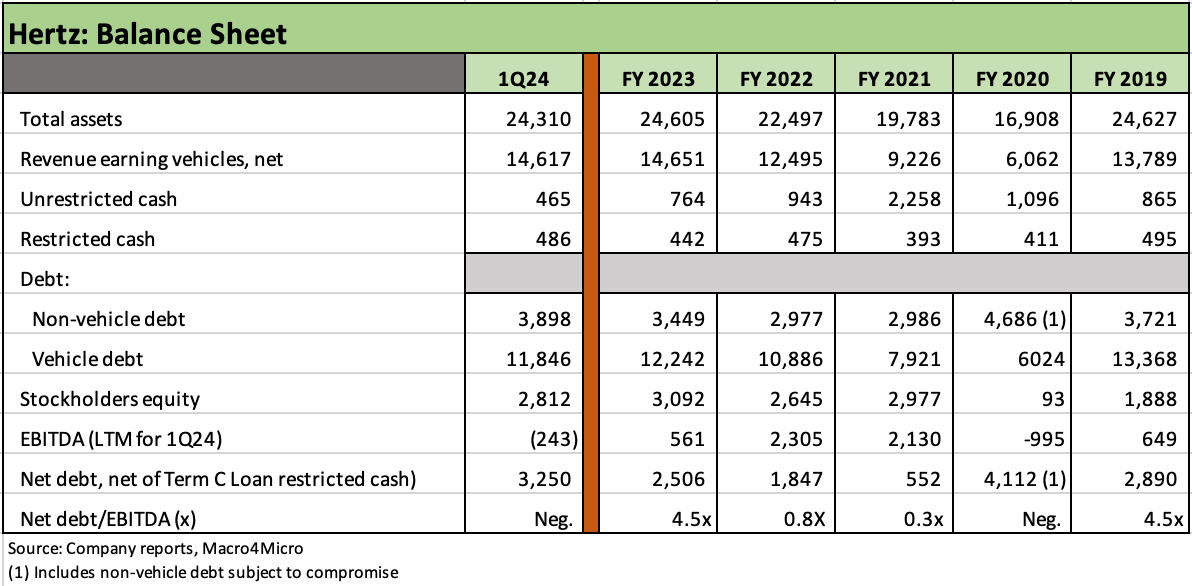
The Hertz balance sheet table above summarizes the asset trend line for cash and fleet values and details the direction of corporate debt and vehicle debt. Cash is lower and debt is higher.
At its core, Hertz is an asset-lite, capex-lite, branded, tech-based services company (as car rental operators have described themselves in the past). The asset-lite service operation just happens to have a balance-sheet-intensive fleet funding operation as a sibling that makes it possible to operate.
As discussed herein, the secured bank lines at Hertz (and Avis) are used to support overcollateralization requirements of the ABS via LOC lines set against the credit lines. The ABS and secured bank line deals are intertwined. Those lines are “contingent secured claims” (and thus closet structural subordination risk) for the bond obligor if it all heads south. The market got a taste of those theoretical risks as Hertz filed Chapter 11 back in 2020. The trick is “don’t blow up.”
The securitization-heavy car rental operators (that is, excluding IG-rated Enterprise) need to remain financially viable to avoid fleet unwinds and ABS amortization events. Credit quality is always critical for the “asset-lite” side of the equation. That means be careful as a CCC borrower.
While the fleet units have declined since 2019 before Chapter 11, we see the fleet dollar total value above pre-COVID levels as the price per unit has soared in an inflationary market that has seen more than its share of supply side problems along the way.
We see the fleet lows of 2020 in the table as a rapid fleet downsizing and liquidation process was required to mitigate a very high rate of cash bleed as HTZ was required to fund the vehicle lease payments to the ABS and vehicle debt structures. Idle vehicles still came with a very high cash cost.
Fleet is funded by the ABS and fleet funding entities globally that we detail further below, but the corporate debt does not have claims on the fleet.
Similarly, the vehicle debt does not have claims on Hertz corporate assets, but the letters of credit used to support the overcollateralization requirement would be senior secured debt above bondholders if the letters of credit were drawn.
For the new kids on the block, book equity is of tertiary importance in assessing car rental asset coverage, the stockholders’ equity base of Hertz was rebuilt by the recap from plan sponsors during the 2021 exit from Chapter 11. The fact that Avis posts -$508 million in negative equity with a market cap over $4 bn offers a stark reminder of the limitations of historical book value for many industries and issuers. With its book stockholder equity of $2.8 billion, HTZ posts a recent market cap around $1.5 bn.

Anyone picking up Hertz for the first time or getting updated on “How Hertz got here” should go back to read the HTZ 2021 10-K’s MD&A section on Financial Condition. That covers the heavy traffic in the HTZ Capital structure as it geared up to emerge after a bidding war broke out in Chapter 11. The winners in the trade were Knighthead Capital, Certares Opportunities, and Apollo.
The Hertz capital structure ex-vehicle debt is dominated by a combination of secured debt in the RCF and term loans and the contingent exposure of the RCF related to LOC support in the ABS structures.
The balance sheet at 1Q24 shows a hefty base of secured debt that only grew in the face of record profits booked in 2022 as an additional $500 mn of secured added onto the tally of debt with $500 million of “Incremental Term B Loan.” More secured debt arrived as HTZ found themselves in another jam with the EV fleet problems and was getting hammered by the costs of funding that plan. The $450 mn drawn on the RCF is not helping the asset protection story for unsecured bonds.
Instead of profits feeling an expected mix of normalization pressures and lower EBITDA, Hertz saw earnings collapse into 4Q23 and 1Q24. HTZ was bleeding from the failure of its EV strategy spearheaded by a former Ford CEO operating as interim head. It was a “bold” move, but one that had high risk-reward with a heavy dose of “speculative” on the reward side.
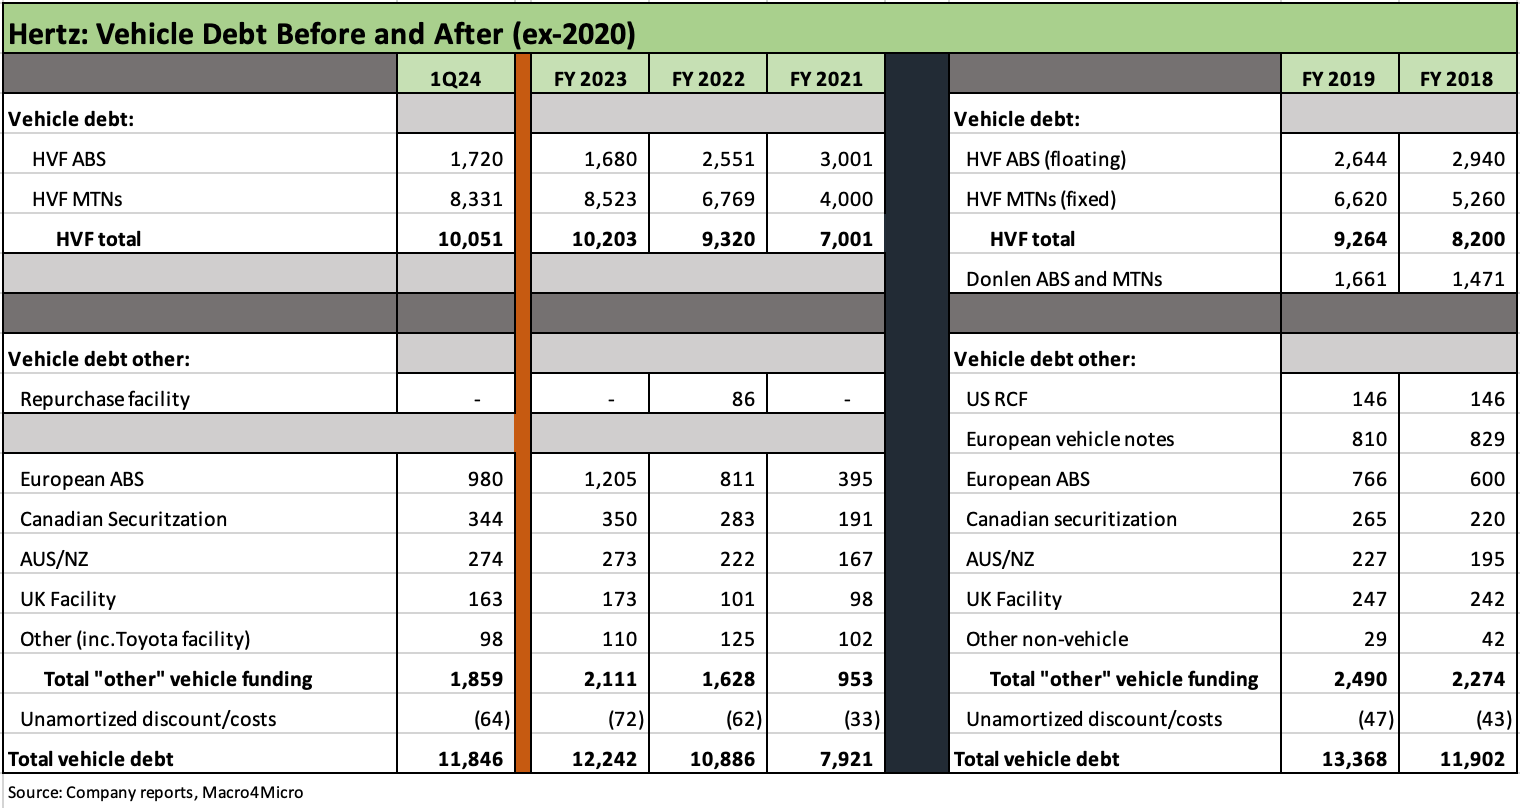
Vehicle funding is the life blood of the speculative grade car rental operator. ABS and related structures historically provided low cost of funds and a very deep market with a history of no losses in Chapter 11 (ANC, Budget). The sales pitch on ABS has always been a very sound one for car rental.
The overcollateralization requirements for the high-quality credit ratings in the tranches are protected by the LTVs on the initial structures with ongoing support provided by asset value tests. To the extent those ABS coverage ratios are in jeopardy, the secured bank lines have letters of credit to support the structure. The ABS can get more cars, more cash, or more LOCs. That is why the car rental companies and lenders still need to watch their secured credit lines closely.
The LOC details are updated every quarter in the 10-Q or 10-K. At 1Q24, HTZ had outstanding standby letters of credit of $944 mn with support primarily provided by $684 million under the RCF and $245 million under the Term C Loan. The Term C loan has no more capacity.
The amendments to the bank lines will need to be watched with the first lien debt covenant being eased in April 2024 after the EV problem. The First Lien RCF leverage covenant was temporarily moved to 5.0x for 2Q24 and 3Q24 (from 3.5x) and to 4.75x in 4Q24 and 1Q25 (from 3.0x). Per the 1Q24 10-Q, there is also a monthly minimum liquidity requirement of $400 mn for 2Q24 and 3Q24 and $500 mn for 4Q24 and 1Q25.
The tight liquidity and RCF needs remind us of one more SNAFU from Hertz in the market in 2020. In June 2020, HTZ had moved to reject the master lease structure in Chapter 11 and essentially address the collateral leases on a car-by-car basis. HTZ attempted to extract concessions for a more orderly downsizing. Hertz to lenders: “The car is parked in the La Brea tar pits. Go pick it up yourself.” That was the tone at least. HTZ was challenging the foundation of the fleet ABS structures. Trade groups and lenders were not happy.
The banks and ABS lenders blinked for good reason as Hertz held a gun to its own head. At the same time, HTZ was pointing at a “dead man’s switch” that connected to a nuclear device strapped to the ABS market. Everyone was on the hook from the banks to the ABS holders to those with used vehicle exposure (including Avis).
The HTZ lease rejection gambit put a lot of fees and loss exposure at risk. I tag teamed with a lawyer in prior lives on the lease rejection issue to detail the flareup but won’t get into that laundry list in this commentary. The process had a constructive ending, however, that facilitated a highly successful reorganization process. (Just google Hertz ABS lease rejection June 2020 for background).
The main takeaway for a half empty credit guy is that bankruptcy court is its own world, and structures can get challenged at any time given the whims of a bankruptcy judge (think back to the infamous Windstream read on the substance of a covenant rather than the “four corners of the contract” rule). Things can go wrong and that was the fear in the Hertz lease rejection. Cooler heads prevailed in the end.
The half full takeaway from the brief lease rejection trauma at Hertz is that borrowers and lenders know that the smart play is to work to protect all parties and avoid zero sum games where there is so much balance sheet at risk. The master lease challenge presented some binary risk effects for the Hertz-related parties but also could flow into cash losses for the industry that could set off domino effects.
It is just as easy to say that in the HTZ Chapter 11, the ABS process provided a model for ABS and car rental operators if there was ever a replay. The lesson was “start organizing early to arrange for an orderly downsizing of the fleet.” That was a unique situation in 2020 given the pandemic. In the end, the car rental ABS stayed bullet proof despite the warning shot.

The above chart may be “too much chart” for the point to be made, but the level of activity seen in 2021 is worth looking at in the context of where HTZ finds itself today. The $3.43 bn in share buybacks from 2021 to 2023 stands out with $2.5 bn of that in 2022. It is safe to say the investor groups involved in the restructuring of Hertz did a lot of derisking in a hurry.
The share buybacks were addressed in recent negotiations with banks, and share repurchases under the current HTZ buyback plan that was approved in June 2022 are on hold. Per the 1Q24 10Q, “…the repurchase of shares is not permitted commencing April 16, 2024 through April 1, 2025.”
Since the HTZ approval of a $2.0 bn buyback program on June 15, 2022, HTZ had repurchased $1.1 bn as HTZ rode the booming profits of 2022. The chart above shows “only” $315 million in FY 2023.
HISTORY AND HIGHLIGHTS
Ownership history…
The history of Hertz and its ownership structure is more like a Flat Stanley travel itinerary, so we will just flag some of the high profile stops along the way. HTZ had strategic owners (e.g. Ford), financial buyer/strategic buyer combinations (Ford + Banks), went through multiple LBOs and IPOs, and eventually ended up exiting Chapter 11 through a heavy involvement of private equity (after Hertz almost ended up being owned by creditors).
Starting the clock in the mid-1980s, Hertz was purchased by UAL Corp (United Airlines) from RCA. The plot thickened on where car rental fit into the economic landscape when UAL changed its name to Allegis in 1987 as it sought to become an integrated travel services company owning airlines (United), car rental (Hertz), and hotels (Westin, Hilton International).
The Allegis plan immediately unraveled as the pilots and a private equity firm (Coniston) sought to buy the airline. Shareholders and key board members hated the plan. Hertz was then sold off into an LBO (with management and Ford). The travel services link offers a reminder that car rental lives and dies by airport travel even if the off-airport exposure has grown over the years (Hertz is now 68% of global revenues airport and 32% off-airport).
Enter the automakers…
The array of buyout interest in car rental in the 1980s set off waves of activity by the automakers seeking to take stakes in car rental companies to protect major customers that they might lose in an LBO. Ford took stakes in Budget and already controlled Hertz, GM took a stake in Avis and National, and Chrysler as the runt of the litter took a stake in Dollar Thrifty and Alamo.
The program cars rose up in the age of excess auto manufacturing capacity, and the Auto OEMs needed the demand to keep the plants running given their staffing challenges (Jobs Bank in UAW deals, etc.). The “program cars” were usually lower priced, low optioned vehicles that would be sold back to the OEMs for remarketing. The car rental companies did not take the residual value risk or face the remarketing demands.
Ford sold down part of its Hertz stake to Volvo and Commerzbank over time to reduce its ownership to 49% before eventually buying in the shares it did not own (including the Hertz management stake). HTZ later did an IPO in 1997 from the Ford family tree. Then Ford decided to buy back the stake it did not own in 2000 (~18.5%). Never a dull moment in shifting ownership structure.
Then Hertz did another LBO in 2005 (Clayton, Dubilier & Rice + Carlyle+ Merrill) followed by another IPO in 2006.
The end of program cars and guaranteed depreciation, rise of residual value risk…
After 2006, the credit crisis escalated into an auto sector crisis. The legacy Big 3 with the dynamics of “keep plants running by selling excess capacity to daily car rental” would soon be over. The OEMs were more focused on efficiency and quality and less about keeping excess capacity in place to satisfy the Jobs Bank and UAW demands.
The automotive mobility connection to car rental remained strong, but the OEMs had their own problems in 2008-2009. The fact that Icahn and their extensive interests in the auto chain (suppliers, retail aftermarket, mobility, etc.) got involved in Hertz as a major stakeholder was no coincidence.
After the 2009 OEM bankruptcies (GM, Chrysler), the dramatic downsizing of “guaranteed depreciation” deals was upon the industry and residual value risks were here to stay. The threat of swings in vehicle depreciation ushered in a new age of residual risk management as a critical part of pricing strategies and demanding improvements in retail and dealer remarketing activities.
With 1Q24 results, Hertz still holds the title as the worst operator in dealing with this critical risk factor of managing depreciation risk and factoring it into pricing. That had been true since the fiasco of 2016 when Hertz dramatically missed recent guidance not long after some sizeable bond deals. Another CEO change arrived soon after that (former UAL exec out, former GE fleet exec and GM board member in). The market saw a lot more volatility in HTZ stocks and bonds across 2017.
Management turmoil and turnover…
Over a few years from 2014 to 2017, executives from backgrounds in auto suppliers, airlines, and vehicle fleet management did not get the job done. Then COVID came. As a side story, the 2014-2015 period included a drawn-out restatement of the company’s financials. That got very messy with the SEC including fraud claims.
From 4Q14 to 1Q24, Hertz has had 7 different CEOs by our count including the latest management changes. We detailed those changes above in this note.