
JOLTS March 2024: Slower Lane, Not a Breakdown
March 2024 JOLTS prints the lowest number since early 2021 as it moves lower to just “high” in a UST market needing “low.”


Will pink knit hats be the new paramilitary helmet on Jan 6, 2025?
We are not at the “bad is good” stage in JOLTs even if we rationalize a “so-so is OK” theme on jobs pending the more current news for the April jobs count with the Friday payroll release.
A job openings number of 8.49 million is down sequentially from 8.75 million for Feb 2024 but still 3 million above the 2007-2024 median while being well off the 12.2 million peak of March 2022 when the tightening cycle got underway.
ADP was slightly above expectations at +192K with the FOMC due later today, so the big action still lies ahead on Friday after the discomfort of the quarterly Employment Cost Index offered some unfavorable data points for UST bulls (see Employment Cost Index March 2024: Sticky is as Sticky Does 4-30-24).

The update on JOLTS always comes with the qualifier of 1-month lag, and the real news comes with the April payroll on Friday. With JOLTS posting 8.49 million openings (vs. Feb 8.75 million), the number at least did not send another piece of bad news to the markets by running toward 9 million on FOMC day.
The exercise from here will be in part about gauging how employers feel about “higher for longer” in their financing costs and gauging what that might mean for customer planning. With Services such a dominant factor in the payroll mix, there is the overriding question of how long the consumer sector can sustain 3% handle savings rates as that monthly credit card bill starts to feel like a loan shark operation. Interest rates will weigh on everything from the cost of credit to the cost of working capital let alone the usual refinancing risks as coupons step up on refinancing.
As detailed in the chart below, we still see hires at a significant multiple of “Layoffs+ Discharges.” By the late summer and fall, the market will be digesting the next leg of the journey for funding costs, inflation trends, whether hiring has peaked, and what the potential election outcomes might mean for various businesses and regions.

The partisan reaction wildcard…when does it factor into pricing?
There will also be the partisan lens factor in framing what 2025 will hold for jobs and consumption after what will likely be the ugliest election year since 1860 (we think it just passed 1968 this year with all the trials and heightened rhetoric). The only guarantee might be that around 50% of the consumer base will think the end of the world has arrived. Then again, MAGA world sees 46.9% as the new 51.3%.
Whether the partisan hate fest spreads to hiring defensiveness and side effects of market calamities (e.g. debt ceiling) will be the speculative drill across the summer into the fall. Will we see a mass roundup for deportation of undocumented consumers as explicitly promised this past week in a Time magazine cover story interview? On a not lighter note, will we see a military crackdown on women in pink knit hats if they end up storming Washinton DC again? (After all, they are not true patriots if unarmed and not packing bear spray).
There will be a lot of consumers fearing deportation (especially if they read the Time Magazine cover story). Regardless of your politics, “price x volume” is a nonpartisan reality called revenues. Someone will feel that. The fact is that tariffs will also bring pain to the buyers/consumers (Trump still insists in the Time interview that he collected tariff money from China. “Sellers pay” is his story and he is stupidly sticking to it.)
Anyone who has looked at the partisan divide on consumer sentiment will perhaps laugh but more likely worry about what it means for investment and hiring (see Consumer Sentiment: Multiple Personalities 1-19-24). The divergence of consumer sentiment in the U Mich survey across Democrats, Independents and Republicans is mind boggling even if consistent with the actively managed (manipulated?) intensity of the “with me or against me” tone in politics.
A material sentiment crash that translates into hiring and PCE is the ace in the hole for UST bulls in 2025 unless we go into a detour to stagflation. The “stag debate” has already been in vogue despite the line items in 1Q24 GDP (see 1Q24 GDP: Too Much Drama 4-25-24, 1Q24 GDP: Looking into the Investment Layers 4-25-24). Stagflation risk is a debate for other days as the election gets closer and hiring and firing decisions and capital budgeting for 2025 get busy in the corporate sector. We certainly don’t see it in the line items of 1Q24.
JOLTS by the numbers…
In the next wave of charts, we run through the main trend lines across hires, separations and quits. The takeaway is a robust labor market even if past the peak.
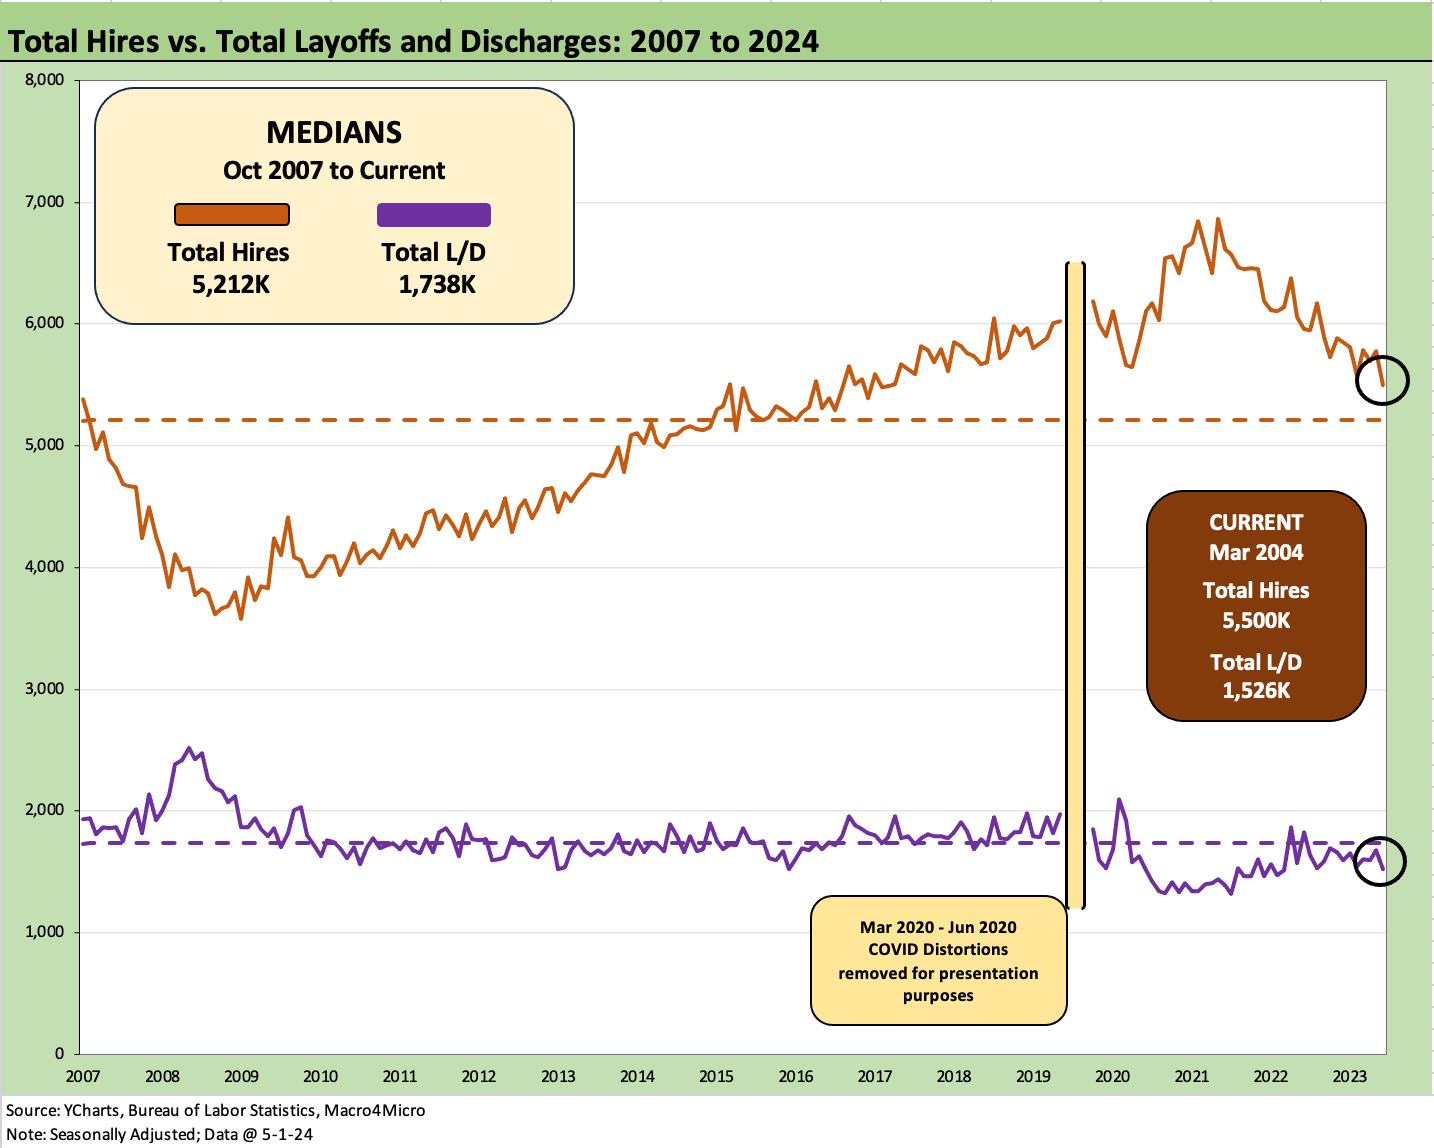
The above chart plots the Hires vs. Layoffs/Discharges since 2007. We remove the COVID period to avoid blowing up the chart visuals. We detail the COVID peak employment disruptions further below. As noted in an earlier chart, Hires remain at a meaningful multiple of Layoffs/Discharges with Hires of 5.5 million and Layoffs/Discharges of 1.5 million.
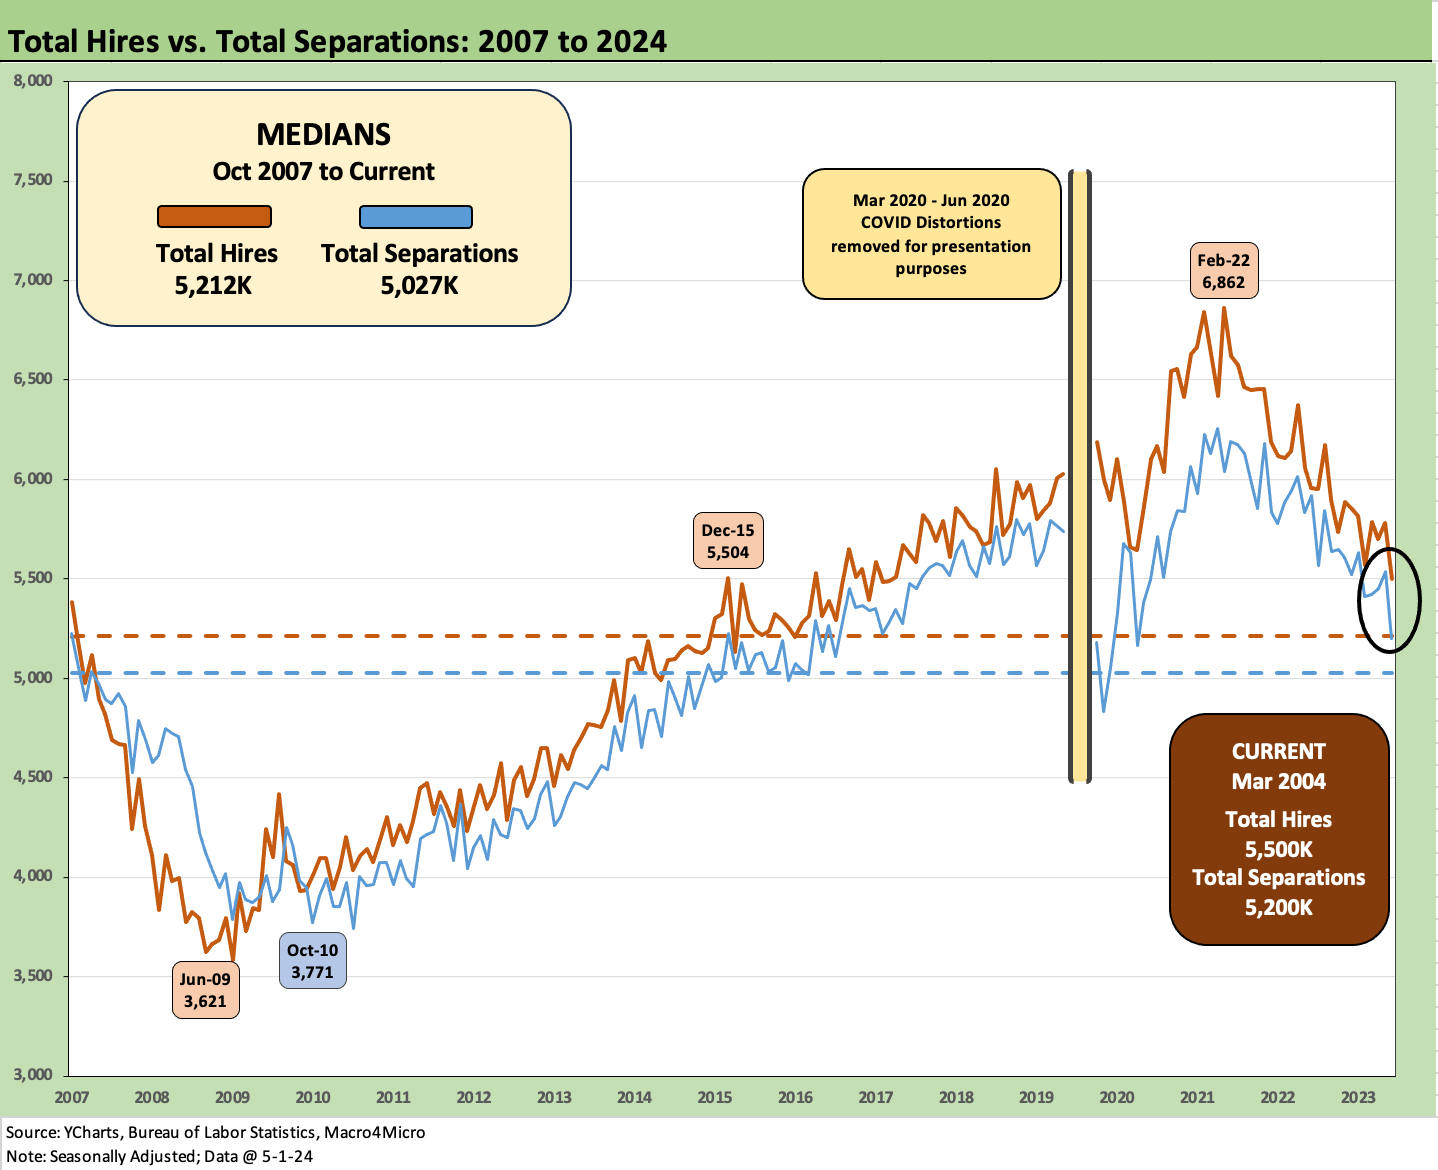
The above chart plots the Hires time series against Total Separations, which then brings Quits and “Other” into the picture. We look at Quits below, but the high rate of turnover in many services business lines and notably in less skilled, lower paying buckets are part of the monthly reality.

The above chart is a recurring replay in the JOLTS commentary that looks back at the dark days of COVID. The sheer scale of the swing is dramatic to say the least. The 16.3 million in Separations in March 2020 followed by 11.6 million in April 2020 is tough to match.

The above chart plots the Hires minus Separations differential. The current 300K for March is a sequential increase and higher than the long-term median of 195K. The 2009 recession differential of -764K offers a data point on how ugly it can get. The +822K in Feb 2022 shows a very strong month after some of the worst of the COVID distortions were behind the market in 2020-2021. Then came Russia/Ukraine and the oil spike and tightening cycle.

The above chart updates Quits as a % Separations. The current mix of 64% is above the long-term median of 57.3%. The official “Quits Rate” (Quits as a % of Total Employment) ticked down to 2.1% from 2.2% on a SAAR basis. The theory on Quits is that it reflects relative confidence levels in finding a new job. It is safe to say confidence is “lower” but still above median. 3.3 million people quitting can translate into a lot of things, but it is not a layoff.
See also:
Employment Cost Index March 2024: Sticky is as Sticky Does 4-30-24
Footnotes & Flashbacks: State of Yields 4-28-24
Footnotes & Flashbacks: Asset Returns 4-28-24
PCE, Income, and Outlays: The Challenge of Constructive 4-26-24
1Q24 GDP: Too Much Drama 4-25-24
1Q24 GDP: Looking into the Investment Layers 4-25-24
Durable Goods: Back to Business as Usual? 4-24-24
Systemic Corporate and Consumer Debt Metrics: Z.1 Update 4-22-24