PCE, Income and Outlays: The Challenge of Constructive
We look at the modestly adverse March 2024 PCE and strong consumer spending patterns as economists start pitching “later, longer and fewer.”
“Jonathan. I got a call from Justice Alito. He has a friend who wants to reserve your services for 2025. His client wants to know if you offer volume discounts and take credit. He also mentioned the FOMC as part of a bulk package.”
“Later, longer, and fewer” sounds like China birth rate propaganda from the 1970s but is now being bandied about as the expected FOMC posture after a rough week for data-driven decision making on handicapping Fed easing.
The PCE release for March 2024 shows an uptick in PCE headline inflation, sideways for Core PCE and all that set against sustained strong personal consumption and another tick down in savings rates as the spending party continues.
Personal income in current dollars moved higher MoM from +0.3% in Feb to +0.5% in March while consumption is still running ahead at +0.8% as the consumer is not showing signs of spending fatigue with the savings rate ticking down to 3.2% in March from 3.6% in Feb and 4.1% in Jan.
The scary headline in the Wall Street Journal today about Trump’s plan for the Fed independence caps off a very weird week but also offers a reminder that the closer to the election we get the more intensive speculation will become on what policy choices (and battles) are lurking and how challenging it will be to price in forward risks.
Today the Wall Street Journal ran a feature story on a current plan by “Trump allies” to undermine Fed independence. The idea is that the White House could control Fed policy, use the US Treasury as a final check on Fed decisions, and fire Jerome Powell. On a day like this, predicting FOMC policy based on recent data seems somewhat trivial. Of course, that is speculation, and we have our day jobs under the status quo laws and regulatory framework.
Then again, listening to Alito and some of the splinter group of the Supreme Court yesterday underscores Trump could have an easy Plan B if Plan A (dictatorial control of the Fed) does not work. If Trump wins and statutes and legislation don’t allow the termination of Powell and direct White House control of the FOMC, he can always just have them shot. Problem solved with an assist to Alito and the extreme team. After all, it is an official act of economic stewardship by one of the great economic thinkers of our time, DJT PhD (that’s right, the guy who thinks “seller pays” in tariffs).
The flavor is Putinesque at best, but that may be the game plan. Easier to create oligarchs and maybe get the dumbo twins in the oligarch training program. Gut the foreign policy establishment and financial bureaucracy and then deal directly with dictators (personal globalism with an asterisk) and direct wealth to the home team. Old school Putin (and Mobutu, Marcos, Suharto, etc.). In other words, “this ain’t new.” See Professor Ruth Ben-Ghiat’s Substack newsletter “Lucid” for the playbook on a great tradition across the ages of self-dealing corruption and the economically destructive habits of autocrats.
Meanwhile, back in the functioning free market US economy that is the greatest and most innovative in the world…
The above chart updates the run rate on PCE vs. Core PCE as March goes into the negative trend column for easing prospects. It would have been negative even if just on the lack of progress in Core PCE, but Core PCE went sideways at 2.8%. Headline PCE was worse at 2.7% vs. 2.5%.
We always like the chart above from the “1997 to current” timeline since it underscores how PCE can get under 2.0% as the Fed target of choice. Of course, the counter to that view is that all you need is a tech bubble bursting, a housing bubble implosion that crushes the souls of consumers and contracted credit, a systemic bank crisis, an oil price collapse, and a pandemic. Those might be viewed as anomalous in prudent econometric modeling. However, that helped get PCE under 2.0%.
The above chart uses the longer-term timeline and includes the raging inflation and stagflation periods of the 1970s and early 1980s. The median PCE here is +2.6% and core PCE at +2.4%. We include a memory jogger box for some major events across the timeline. Deflation in 2009 stands out in the time series. Since the current inflation fighting period is really the first since Volcker, this timeline strikes us as more relevant. In other words, getting to 2.0% PCE (Headline or Core) needs to skip the most relevant period to today’s challenge.
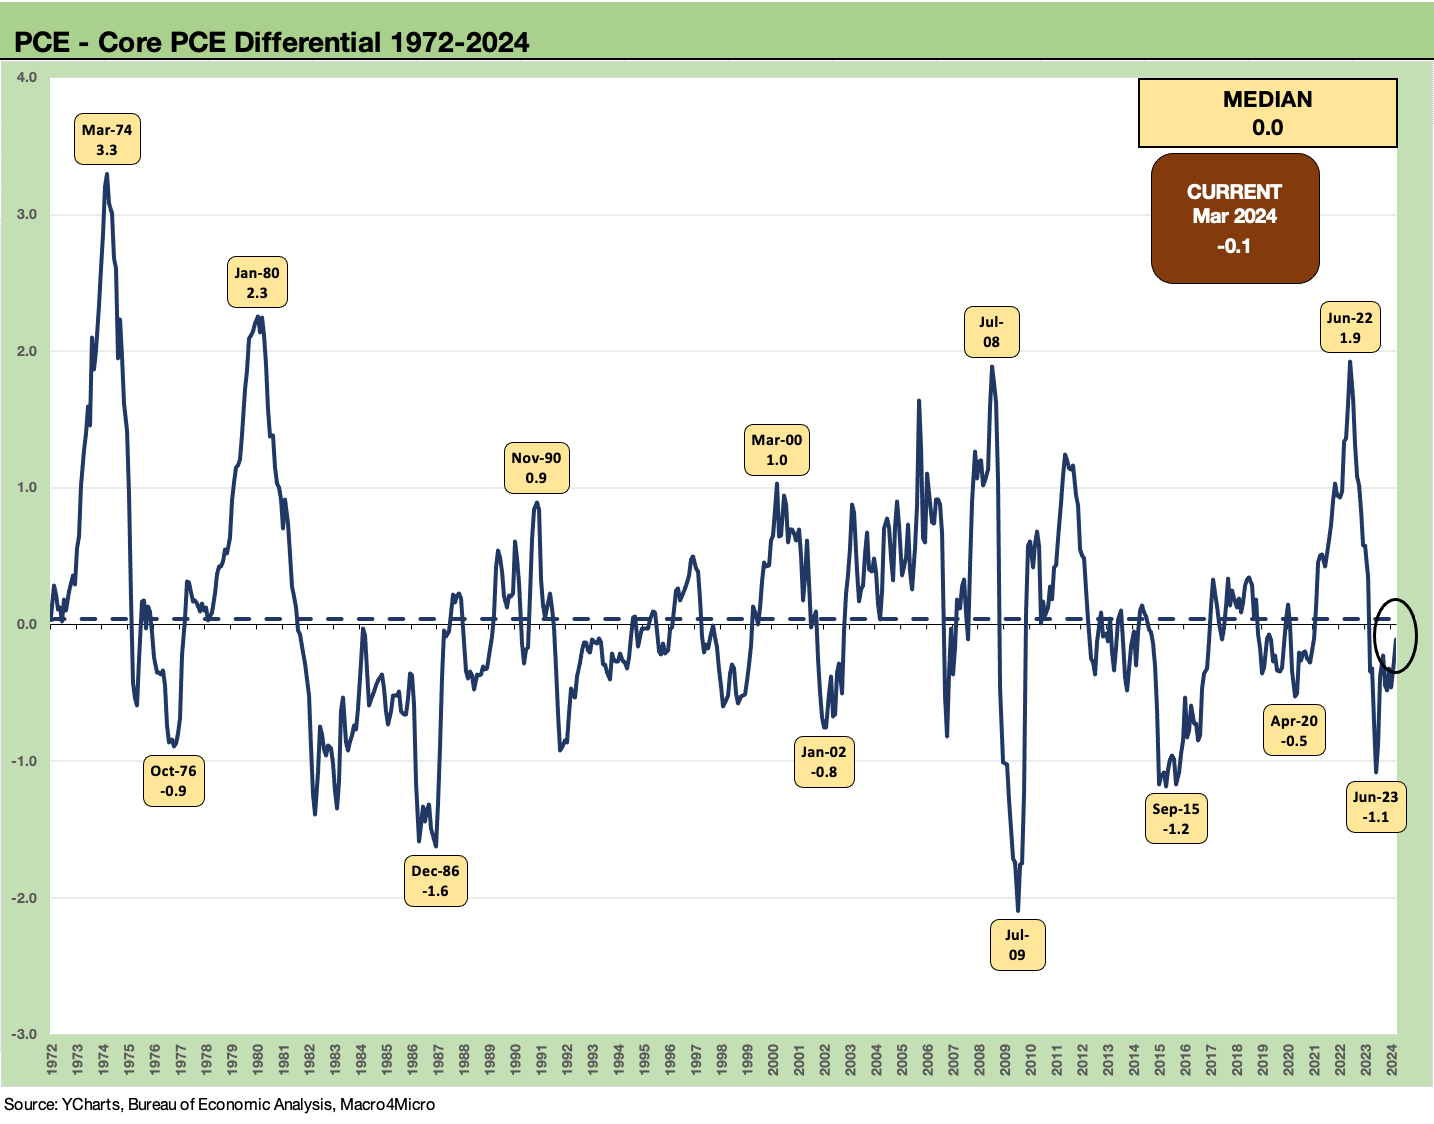
The above chart plots the long-term differential between headline PCE and Core PCE as a frame of reference. Oil obviously whips around a lot more than other line items and will go through bouts of stark inflation and deflation.
As we have covered in the past, it is very rare to see food inflation turn negative (see Inflation Timelines: Cyclical Histories, Key CPI Buckets 11-20-23). That means the food menu is sticky on the downside for food inflation. That makes food inflation all the more lasting and painful for consumers (and politically dangerous for incumbents as Ford and Carter both found out).
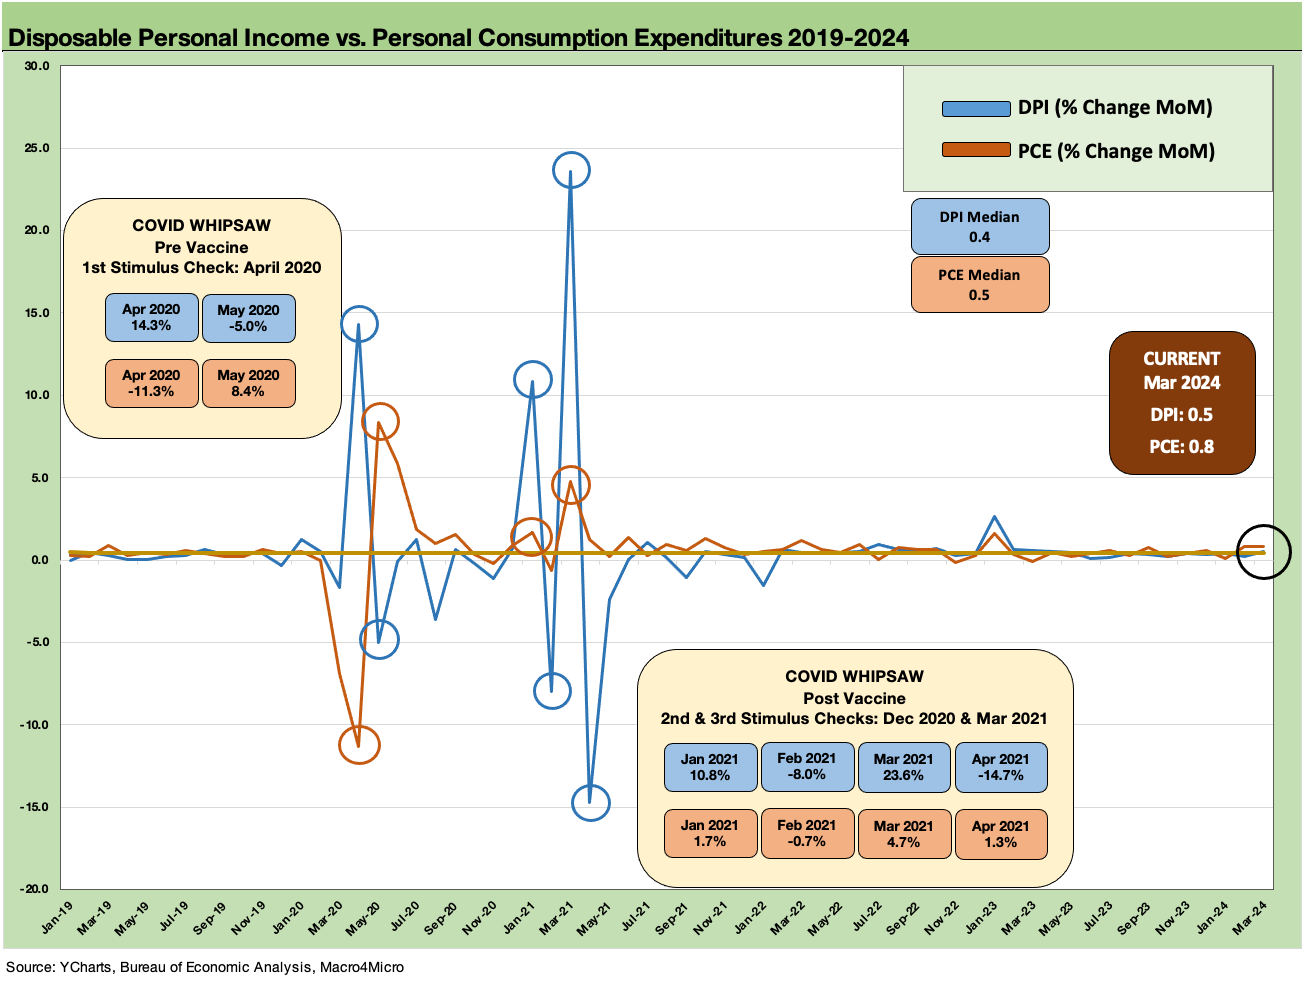
The above chart updates the MoM% change for Personal Consumption Expenditure vs. Disposable Personal Income. This month saw income growth rise to +0.5% from +0.3% but consumption still outpaced income growth at +0.8% for the second month in a row. The short story is that consumers keep spending more and saving less. That is confidence or recklessness. The consumer credit quality watch thus rises on the list of priorities ahead.
For YoY stats, the real DPI was up by +1.4% in March with real PCE up by +3.1%. Real Goods consumption was up by +3.5% (Durable Goods +4.3%, Nondurables +3.0%). Real Services PCE was +2.8%. The PCE is well ahead of DPI, and that means lower savings rates.
The above chart is one we have documented and detailed in the past (see Inflation Rorschach Test: Looking at Relief and Stimulus 2-7-23). The attempts of Washington to stimulate demand both under Trump and Biden in 2020 and 2021 will be ammo for debates (even if debates from a distance) in an election year. Stimulating demand at the household level (the Democrats priority) or business level (the GOP stimulus priority) was going to drive inflation higher either way with supplier chains in COVID chaos.
Demand spikes in the face of dislocated supply-demand imbalances (light supply) lead to price increases. That was (and remains) a fact. That said, the DPI vs. PCE relationship MoM quickly normalized after the stimulus. The employment and GDP boom of 2021 will be a topic. We are just wondering which voters will put up their hands and say, “I retroactively volunteer to be unemployed, have less money to spend in 2020-2021, and cause my FICO score to plunge.”
The above chart shows the running DPI vs. PCE changes by month. The market right now is seeing a stretch of very healthy PCE but also positive DPI. That does not signal an easy journey in the inflation last mile.
The above chart updates the running savings rates (see Savings Rates: Context Across the Cycles 10-27-23). The current 3.2% is well below the long-term median of 7.0% and closer to the mad consumer spending levels of 2005. We are also below the good times of 1987 when savings rates hit +4.1% (April 1987) when excess was easy to find in markets as nominal GDP doubled across the 1980s and Reaganomics were rolling. That was also the year the stock market crashed (Oct 1987). That cycle had legs and finally stumbled in 1989 (see Credit Markets Across the Decades 4-8-24).
See also:
1Q24 GDP: Looking into the Investment Layers 4-25-24
1Q24 GDP: Too Much Drama 4-25-24
Durable Goods: Back to Business as Usual? 4-24-24
Systemic Corporate and Consumer Debt Metrics: Z.1 Update 4-22-24
New Home Sales March 2024: Seasonal Tides Favorable 4-23-24
Existing Home Sales March 2024: Not Something Old, Something New 4-18-24
Housing Starts March 2024: The Slow Roll and Ratchet 4-16-24
Industrial Production: A Healthy Sideways 4-16-24
Retail Sales March 2024: Until You Drop 4-15-24
Consumer Sentiment: Do You Think Scary Thoughts? 4-12-24
CPI March 2024: The Steeplechase Effect 4-10-24
Credit Markets Across the Decades 4-8-24
Credit Cycles: Historical Lightning Round 4-8-24
Inflation Timelines: Cyclical Histories, Key CPI Buckets 11-20-23


Disposable personal income less personal consumption is the main event (Table 1 of release) I don't see any attempt to capture anything beyond "receipts" like interest income and dividends, so the idea is that there could be a lot "off the BEA books" like home equity gains etc. That would be a separate analysis. Same on unrealized gains. I would assume not too many of those with bitcoin want their details recorded anyway!
Then again, we have seen what happens when folks borrow against unrealized gains with leverage (TMT margin calls). And the same on 125% LTV loans (Housing bubble). Seems like the BEA definitions understates wealth effect of true savings but tries to capture what you have before borrowing against assets. There is disposable income to save or spend. Then there are sources of liquidity for disposal or leverage in the next leg of analysis. There is a lot of home equity out there! We looked at that in our Z.1 update on systemic debt.
Can I ask if the definition of savings maybe is out of date...does it include things like bitcoin which currently is worth many billions of dollars and of course while my bank balances are stable my home county says my house is worth tons more and even my used car recently was worth more than I apid for it so even as the govt says savings is going down it seems like net worth is going up which gets folks giddy to spend spend spend Mortimer.