Footnotes & Flashbacks: Asset Returns 5-5-24
We look at a week of relative celebration for duration as Powell the Dove lightly flapped his wings before a below-consensus payroll fueled a risk rally.
Powell helps the market glide past some noisy releases…
After a stretch of hard times in risk pricing volatility and UST anxiety, the market saw a fresh round of FOMC optimism this week on Powell’s dovish tone and a strong but well-below consensus payroll number.
The positive vs. negative scoresheet for the 31 benchmarks and ETFs we track posted 26-5 this week with 3 of the 5 in the red being energy ETFs (XOP, XLE, AMLP).
UST curve relief from 2Y to 30Y sent the long duration 20+ Year UST ETF (TLT) into the #4 ranking for the week with the IG Corp ETF (LQD) and EM Sovereign ETF (EMB) joining the top quartile mix with such curve-sensitive ETFs as Utilities (XLU) posting a surprise #1 for the week with Regional Banks (KRE) at #3 and Real Estate (XLRE) at #7.
The above chart updates the running returns for the high-level debt and equity benchmarks we watch. The good news is that the 1-month trailing time horizon was not an all-negative shutout in debt this week with HY edging back into the positive zone on tighter spreads and a curve rally. Meanwhile, the equity mix still came up all negative for the past month.
The worst highlight for bond investors is that the trailing 1-year for UST is still in the red. The duration sensitive IG Corporate index is slightly in positive range for 1-year at a 2% handle. The hopes of the UST bulls have seen a rough 3 months at -1.6% for UST and -1.15% for IG bonds.
The above chart updates the 1500 series with the 1-month now back in all-negative range with the Energy sell-off. As we cover in the ETF time horizon returns below, the 3-month period has been very solid for most sectors and industry groups. The past year of course remains a home run with returns well in excess of long term equity returns and better than the running average of the 1980s/1990s for most.
The rolling return visual
In the next section we get into the details of the 31 ETFs and benchmarks for trailing periods. Below we offer a condensed 4-chart view for an easy visual before we break out each time period in the commentary further below. This is a useful exercise we like to do each week for signals across industry groups and asset classes.
The above chart visually highlights the ebb and flow and UST-driven volatility of the past 1-week and 1-month time horizon. The 3-month and 1-year is a reminder that this has been a bullish stretch for equities despite the marginal periods overall for bonds.
The Magnificent 7 heavy ETFs…
Some of the benchmarks and industry ETFs we include evidence issuer concentration elements that leave them wagged by a few names. When looking across some of the bellwether industry/subsector ETFs in the rankings, it is good to keep in mind which narrow ETFs (vs. broad market benchmarks) get wagged more by the “Magnificent 7” including Consumer Discretionary (XLY) with Amazon and Tesla, Tech (XLK) with Microsoft, Apple, and NVIDIA, and Communications Services (XLC) with Alphabet and Meta.
We add the above chart so we can see each week which of the headline mega-names might have wagged certain ETFs or the broader capitalization-weighted benchmarks. Basically, we got tired of looking for outliers each week as we reconciled variances. A table of the big tech names from the Mag 7 to the broader collection of “headline types” helps.
The Mag 7 wrapped the reporting season this past week with Apple and Amazon weighing in, so those two did not offer negative surprises to take the market’s attention off the FOMC and payroll fixation. Apple threw in the largest buyback plan in history ($110 billion) to add some excitement.
We line the above group of equities up in descending order of returns for the week. While we include the tech top-down vantage point with NASDAQ and the NASDAQ 100 Equal Weighted ETF (QQEW), we also include the broad market with the S&P 500 and the S&P 500 Equal Weighted ETF (RSP).
Taiwan Semiconductor (TSM) will only be more relevant to macro topics as we move further in a noisy election year with a lot of geopolitics and tough trade talk. As we look back across the various time horizons detailed, there are some dazzling numbers to keep in mind. Just looking at them tells a story of what could in theory go wrong if the market does a year 2000 style shift.
The above chart frames the weekly returns with this week’s 26-5 matching last week on the positive vs. negative scoresheet. That comes after the prior two weeks had rung up 8-23 after a 1-30 across a turbulent 4 weeks.
A solid, favorable earnings season has been running some interference with the UST and FOMC anxiety that had been getting worse with some very constructive economic releases (see links at bottom). The quarterly Employment Cost Index seemed to rattle the market more than the broader collection of monthly indicators since it contained quite a bit of wage data running well above inflation during 1Q24 (see Employment Cost Index March 2024: Sticky is as Sticky Does 4-30-24).
As we look at the winners above for the week, we see all 6 bond ETFs in positive territory with the long duration 20+ Year UST ETF (TLT) grabbing a rare spot in the Top 5 at #4 behind Regional Banks (KRE) at #3, EM Equities (VWO) at #2 and Utilities (XLU) in an unusual #1 spot. EM Equities has a bigger list of variables driving that story, but the UST shows up on the short list of key drivers for all those ETFs in the upper ranks of the leaderboard.
The bottom of the list for the week shows 3 of the 5 in energy sector with E&P (XOP) in last and Energy (XLE) in second to last, and Midstream (AMLP) 4 off the bottom. For Energy, oil prices dipped into the high $70 range with WTI closing out the week near $78. That helps the CPI index mix and PPI exposure somewhat, but predicting oil prices looking out a year has been a thankless mug’s game since the early 1980s.
The EIA also announced that 2023 ended the year at a record 12.93 mn barrels per day vs. the previous record of 12.31 mn bpd in 2019. That would be an interesting debating point in a Trump vs. Biden matchup to see how they handle the energy independence topic. It would be interesting to see if they try to define energy independence. Facts are facts, except when they are not with this crowd. Or when a politician’s lips are moving. Throw in a concept or two and you could see a meltdown unfold.
While there is plenty to complain about in Biden’s energy policies from many constituencies, it is hard to get some of the energy critics to admit that simple fact of record oil production and very low natural gas prices. They still can complain, but they have to explain their issues more clearly (there are plenty) without pretending certain facts do not exist. The reality is that it is easier to just lie. Otherwise, the facts create static in your theme music. The times we live in…
The above chart frames the 1-month time horizon, and we see a 7-24 score or slightly worse than the 8-23 last week as the 4-week mix shifts. The UST curve has weighed on many sectors with 5 of 6 bond ETFs in the red, but HY ETF (HYG) is positive on lower duration exposure, higher coupons, and solid spread compression as it edged into positive returns and made the top quartile for the month.
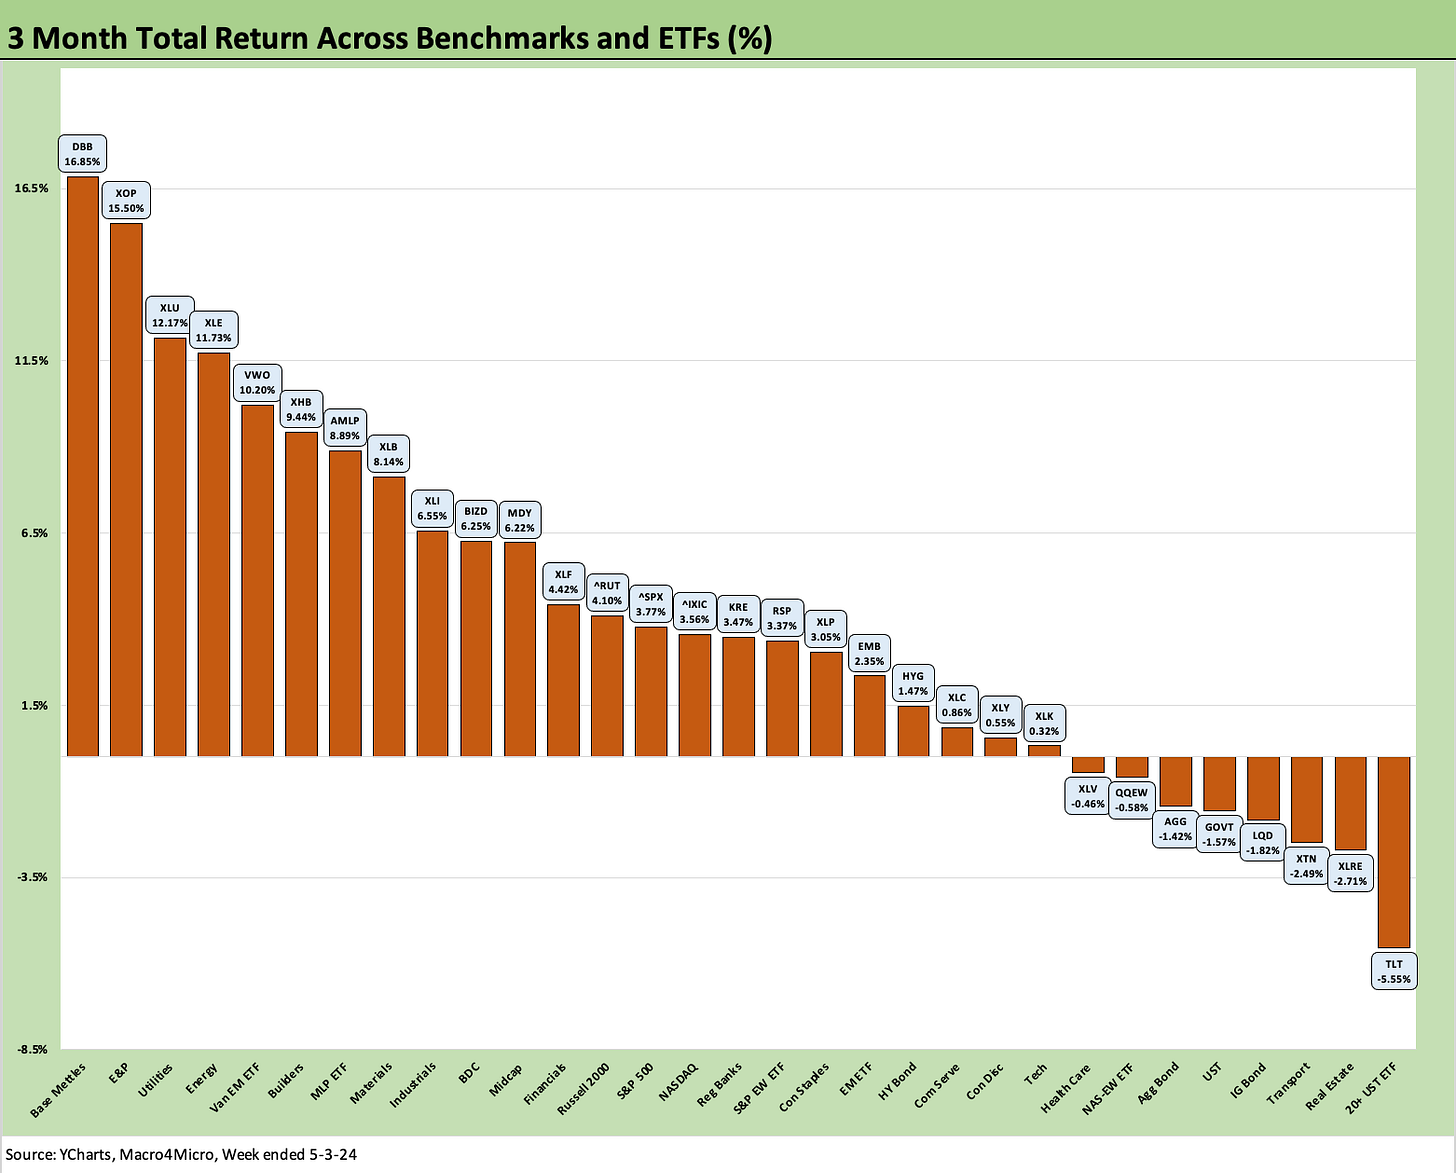
We see Base Metals (DBB) staying strong at #1 again for this week’s trailing 1-month returns, but the E&P ETF dropped from #2 in last week’s 1-month rankings to last place this week (if anyone needed a reminder of the volatility of XOP and to a lesser extent XLE).
Some interest rate sensitive sectors were still rewarded in the 1-month rankings with Utilities (XLU), Regional Banks (KRE), and the BDC ETF (BIZD) performing well on the combination of sticky rates at the front end and a favorable mix of credit fundamentals helping bolster confidence in the credit cycle. We see the HY index spread at +308 bps this week or below such periods as Oct 2018 and June 2014. That view of the default risk cycle and credit quality trends is keeping both BIZD and HYG in the upper ranks this month.
The lower end of the 1-month rankings includes some earlier highfliers such as Builders (XHB) and Communications Services (XLC). The past month certainly saw some major swings from the first two weeks to the following two weeks.
The 3-month positive vs. negative score moved little this month at 23-8 vs. last week’s 22-9. We see commodities and cyclicals still leading the way with Base Metals (DBB) on top followed closely by E&P (XOP) with Energy (XLE), and Midstream (AMLP) in the top quartile. The Builder ETF (XHB) and Materials ETF (XLB) are in the upper ranks with Utilities (XLU) a bit harder to explain within the relative mix of being defensive or interest rate sensitive in recent periods.
The 3-month time horizon is still on the uglier side for bonds with the UST shifts still weighing against the mix over that period with the long duration UST ETF (TLT) sitting in last place and 4 of the 6 bond ETFs in the negative zone (TLT, LQD, GOVT, AGG). We see both the HY ETF (HYG) in positive range in the third quartile just behind EM Sovereign (EMB). We see XLRE in second to last on the UST curve concerns and the recurring question marks around some real estate subsectors (notably Offices).
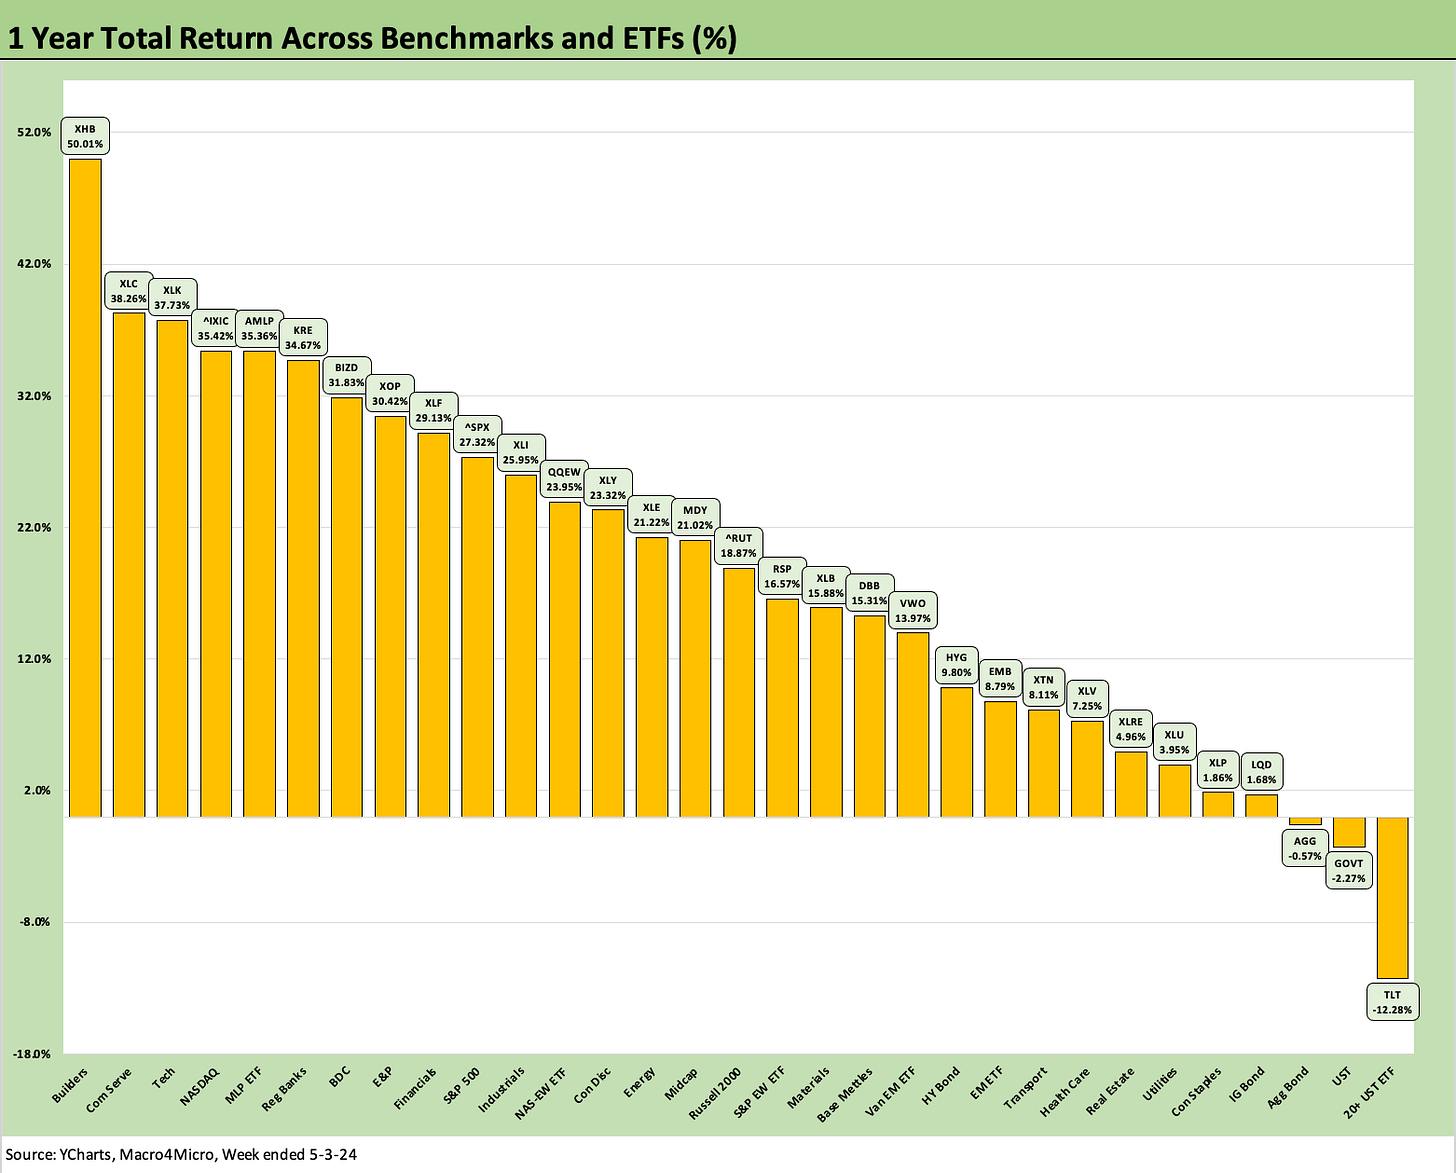
The 1-year time horizon is very much like last week with the same score at 28-3 and the only 3 in the negative zone being 3 bond ETFs with TLT on the bottom by far with GOVT and AGG holding down the other two negatives. We see two bond ETFs make it into the third quartile with EMB and HYG posting up high single digit total returns despite the UST curve.
The Top 5 are unchanged in order, but Regional Banks (KRE) has pulled up into the #6 spot this week edging ahead of the BDC ETF (BIZD). The LTM timeline for KRE is seeing the volatile March 2023 chaos and aftermath for the regionals fall a little further back from the measurement period.
See also:
April Payroll: Occupational Breakdown 5-3-24
Payroll April 2024: Market Dons the Rally Hat 5-3-24
JOLTS March 2024: Slower Lane, Not a Breakdown 5-1-24
Employment Cost Index March 2024: Sticky is as Sticky Does 4-30-24
Footnotes & Flashbacks: State of Yields 4-28-24
Footnotes & Flashbacks: Asset Returns 4-28-24
PCE, Income, and Outlays: The Challenge of Constructive 4-26-24
1Q24 GDP: Too Much Drama 4-25-24
1Q24 GDP: Looking into the Investment Layers 4-25-24
Durable Goods: Back to Business as Usual? 4-24-24
Systemic Corporate and Consumer Debt Metrics: Z.1 Update 4-22-24


