
Footnotes & Flashbacks: State of Yields 5-12-24
We detail last week’s very mild, adverse UST move and equity rally ahead of big CPI/PPI news. We add additional charts on credit and spread relationships.


To quote Stormy, “What could possibly go wrong?”
All the inflation releases are important lately, but this week brings CPI and PPI along with Retail Sales and Industrial Production after a very shaky consumer sentiment number on Friday (see Consumer Sentiment: Flesh Wound? 5-10-24).
The mixed picture for FOMC decisions has not deterred waves of new issue in IG with the current yield backdrop bringing in plenty of demand at current coupon rates.
We tweak our yield charts in IG and HY with this week’s Footnotes publication as we add some long term spread relationships and frame HY spreads vs. 5Y UST across a few cycles.

The above chart offers some historical context to what the UST curve today looks like in the context of past cycles. We do not use this chart often, but we decided to make it part of the weekly for new readers and as a reminder that rates today are very low as we look back across cycles, whether economic, monetary or credit. We are out of the ZIRP years, and this at least tells us, “rates are low” once you get past more than a decade of fallout from a systemic bank crisis and then the first deadly pandemic since 1918.
The chart shows the 5-10-24 UST curve on the bottom with other UST curves plotted along the noted timelines. The 1978 upward shift to the Volcker double dip years (see UST Moves 1978-1982: The Inflation and Stagflation Years 10-18-23) sets the bar at the high. We also see the 1989 tightening in the mix around when the 1980s period of excess started blowing up on the way to a summer 1990 recession (see UST Moves: 1988-1989 Credit cycle Swoon 10-21-23).
The 2000 and 2006 UST curves are closer to today’s UST realities and make for interesting comparisons given the TMT credit cycle peak of 1997 on the way into more extreme periods of market excess by 1999 when the default cycle kicked into gear. We also see 2006 as the start of the cracks in the mortgage markets on the way to the June 2007 spread lows that we look at in some of the charts further below.
Sitting at the bottom with the lowest rates across these cycle dates was the UST curve of this past Friday. The very strong origination of recent months in both IG and HY can be viewed in that context. Current coupons look attractive to investors after over 15 years of financial repression while many HY issuers have waited too long to get into gear on their liability management moves to refi and extend. Many liability managers may be shifting expectations on where the UST might be headed unless the catalyst to UST moves lower and damages spreads or even closes some windows.

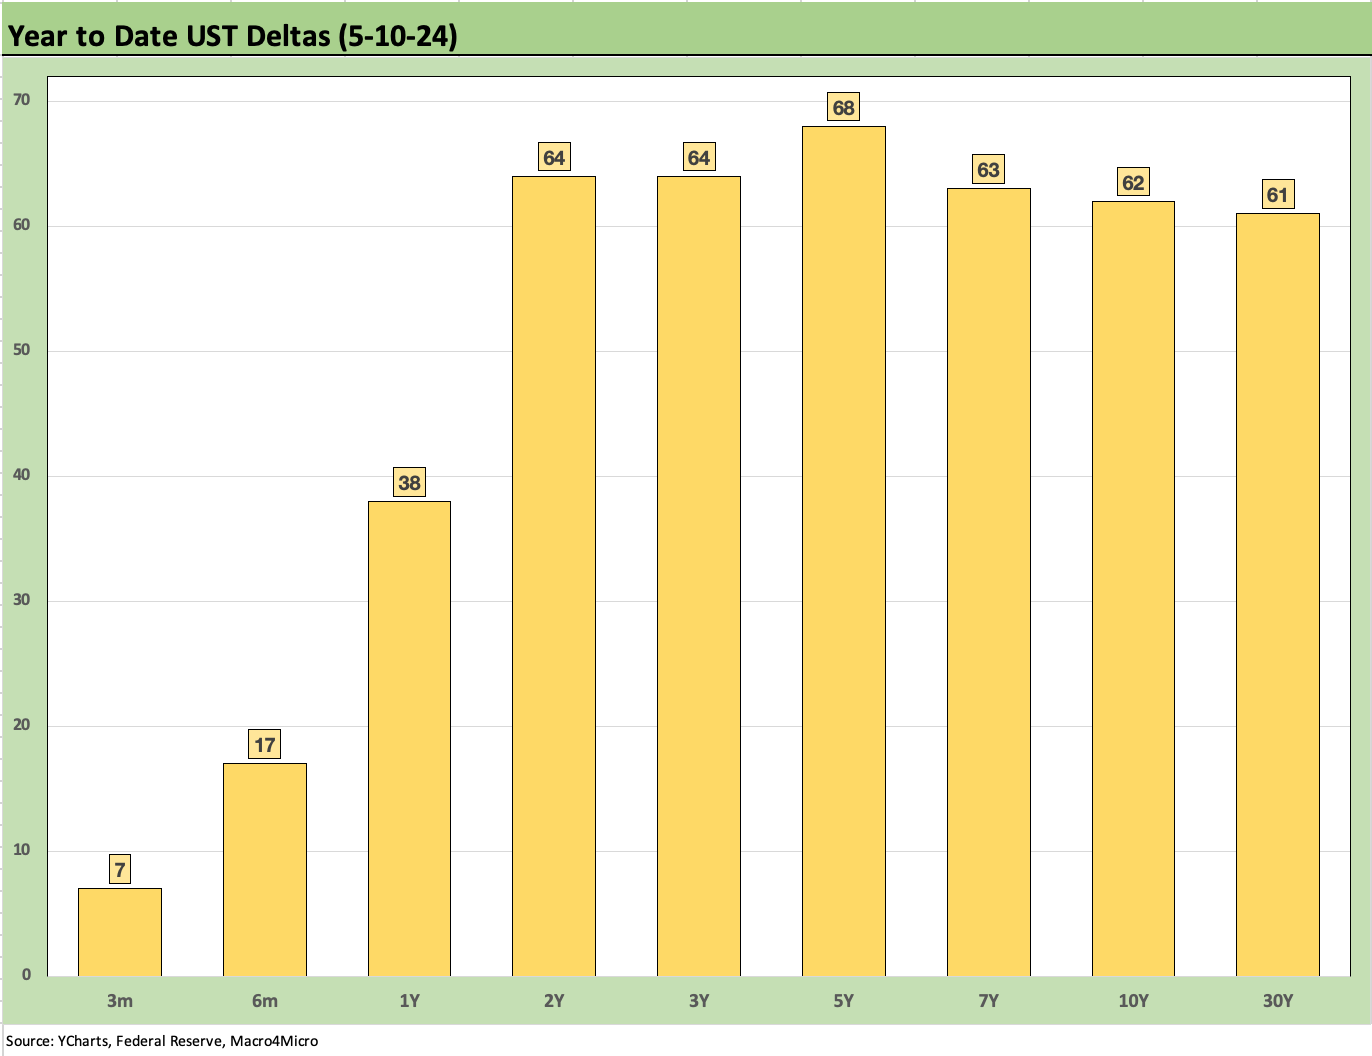
The above chart details the shift from the UST peak at 10-19-23 through Friday close with the UST deltas by maturity broken out in the box. We also detail the UST shift YTD through Friday close. We include the numerical deltas in the boxes and plot the actual yield curve.
The takeaway is that UST curve as of Friday is closer to the 10-19-23 highs (-48 bps tighter on 10Y UST) than it is to year end 2023 levels (+62 bps higher) as inflation metrics, job adds, PCE levels, a steady stream of constructive economic releases (with a few exceptions), and overall favorable earning seasons for 4Q23 and 1Q24 make life difficult for UST bulls.

The above chart follows the migration of the UST curve across some notable dates during the tightening cycle that officially began in mid-March 2022. We include a memory jogger box on the FOMC actions along the way.
The main takeaway on this chart remains the convergence of the UST curves of 12-31-22 and 12-31-23. Those two curves compress with one another further past 10Y despite 100 bps differential in fed funds with the upper limit of 5.5% at 12-31-23 higher than the 4.5% for 12-31-22. The data point indicates that an easing on the front end does not necessarily mean the 10Y UST needs to follow. Besides those two data points to make the point, there is the reality of record UST supply ahead in 2024 and 2025 based on US borrowing needs.

The weekly UST deltas are detailed above, and we see a slightly bearish move weighted more on the front-end. The 10Y to 30Y was flat to down slightly. We look at the mix of bond ETF returns in our separate Footnotes publications on Asset Returns we will publish later today. We see 4 of the 6 in very slight positive territory for the week at +0.3% on the high end of the mix for the long-duration 20+ UST ETF (TLT) while IG corporate index (LQD) and HY ETF (HYG) posted minimal negative returns for the week. It was a nonevent week for duration returns relative to some of the big swings we have seen across the weeks in the YTD period.

The yield curve UST deltas from the date of the 10Y UST peak (10-19-23) is updated above. The UST market has traveled a bullish distance since the duration pain that flowed into bond funds wrapped around Sept-Oct turmoil from macro releases. As detailed in the next chart, the Nov-Dec UST rally has given way to a bearish YTD backdrop where the long duration UST 20+ Year ETF (TLT) has generated a YTD 2024 return of -8.9%. CPI and PPI headlines will be interesting catalysts this week.
The YTD UST shift higher underscores the rough time duration has faced in 2024. The wide range from Oct to current times included that massive rally to close out 2023 in Nov-Dec. In contrast, 2024 has been a case of disappointing inflation data and bullish consumption numbers getting posted up in the PCE and Retail sales releases that are among the most watched releases for consumer behavior (see links at bottom).
One of the themes running through the new issue markets is that many investors have given up on the bull UST shift. Many see 5% and 6% handle coupons on new issue IG as not a bad place to be with decent cash flow generation from IG bonds in the historical context since 2008.
IG allows investors to position for what could be a turbulent 2025 in geopolitics and domestic policy. Trade battles will loom large with all the intrinsic risk of retaliation and economic fallout. For example, we saw a lot more headlines over the past week on Biden plans for tariffs on China EV vehicles and products.
A slowdown or higher mix of macro setbacks might bring down the front end of the UST curve, but the intermediate to long end will remain a debate with so much refinancing needs and related supply pressures. Economic disruptions can intuitively be a threat to credit spreads, so that would factor into the IG vs. HY excess returns handicapping. We look at some of the credit compensation in other charts below.

The above chart frames the Freddie Mac 30Y mortgage from weekly Thursday pricing at 7.09%. This week at least posts a lower level from the 7.22% of the prior week. We also include the Freddie 30Y for 12-29-05 and 6-29-06 for some historical perspective from the housing bubble years. We use 2005 as the peak homebuilding year (2005) and mid-2006 as RMBS excess was starting to sound alarms.
We include 3 UST curves from these 3 dates for comparison. The past week’s UST 10Y UST close is above the 2005 UST curve and below mid-2006, but current mortgage rates are the highest of the 3 periods with mortgage spreads remaining wider even at lower volumes than what was seen in mortgage activity during the housing bubble peak. The mid-2006 level at around 6.8% is closest to current mortgage levels.
The challenge today is record home prices and high monthly payments. It is a very unfriendly market for rates but one which benefits from very high demand on favorable demographics. That does not change much week to week as we cover in our housing market research on new and existing home sales and starts as well as in our single name work.

The above chart updates the running yields for the IG index and HY index (ICE) across time. With ZIRP now behind the market, we view the pre-crisis medians as the most relevant frame of reference going forward, and that means the 9.3% HY median and 6.1% median for IG. As we cover below, spreads are extremely tight in both IG and HY, and that highlights the relevance of the pre-crisis medians above.
When we look at long term medians from 1997 to 2024 for IG above (4.7%) and HY (8.0%), that median includes many years of ZIRP with some semi-normalization periods after ZIRP. As a reminder, ZIRP came with the crisis after Lehman and AIG and ended in Dec 2015 before ZIRP returned with COVID in March 2020. We look at the HY and IG index and UST comps in the following charts.
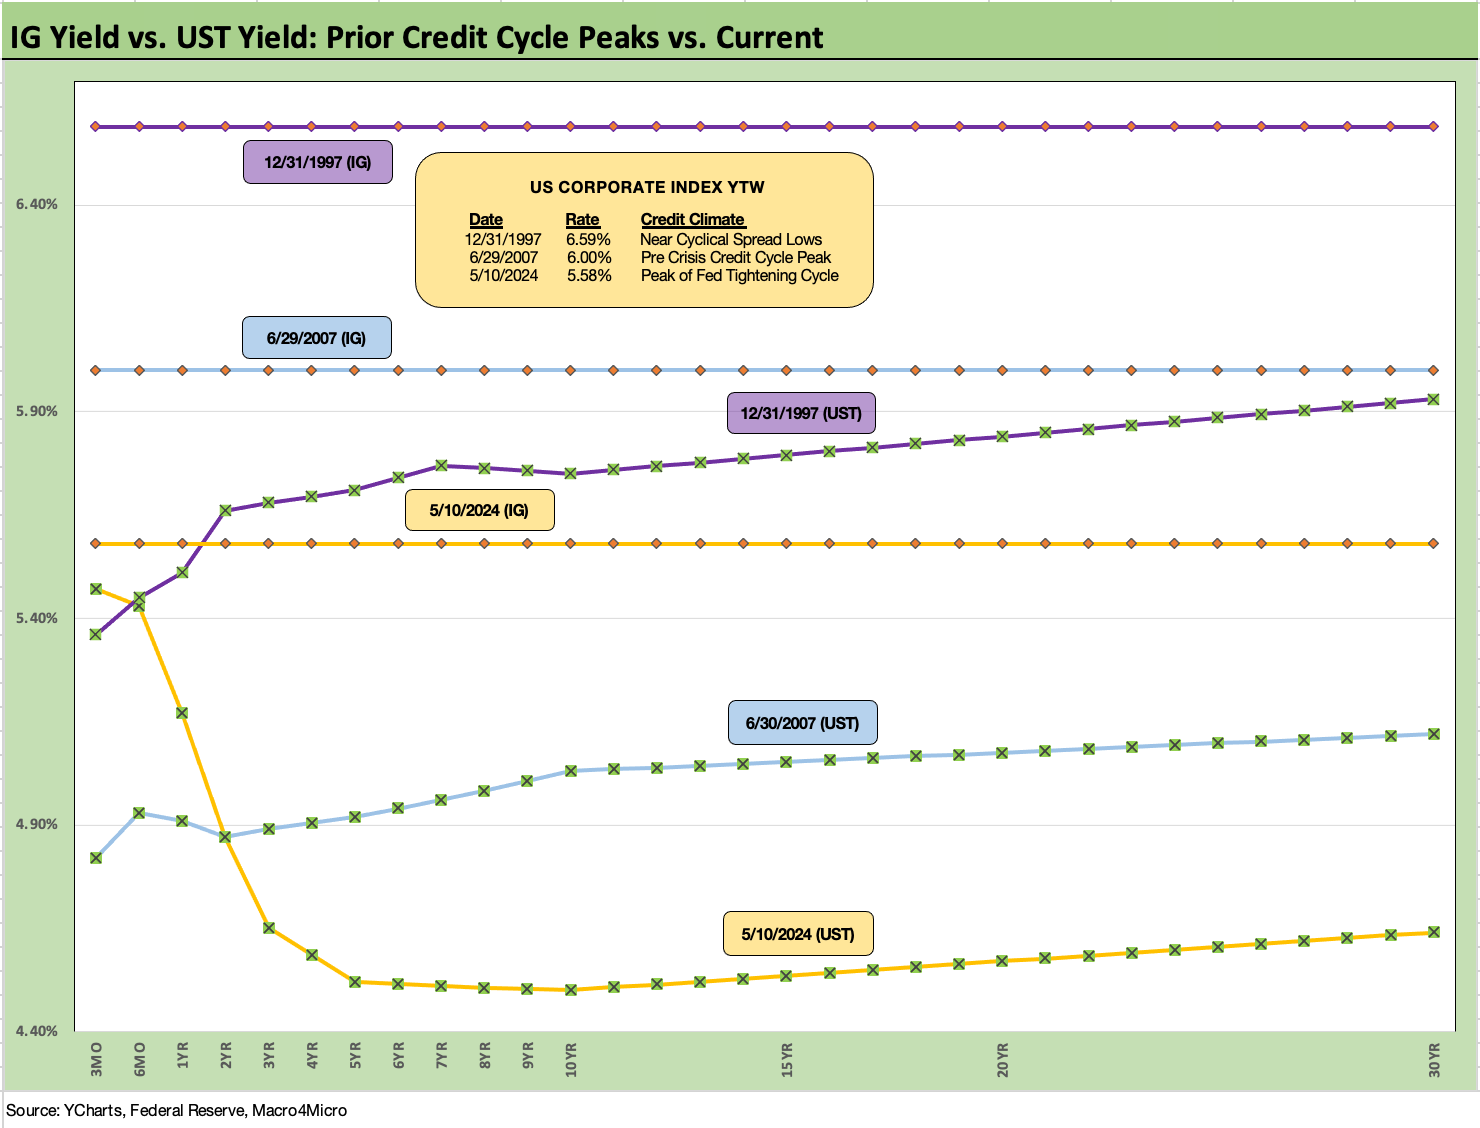
The above chart also uses some historical comps for the IG corporate market in similar fashion to what we did with 30Y mortgages. In this case, we frame the UST curves to end last week vs. the credit peaks of late 1997 and mid-2007. We see the current UST curve from 5Y to 30Y is much lower than in those earlier cyclical peaks. The inversion from 3M UST is a material differential from those earlier credit cycle peaks. With tight IG spreads today, the IG Corporate index is accordingly meaningfully lower, ending the week at 5.58% with an IG index OAS of +89 bps.

The above chart shows a long-term history for IG corporate spreads across time from 1997. We post some of the lower points along the way, but the all-time low is still +53 bps in Oct 1997 before edging out to +70 bps to end 1997. The 1997-1998 period saw a protracted period in the +90 bps handle range averaging +95 bps for 1997-1998. We saw a lengthy stay in low spreads from 1H04 to 1H07 with an average of +95 bps. 1H07 was the peak of that credit cycle when IG OAS averaged +86 bps.
We see low points in spreads at along the way such as 1997 but a very long and low stretch from 2004 to mid-2007. The 2014 and 2018 lows came with more volatility than 2004 to mid-2007 while 2021 was a risk-on ZIRP party after COVID. The summer of 2014 was an initial cyclical low for HY spreads, but the Saudi oil price war soon followed and sent a wide swath of BBB tier names into widening mode.
Those data points offer a reminder that IG spreads can hang tough for long stretches in the absence of a macro shock. A major trade war with China would be a macro shock while a fresh round of “Capitol sacking” by inbred “patriots” might be “in the model” and thus not a surprise event (the defecation, Auschwitz T Shirt, and noose were patriotic touches representative of that type and their lynching heritage. Very Jeffersonian cerebral. See 2024 Must be a Year When Facts Matter: The Significance of Jan 6 1-6-24). This time the meathead convention would be greeted by a prepared defense. Other widespread civil unrest could be a mild shock.
On the other hand, a politically driven UST default could unravel risk pricing if the deep thinkers in Washington decided to put the economy’s head in the “patriot’s” noose. There is no defense to that level of stupidity. The tails on some of those scenarios are not as long (even if very fat) as they would have seemed a decade ago.
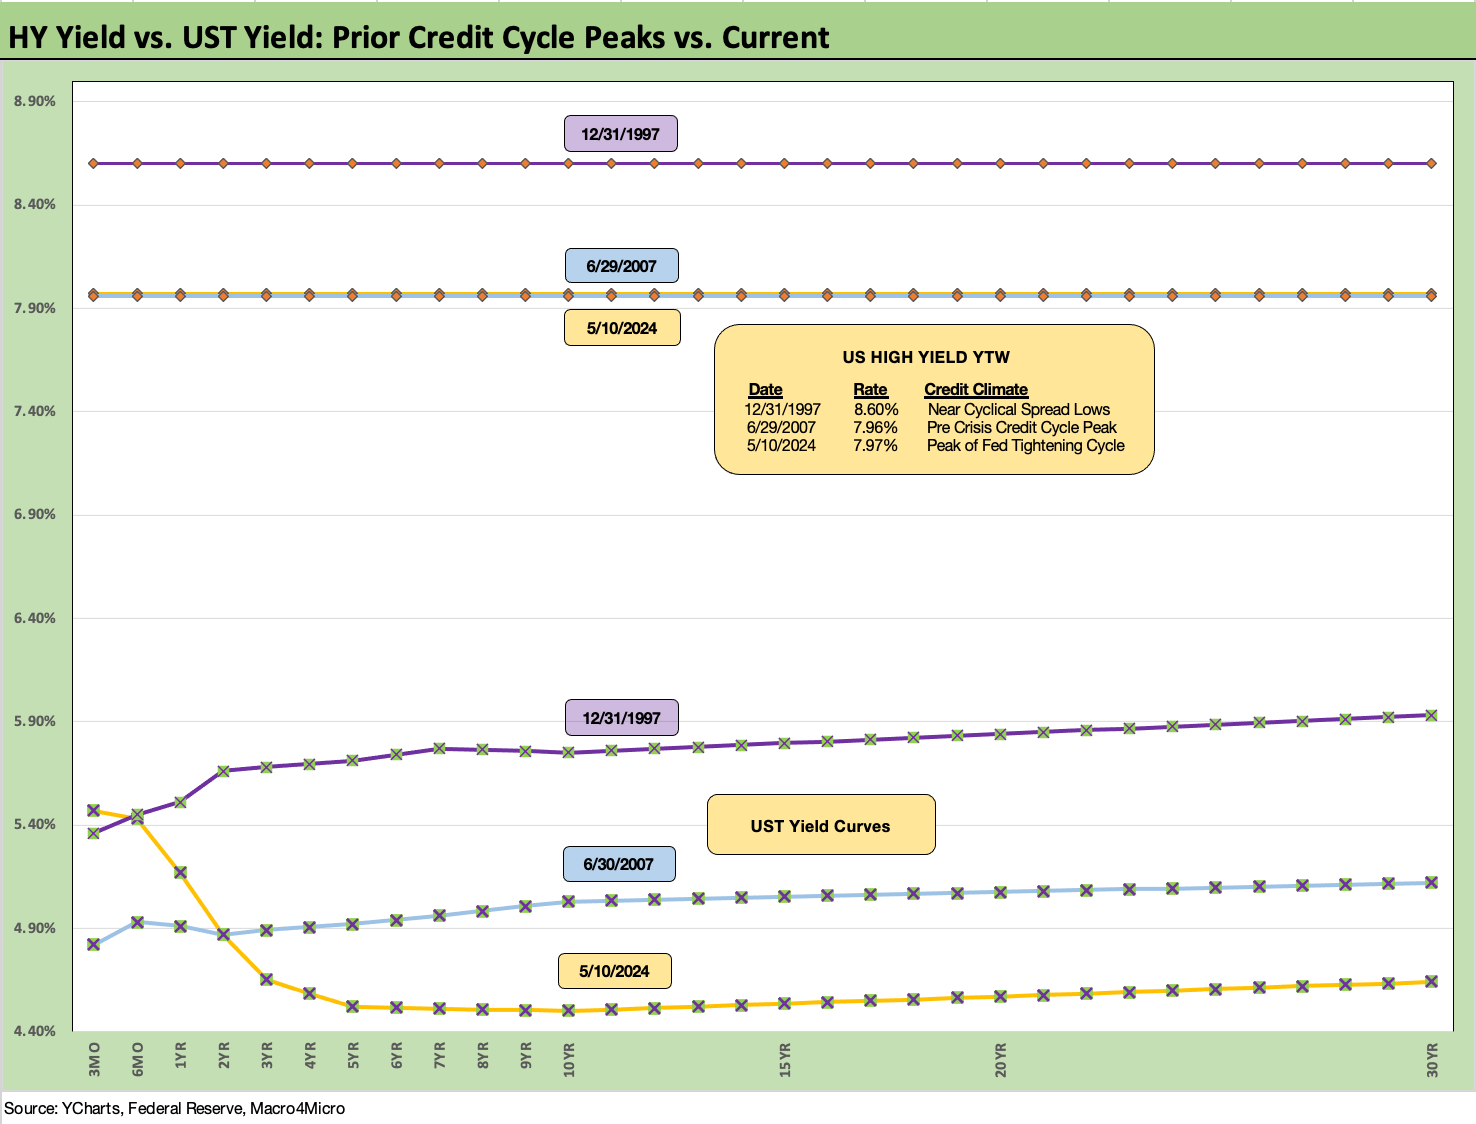
The above chart takes the same approach as with IG. We use the same dates for credit cycle peaks and plot UST curves for those dates and the end of last week. We also plot HY index YTW (ICE) along the horizontal lines. Right now, the all-in yields for last week and 2007 are in a dead heat with today’s UST curve lower but HY OAS much higher today than the June 2007 credit bubble lows. June 2007 saw sub-250 bps lows. We also saw sub-250 bps level in Oct 1997 before closing the year around +296 bps OAS.

The above chart captures the relative risk premium for HY vs. IG as measured by incremental OAS. The timeline is from 1997 from the “TMT cycle” spreads through this past week. The current incremental spread for HY above IG of +223 bps is well inside the long-term median of +330 bps. The current HY-IG spread is near the tight spread differentials seen in Dec 2021 (+203 bps), Oct 2018 (+205), and inside those posted in June 2014 (+228 bps).
We highlight the Oct 1997 month for a reason since that was a very compressed period for IG spreads but also a period of very aggressive deals getting done in the lower credit tiers as the TMT cycle was a case study in excess. LBO volumes were also kicking into high gear late in that credit cycle. The compensation for moving down the credit tiers was questionable as a relative value at only +187 bps in Oct 1997 before June 2007 trumped all the cycles at only +147 bps.
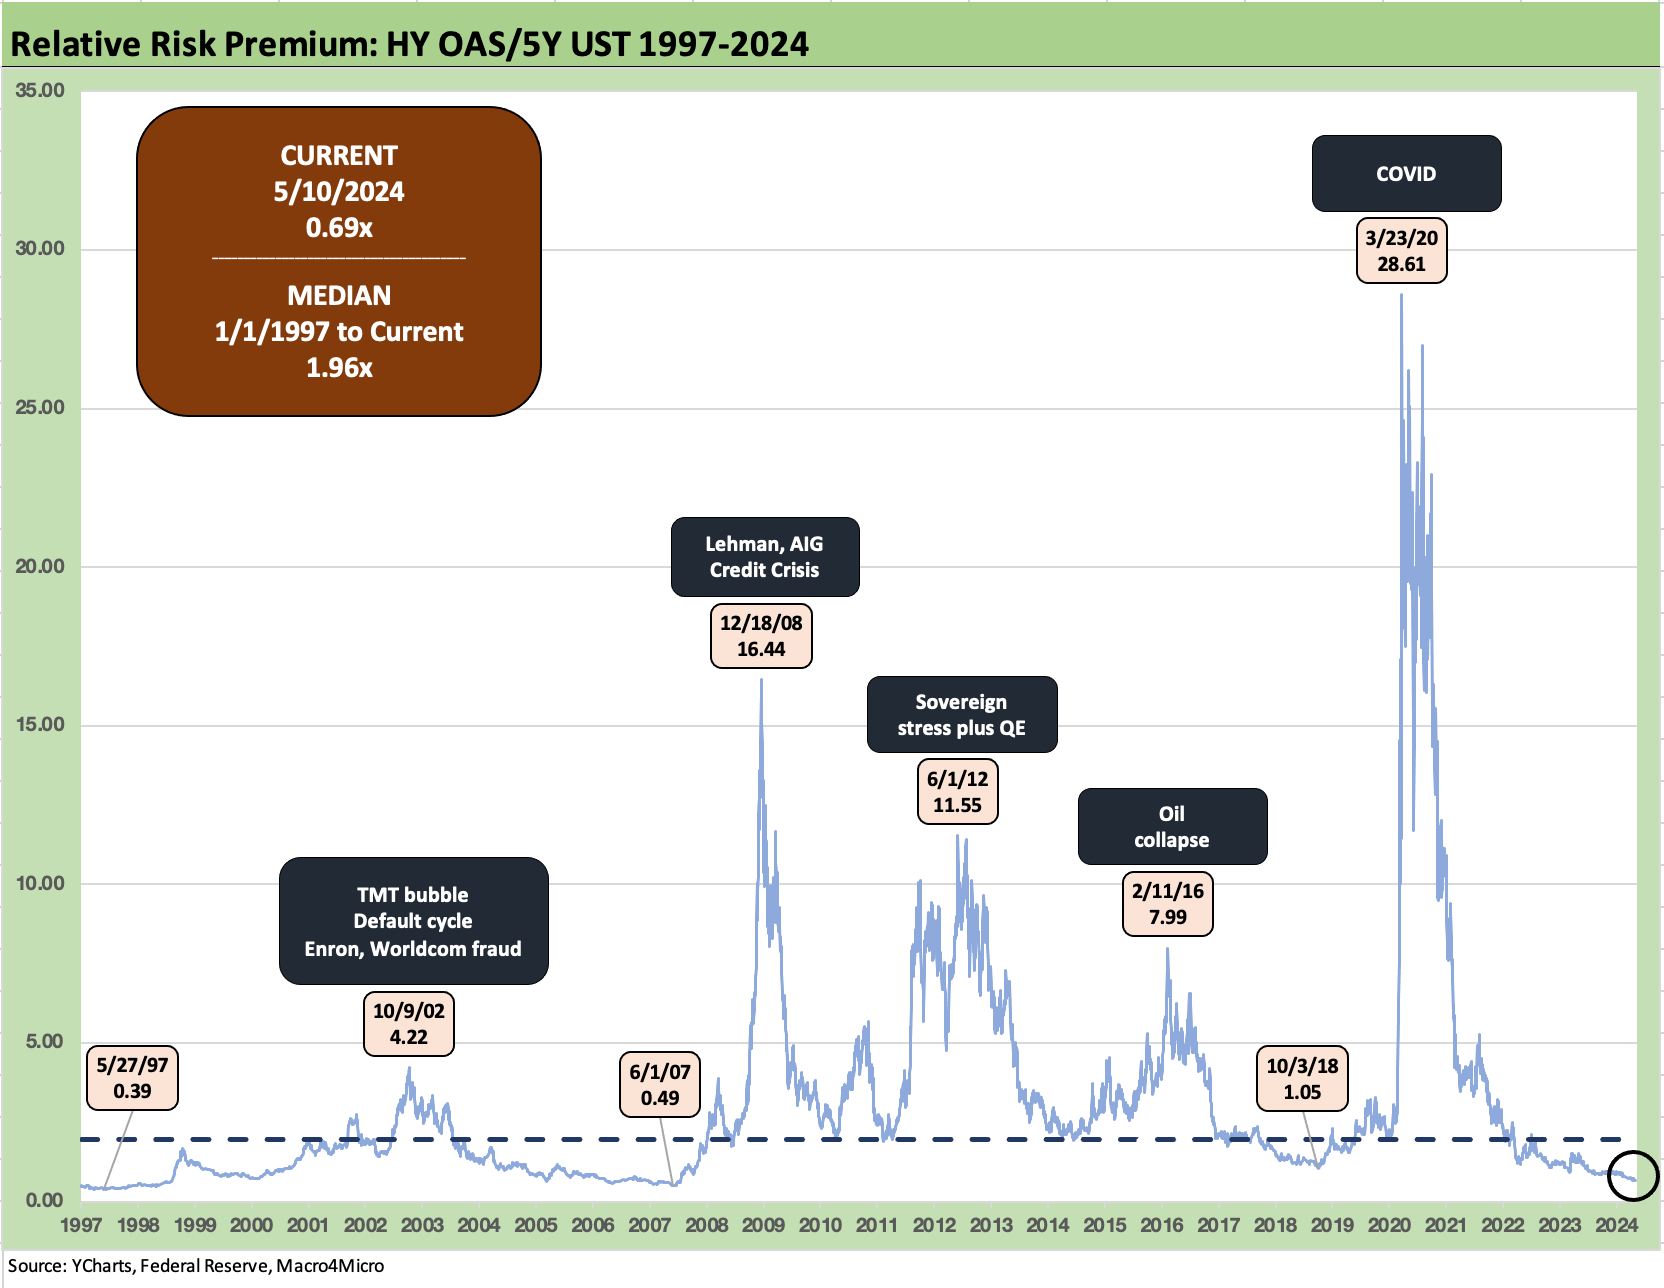
The above chart is one we have reviewed in past commentaries, but we thought it was worth adding to the weekly yield collection. The time series uses relative risk premiums as measured by the HY index OAS divided by the 5Y UST. We use a ratio rather than a % given the tendency of US HY to occasionally run off the charts to thousands of percent.
The recent ratio of 0.69x ranks among the lowest across the period with “lower lows” in the credit peaks of May 1997 and June 2007. The long-term median of 1.96x is a long way off. The pre-COVID cyclical low was just over 1.05x in Oct 2018 when HY posted the cyclical spread lows during that record long economic expansion.

We update the 3M to 5Y UST slope this week with the above chart plotting the long-term time series since 1984. The box also includes the various UST slopes we like to watch. Only the 5Y to 30Y is currently upward sloping with all a long way from their medians.
The 3M to 5Y UST inversion of -95 bps is well inside the May 2023 peak of -197 bps but is +206 bps below its long-term median of +111 bps since the start of 1984. Cash is a legitimate asset allocation bucket in a market this inverted for so long. Some sniff at cash as “not investing, it is just saving” given their own asset specific axes, but 5+% with no duration risk and a rapid ability to deploy out the curve gives room for many to be patient with so much uncertainty ahead across FOMC, inflation, and of course an election that promises to let scenario-spinning run amok.
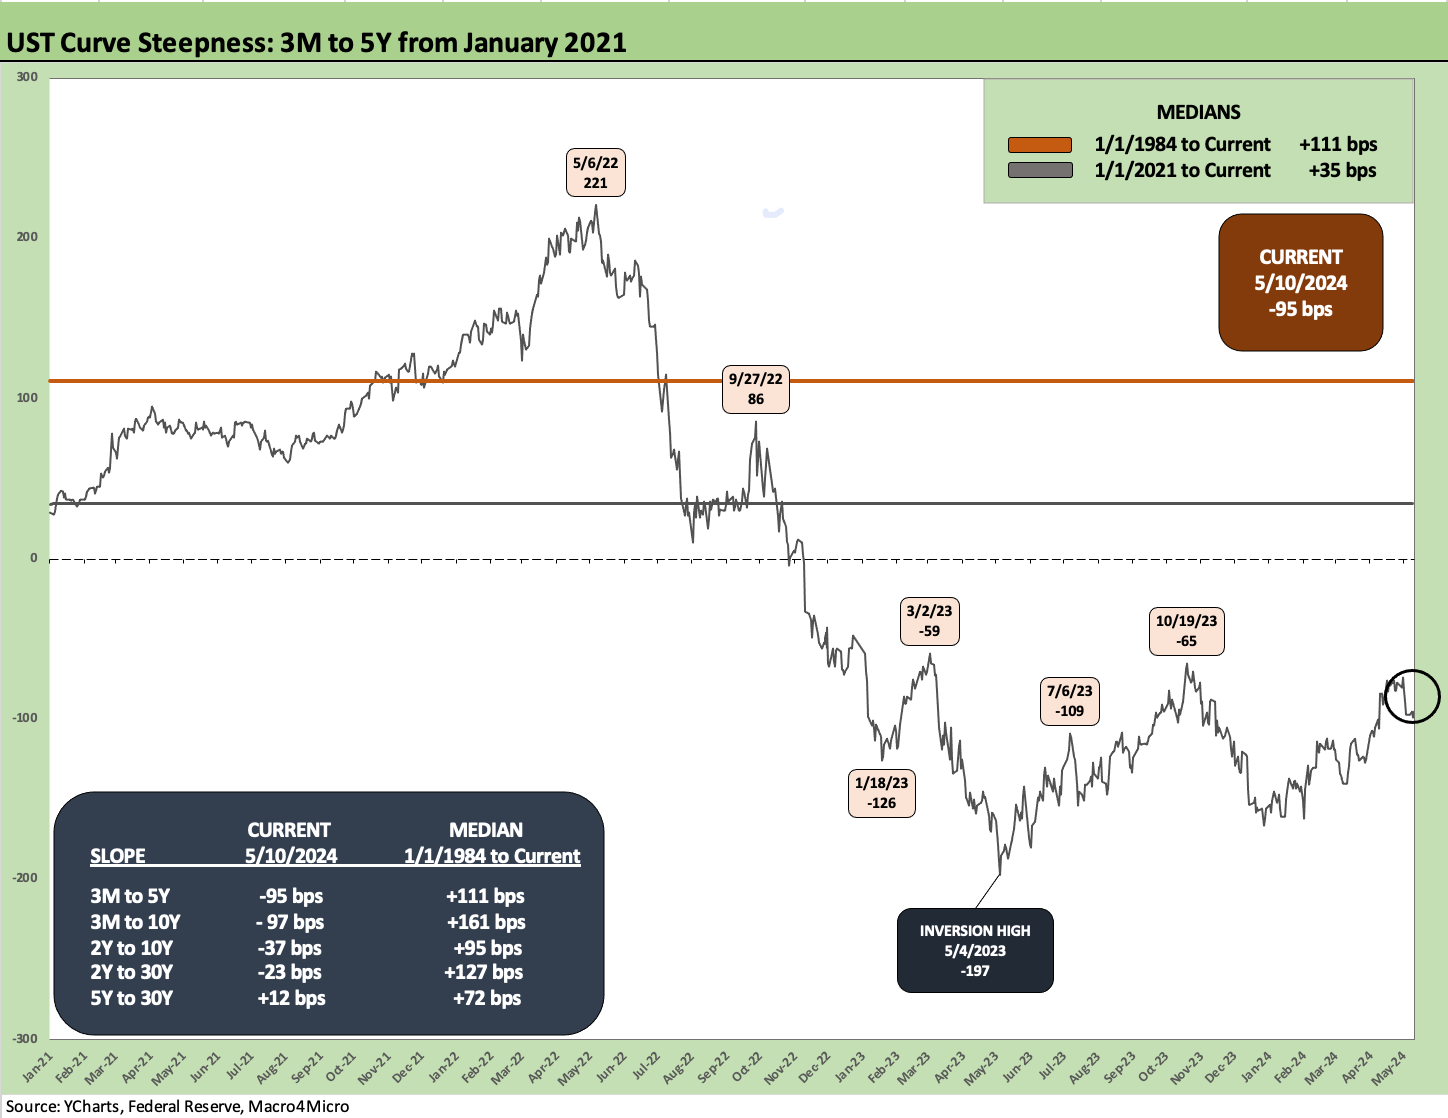
The above chart shortens the timeline to the start of 2021 to give better granularity on the sharp steepening coming out of COVID and the post-vaccine period to a 3M to 5Y peak steepness of +221 bps in May 2022, or almost double the long-term median. The 2021 Fed stall on tightening is where history will be unkind to the Powell period with 3M to 5Y sending some signals that it was time to start moving the needle.

We wrap with our usual chart that tracks the running UST migration from the start of March 2022 as ZIRP came to an end by mid-month (effective 3-17-22). We show the UST deltas in the box with the 3M up by +515 bps, 2Y by+356 bps, 5Y by +296 bps, 10Y by +278 bps, and 30Y by +253 bps. Those numbers were dwarfed by the Volcker years moves with a few rounds of 20% fed funds moments.
The higher absolute rates along the UST curve under Volcker came out of a much higher starting point as we see in the chart at the top of this commentary. This current tightening cycle started with ZIRP gone in March 2022, but the catch-up included some “closet normalization” that was beginning under Obama at the end of 2015 and continued in mixed fashion under Trump until a weak economy in 2019 prompted 3 FOMC cuts.
As a reminder, Trump was screaming for negative rates back then (a la Germany) with reported statements in the media that he said that inflation concerns would be “the next guy’s problem, not his.” That was before COVID sent the markets back to ZIRP.
This recent history is a reminder of why you don’t want Trump doing a takeover of the Fed and bank system oversight. There’s also the small matter of commercial real estate being driven by interest rates. The conflicts of interest speak for themselves. That is not putting the fox in the hen house…that is throwing a bucket of Big Macs to the wolves in your living room.
See also:
Consumer Sentiment: Flesh Wound? 5-10-24
Footnotes & Flashbacks: State of Yields 5-5-24
Footnotes & Flashbacks: Asset Returns 5-5-24
April Payroll: Occupational Breakdown 5-3-24
Payroll April 2024: Market Dons the Rally Hat 5-3-24
JOLTS March 2024: Slower Lane, Not a Breakdown 5-1-24
Employment Cost Index March 2024: Sticky is as Sticky Does 4-30-24
PCE, Income, and Outlays: The Challenge of Constructive 4-26-24
1Q24 GDP: Too Much Drama 4-25-24
1Q24 GDP: Looking into the Investment Layers 4-25-24
Durable Goods: Back to Business as Usual? 4-24-24
Systemic Corporate and Consumer Debt Metrics: Z.1 Update 4-22-24