
Footnotes & Flashbacks: Asset Returns 6-8-25
We update running asset returns with the solid post-pause, post-truce rally sustaining firm risk markets.


Now that’s an insurrection…
The rebound in risk since Liberation Day’s reciprocal sell-off has pushed the equity benchmarks back to solidly positive returns over 1-month and 3-months but still all negative over 6 months. Debt has been mixed with the UST steepening undermining returns and spreads wider YTD both in IG and HY (see Mini Market Lookback: Clash of the Titans 6-7-25).
HY OAS has posted impressive post-pause, post-truce compression but with big questions ahead on trade as China sits down in London with the US while the EU and Canada ponder responses to the latest trade aggression in steel and aluminum (see US Trade in Goods April 2025: Imports Be Damned 6-5-25, Tariffs: Testing Trade Partner Mettle 6-3-25).
Recent economic releases have sustained confidence that tariffs are a slow burn on transaction impacts even if just on natural working capital and inventory cycles into the summer period. Payroll and JOLTS held steady this week and May CPI/PPI are teed up for this week after PCE price indexes held in for April (see Payrolls May 2025: Into the Weeds 6-6-25, Employment May 2025: We’re Not There Yet 6-6-25, JOLTS April 2025: Slow Burn or Steady State? 6-3-25).
The global markets will be watching how some of the National Guard action and ensuing rhetoric will play out (Hegseth threatened to send in the Marines). For now, the LA protests seem quite mild relative to Jan 6 (see 2024 Must be a Year when Facts Matter: The Significance of Jan 6 1-6-24) and what many of us spectated back in the 1960s and early 1970s. There are a lot more cities on the checklist and more governors to coordinate with by law. The “emerging market feel” in US governance is not a great theme for offshore investors in US risk taking.
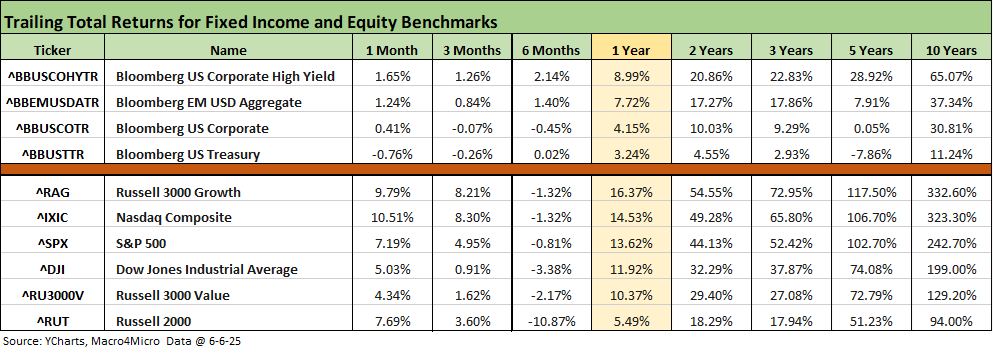
The above table updates the high-level returns for the debt and equity benchmarks we track across this volatile period and multiple trailing time horizons. With 1-month and 3-months all positive for equities and all negative for the trailing 6-months, it has been a challenging period of swings.
As we detail further below, the 19-13 score YTD 2025 on our group of 32 benchmark and industry ETFs tell a mixed story with the S&P 500 in the lower half of the second quartile, NASDAQ in the 3rd quartile, Midcaps in the red further down in the 3rd quartile, and the Russell 2000 small caps also negative but in the bottom quartile.
Looking back at the 1-year and 2-year periods for equities above offers an easy reminder of how strong the performance was in 2023-2024. It also underscores how the valuation challenge isn’t going to get easier if we see more slowing in the consumer sector as evident in the recent PCE numbers and 2nd estimate for 1Q25 GDP (PCE April 2025: Personal Income and Outlays 5-30-25, 1Q25 GDP 2nd Estimate: Tariff and Courthouse Waiting Game 5-29-25).
The FOMC rode to the rescue in 2019 after a bad 2018 (see Past-Prologue Perspective for 2025: Memory Lane 2018 6-5-26). This time, the Fed will need more data reassurance on the price and payroll impact of tariff policies never seen in the modern capital markets era. The market faces a daunting pipeline of Section 232 tariffs ahead (e.g. pharma, semis, aircraft/parts, lumber, copper). Some of those (pharma, semis) will also bring some trade partner anger and “throw-down risk.” Other countries have domestic constituencies also.
We will update our Footnotes publication on the State of Yields later today, but the material bear steepener off the Sept 2024 lows and headlines on US sovereign debt challenges and delinking from the US dollar all make for a challenging story for duration risk.
The rolling return visual
In the next section, we get into the details of the 32 ETFs and benchmarks for a mix of trailing periods. Below we offer a condensed 4-chart view for an easy visual on how the mix of positive vs. negative returns shape up. This is a useful exercise we do each week looking for signals across industry groups and asset classes.
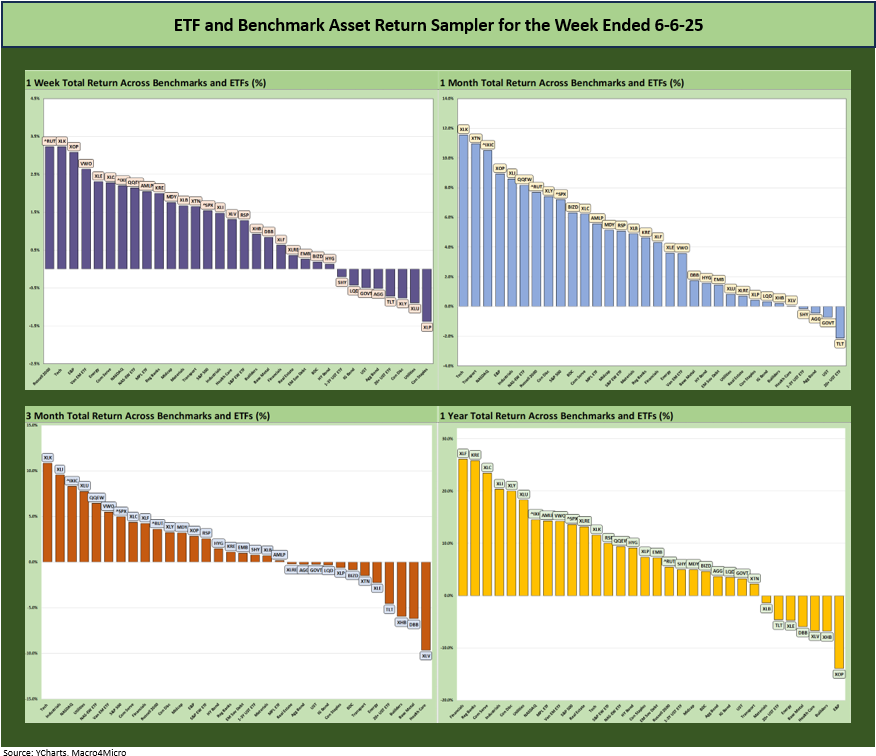
We see favorable symmetry in the above chart for each of the 1-week, 1-month, 3-months and 1-year time horizons. While not shown above, the YTD mix also is biased to the positive side as detailed below.
The Magnificent 7 heavy ETFs…
Some of the benchmarks and industry ETFs we include have issuer concentration elements that leave them wagged by a few names. When looking across some of the bellwether industry and subsector ETFs in the rankings, it is good to keep in mind which narrow ETFs (vs. broad market benchmarks) get wagged more by the “Magnificent 7” including Consumer Discretionary (XLY) with Amazon and Tesla, Tech (XLK) with Microsoft, Apple, and NVIDIA, and Communications Services (XLC) with Alphabet and Meta.
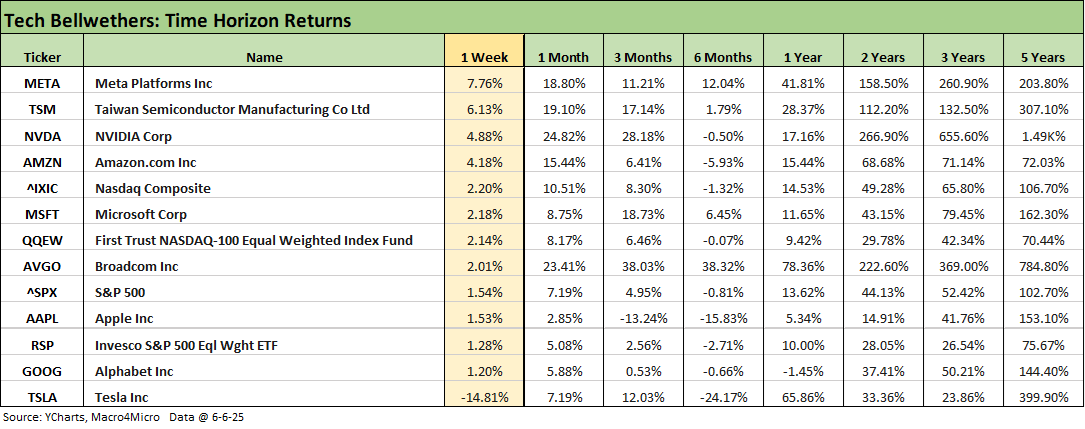
We already commented on the tech bellwether performance in Mini Market Lookback: Clash of the Titans (6-7-25). The Trump-Musk theatrics and massive wave of bile are evident in the sole negative number on the week posted by Tesla. We see 3 of the Mag 7 ahead of the NASDAQ on the week but all positive for 1-month. All lines except Apple were positive for 3-months. Looking back at the trailing 6-months, we see 9 lines in the negative column including 5 of the Mag 7.
Away from the worries of those who have Tesla exposure, an additional worry would be another personal vendetta by Trump that looks to cut off government funding from Tesla. While most people don’t care if Musk suffers (many would cheer it on), the action would imply Trump is as dedicated as ever to using government dollars and power to penalize enemies and reward allies. That has been much in evidence to date, but an unspoken worry is the erosion of the rule of law and how vendetta politics would further heighten the growing perception that US governance and budget actions are more like an emerging market. This has not done wonders for the US dollar of late and could even deter UST buyers who are under siege on the trade front.
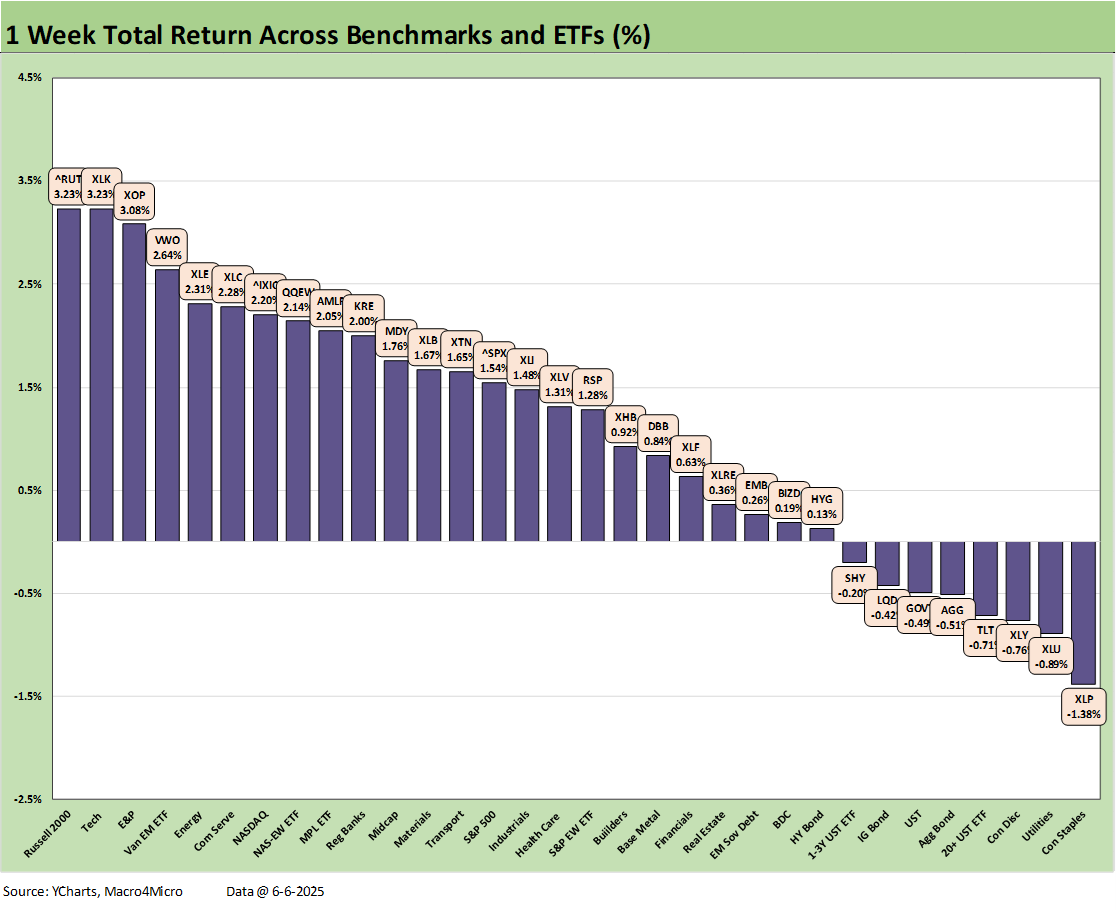
We already commented on the latest rebound week in Mini Market Lookback: Clash of the Titans (6-7-25). The 24-8 score included 5 bond ETFs in the red with HY ETF (HYG) and EM Sovereign ETF (EMB) across the line in positive range in the 3rd quartile.
A notable winner on the week was the US-centric Russell 2000 index at #1 after being a notable laggard YTD in the bottom quartile. Right behind the Russell 2000 (RUT) was the Tech ETF (XLK) followed by the E&P ETF (XOP) on the oil price rebound to $64 to end the week from $60 the prior week.
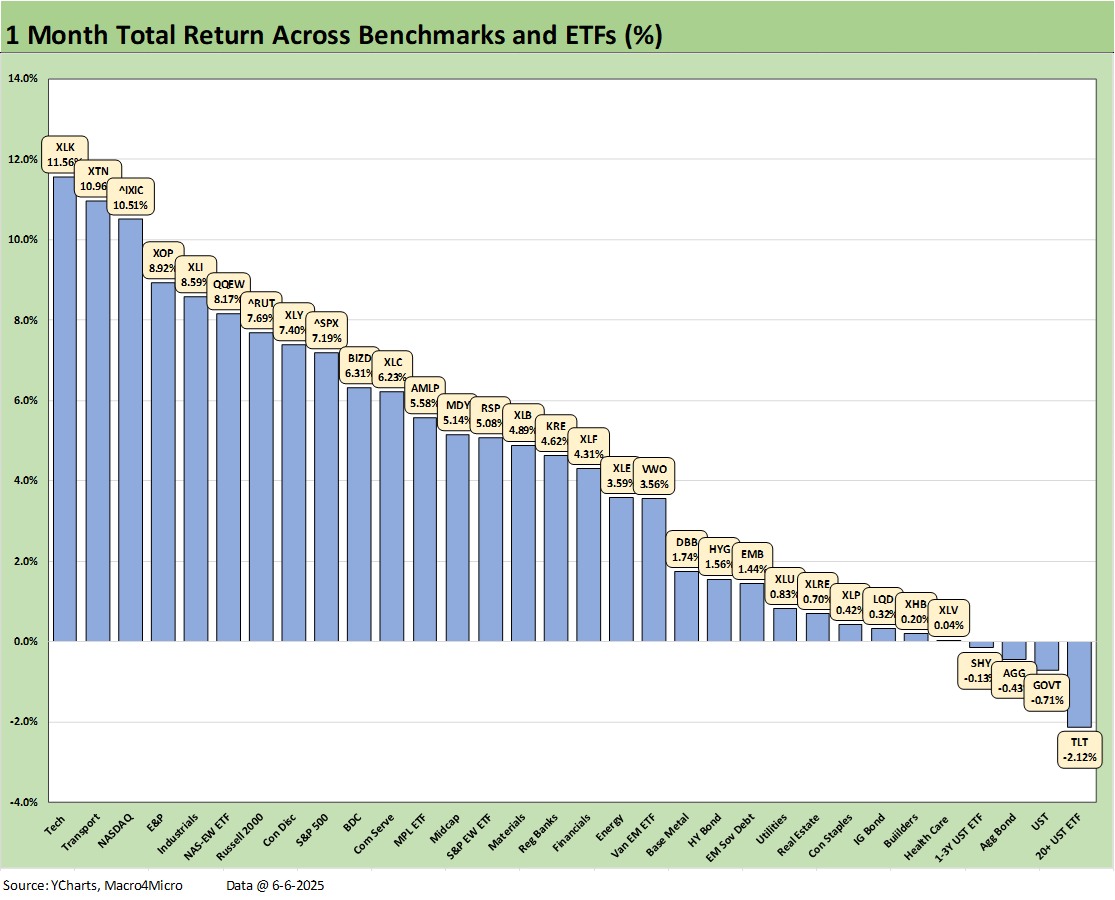
The 1-month celebration of the pause and “the truce” (with China) is very much in evidence with the 28-4 score showing all 4 negative lines as bond ETFs on the UST curve moves. The bottom quartile also includes interest-rate sensitive ETFs such as Homebuilders (XHB), IG Corporates (LQD), and the defensive Utilities (XLU) and Consumer Staples (XLP) ETFs. We see Health Care in a recurring state of lag across all time horizons with tariffs (relocation and retaliation) and potential price control threats all lurking even beyond the mysteries of what is knocking around in the head of RFK Jr.
Among the winners in the upper quartile, we see a higher mix of tech-centric benchmarks and ETFs including the Tech ETF (XLK) at #1, NASDAQ at #3 along with the Equal Weight NASDAQ 100 (QQEW) and Russell 2000. We even see Consumer Discretionary (XLY) at the bottom of the top quartile despite the Tesla chaos this past week as Tesla still showed a positive rolling 1-month return (detailed in the earlier table).
We highlight the ability of the Transports ETF (XTN) to grab the #2 slot for the 1-month period after being hammered by the trade stress. XTN remains dead last YTD and in the bottom quartile for 1-year.
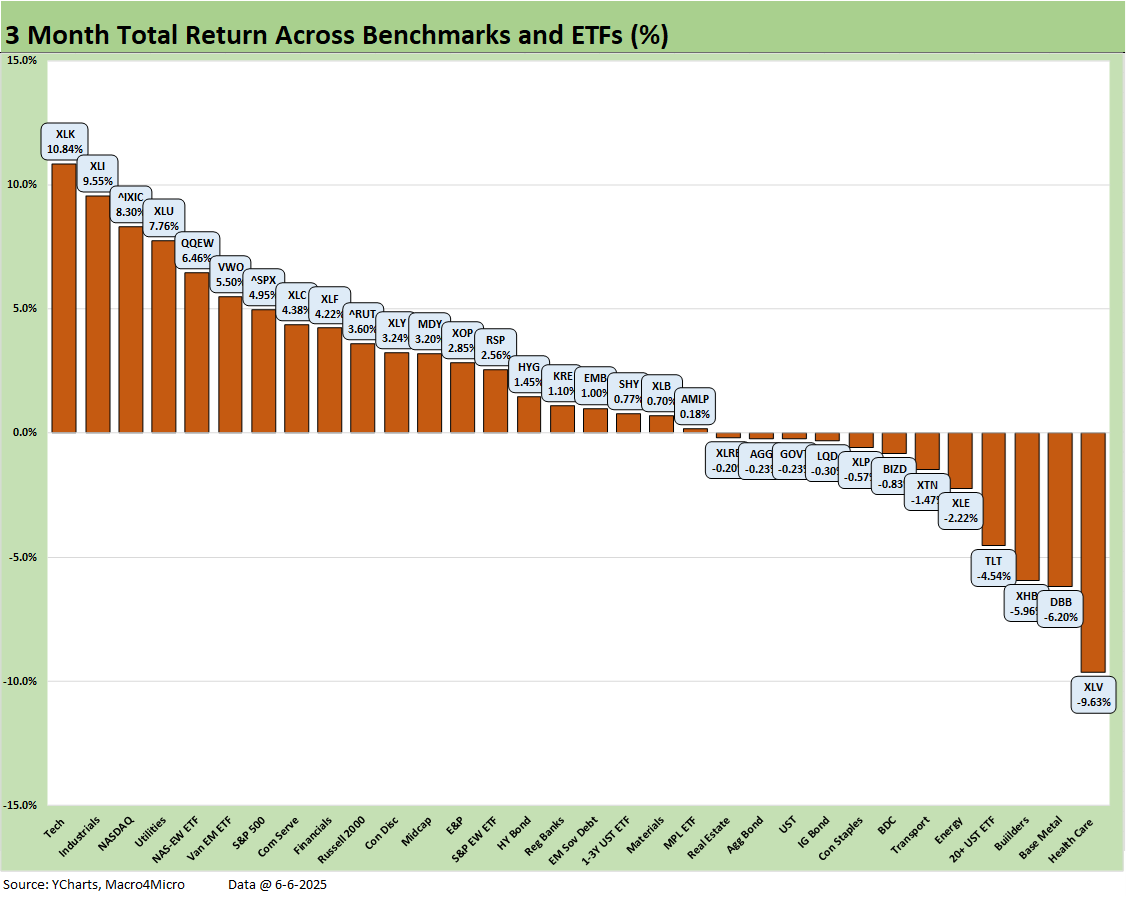
The 3-month score of 20-12 shows the major benchmarks in positive range (in contrast to the YTD pattern seen in the next chart). The top quartile mix is tech heavy with XLK at #1 and NASDAQ at #3 and the Equal Weight NASDAQ 100 (QQEW) rounding out the top 5. Communications Services (XLC) was at the bottom of the top quartile. The S&P 500 also made the top quartile.
The weakest performers for 3-months included Health Care (XLV) for reasons already cited along with Homebuilders (XHB), the long duration UST 20+ years ETF (TLT). Transports (XTN), Energy (XLE), Base Metals (DBB), BDCs (BIZD), and the defensive Consumer Staples (XLP) were among bottom quartile players.
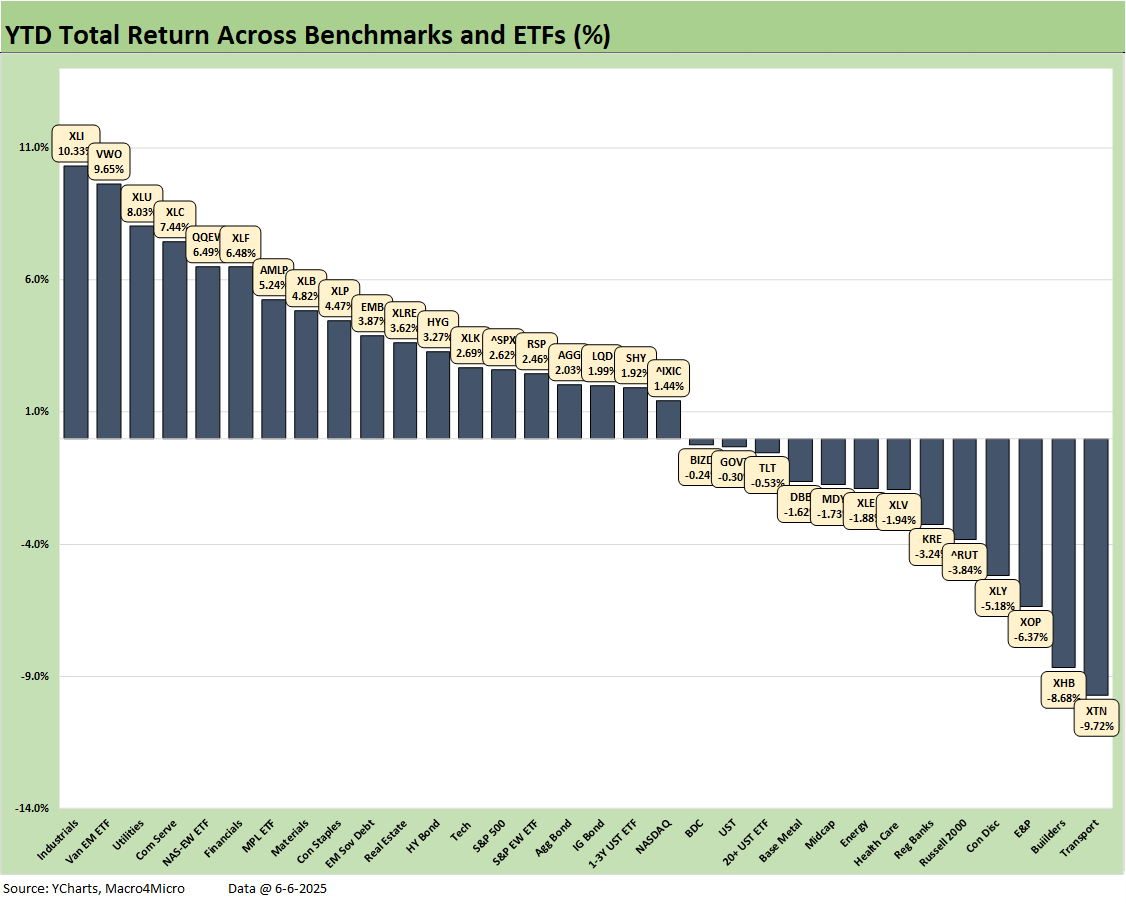
The YTD score of 19-13 includes some decidedly mixed news for the major benchmarks with the S&P 500 in the lower half of the second quartile, the NASDAQ in the third quartile, Midcaps at the bottom of the third quartile (with negative returns), and the Russell 2000 in the bottom quartile.
The top quartile was a diverse mix with Industrials (XLI) at #1, EM Equities (VWO) at #2, Utilities (XLU) at #3 with Financials (XLF), the income-heavy Midstream Energy ETF (AMLP), and Materials (XLB, which is heavy on chemicals) showing a diverse cyclical mix in the leader ranks. The two tech-centric lines in the mix were Communications Services (XLC) at #4 and Equal Weight NASDAQ 100 at #5.
For the bond ETF collection and 7 we follow, we see 4 in the 3rd quartile with TLT, GOVT, SHY and LQD and 3 bond ETFs in the second quartile with AGG, HYG and EMB.
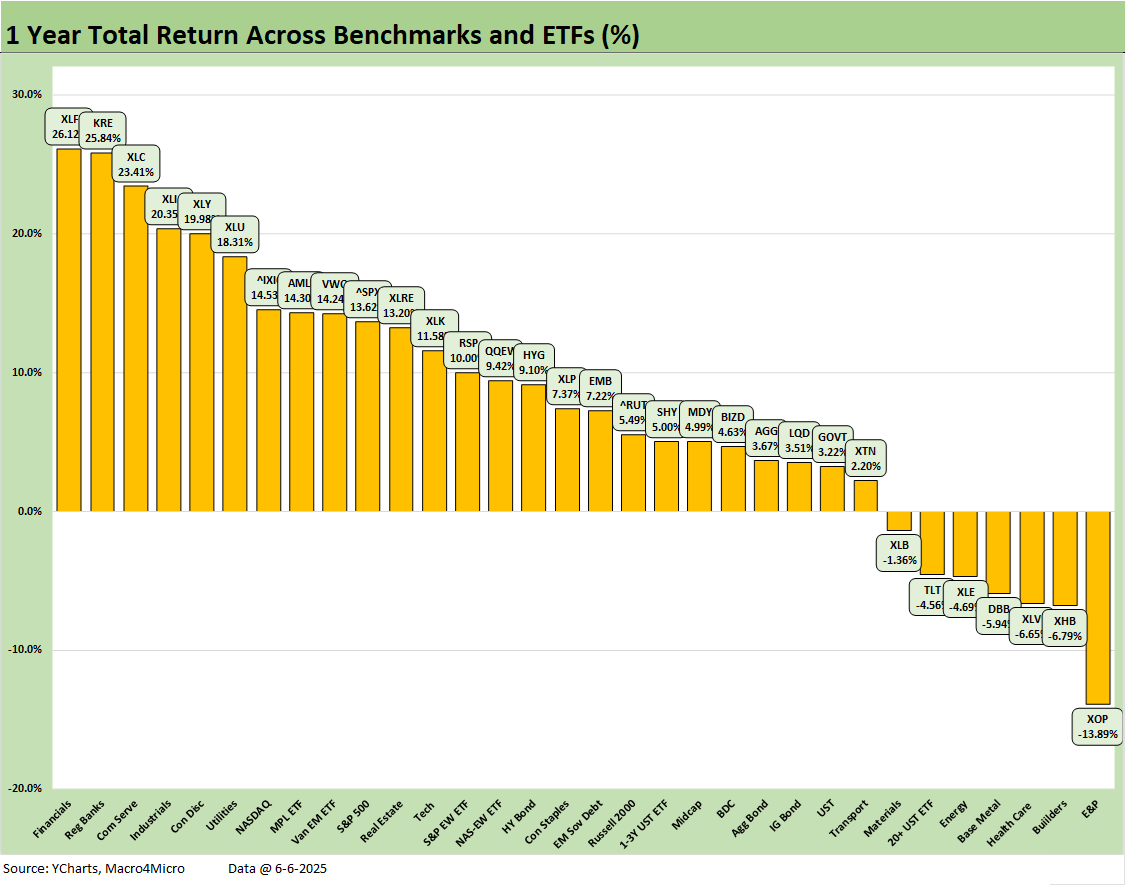
The 25-7 score for the trailing 1-year is still riding a strong 2024 performance with some big winners such as Financials (XLF) at #1 at over +26% followed by Regional Banks (KRE, 25.8%), Communications Services (XLC, 23.4%), and Industrials (XLI, 20.3%) rounding out the over 20% club.
The median return across the 32 lines was modestly above the 7% threshold. That is still well under the FY 2024 performance. As a reminder, we saw a score in 2024 of 30-2 (see Footnotes & Flashbacks: Asset Returns for 2024 1-2-25). The median was just over 10% and it took almost +22% to make the top quartile.
The main weak spots included Energy (XLE, XOP), interest sensitive sectors (XHB, TLT) with some cyclical commodity concerns around trade war risk and weaker trade (DBB, XLB). Health Care (XLV) problems were discussed earlier. Transports (XTN) rounded out the bottom quartile but posted positive returns.
See also:
Mini Market Lookback: Clash of the Titans 6-7-25
Payrolls May 2025: Into the Weeds 6-6-25
Employment May 2025: We’re Not There Yet 6-6-25
US Trade in Goods April 2025: Imports Be Damned 6-5-25
Past-Prologue Perspective for 2025: Memory Lane 2018 6-5-25
JOLTS April 2025: Slow Burn or Steady State? 6-3-25
Tariffs: Testing Trade Partner Mettle 6-3-25
Footnotes & Flashbacks: Credit Markets 6-2-25
Footnotes & Flashbacks: State of Yields 6-1-25
Mini Market Lookback: Out of Tacos, Tariff Man Returns 5-31-25
PCE April 2025: Personal Income and Outlays 5-30-25
Credit Snapshot: Meritage Homes (MTH) 5-30-24
1Q25 GDP 2nd Estimate: Tariff and Courthouse Waiting Game 5-29-25
Homebuilder Rankings: Volumes, Market Caps, ASPs 5-28-25
Durable Goods Apr25: Hitting an Air Pocket 5-27-25
Mini Market Lookback: Tariff Excess N+1 5-24-25
New Home Sales April 2025: Waiting Game Does Not Help 5-23-25
Existing Home Sales April 2025: Soft but Steady 5-22-25
Credit Snapshot: Lithia Motors (LAD) 5-20-25
Home Starts April 2025: Metrics Show Wear and Tear 5-19-25
Industrial Production April 2025: CapUte Mixed but Time Will Tell 5-15-25