
Footnotes & Flashbacks: Credit Markets 6-2-25
We look at the rally in credit into the end of May with tariff tensions rising again and the budget bill heading to the Senate.


Someone has to win, but someone has to lose. That is the game.
Spreads tightened across the ratings spectrum the past week with US IG tightening -2 bps and US HY tightening -9 bps. The spread compression for the month ran alongside what had been called “the best May since 1990.” (see Footnotes & Flashbacks: Asset Returns 6-1-25) . That sound great, but the summer of 1990 marked a recession start and the fall was oil market chaos (Iraq-Kuwait) and credit volatility soared.
Tariffs remain the overriding driver as the initial reaction to the 50% EU tariff pause news drove an early week rally, but steel and aluminum tariffs doubled as the week came to an end with US-China tensions rising again on rhetoric and “Taiwan talk” by Hegseth in Singapore. The confidence in framing the range of tariff scenarios is tempered by an inevitable SCOTUS decision on IEEPA and reciprocal tariffs even as the Section 232 decisions will continue to roll out.
This week sees the “Big Beautiful Bill” heading to the Senate and the early headlines will shape the discussion around US fiscal health and sovereign debt risk as the current projection is that it will add trillions to the deficit. Adding on tariff-driven worries for corporates and consumers and the risk of a bearish curve move led by cost-driven goods pricing pressures is a worry. Inflation talk will not go away soon (see Footnotes & Flashbacks: State of Yields 6-1-25).
This week has JOLTS, payrolls, and fresh trade deficit numbers. The reality of lagging transaction effects means we still expect a 2H25 impact on labor markets but investors remain on edge for any sign of weakness or inflation as tariffs hit the bottom line. Most of those who understand tariffs appreciate the realities of lags, working capital cycles, contracts, and any planning process on how to deal with such material cost pressures. So the slow response in prices and payroll does not mean the economy is “off the hook.”
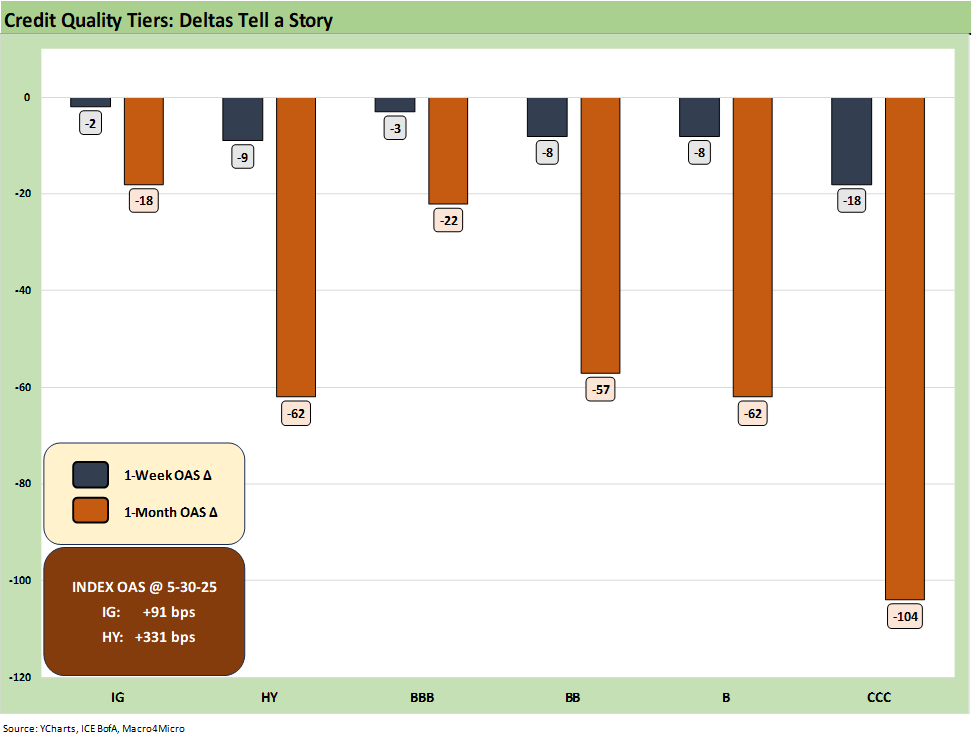
The 1-week and 1-month spread deltas are shown across the ratings tiers above with US IG tightening -2 bps on the week and US HY -9 bps. The erratic trade policy approach continued and the courts saw a fresh whipsaw, but then Trump took trade tensions higher again on Friday with doubled steel and aluminum tariffs. Trump throwing out a 50% tariff on EU and then pulling it back over the past week brought out the TACO trade lampooning, and that annoyed Trump. Then by the end of the week Trump’s ire around the TACO tag was evident in the 50% steel and aluminum tariff, up from the prior 25%. Those tariffs fall hardest on Canada (aluminum and steel both) and the EU (steel).
The 1-month moves still show the latter half of the post-Liberation Day bounce back as the walk back from the most severe of the tariff policies came and 1Q earnings overall were relatively solid to stable. We head into this week with renewed fears around reigniting trade tensions with major trade partners as steel and aluminum tariffs doubled and US-China rhetoric soured.
With major tariff “negotiations” tied up in several pauses rather than deals, the temperature on tariff talks does not make the path forward easier. We expect the combination of cost and inflation pressures will start to see more headlines and especially if retaliation kicks into gear across more sources. Japan and South Korea seem to be in limbo even after the US Steel “partnership.” We will look at the steel issues in a separate piece.
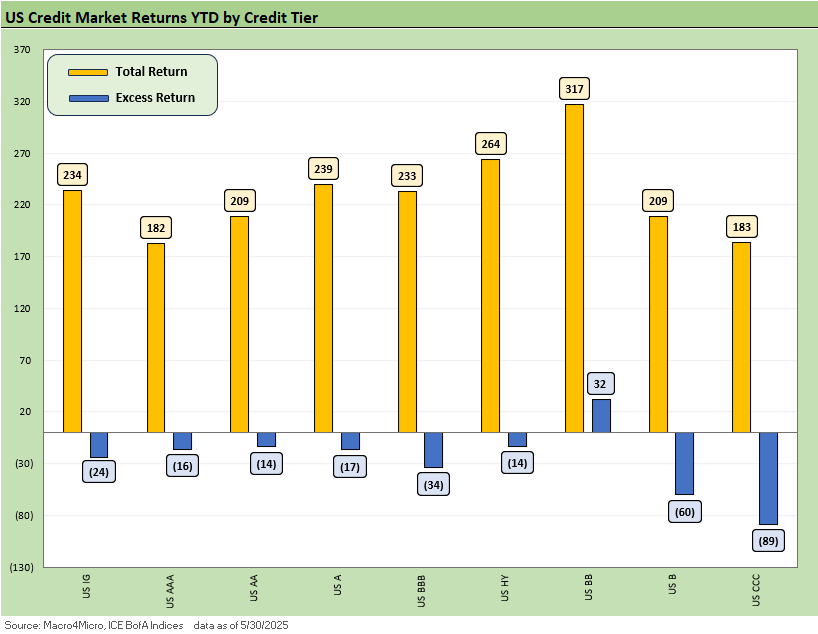
The return picture for the US credit market shows total returns responding to the UST rally the past week (see State of Yields and Asset Returns). Excess returns across the board are mixed on the year though B and CCC still are more negative on +53 and +150 bps YTD spread widening, respectively. With May results now on the books, annualizing the current total returns would leave 2025 as a middling year for credit and low on the excess return rankings though there is a lot of year left.
As the 2Y-10Y rally YTD for UST has supported most of the credit market total returns thus far this year, the upcoming discussion on the Big Beautiful Bill leaves a lot of room for return volatility, and for IG especially in terms of rates and curve risk. Bear steepening UST moves come and go, but the high-level color (e.g. Jamie Dimon) and Fed worries about how tariff impacts could undermine UST demand. The worries are not minor and not just the usual bull-bear bias chatter.
The dollar delinking from long UST has only made many worry more about supply-demand imbalances for UST buyers – notably offshore investors that Trump is treating badly in trade/tariffs. The Senate budget hawks will also be loud about the fate of US sovereign credit quality. There are a lot of major holders in Asia, Europe and Canada that are not “feeling the love” right now. They will need to grow their holdings – not reduce them. They will also need to consider the currency risks and feel comfortable with US fiscal governance.
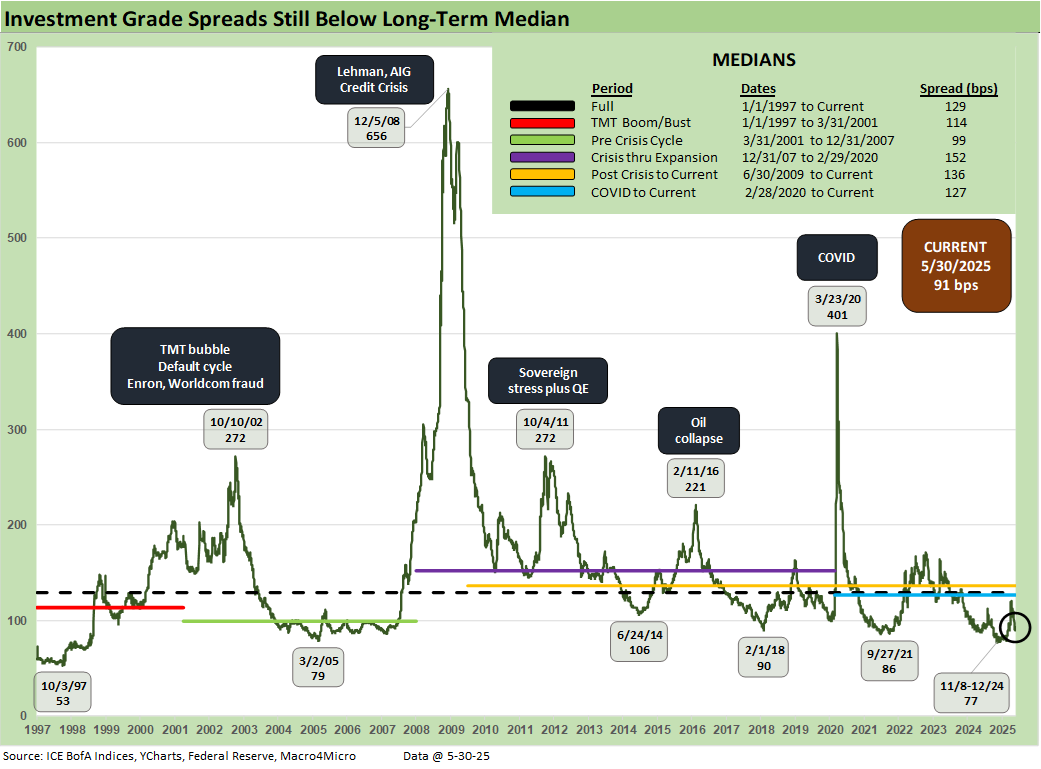
US IG spreads ended the week -2 bps tighter, well into the double-digit territory and +9 bps wider YTD. Spread moves for IG have tempered reactions to the most recent tariff driven volatility and news flow, but the budget discussions could place renewed pressure on spreads. We still see that this IG OAS level as likely a challenge to sustain with stagflationary risks heightened and new tariff headlines on the way (pharma, semis, aircraft/parts, lumber, copper etc.) Without clear signs, spreads remain range bound for now ahead of a busy summer.
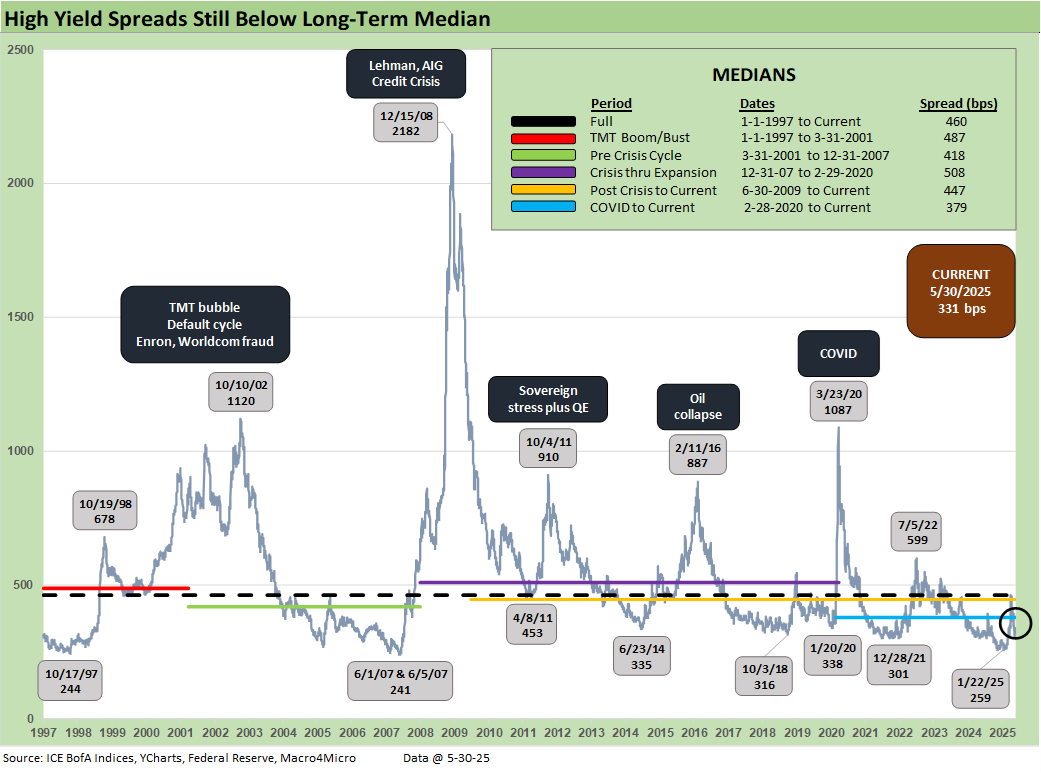
This week saw -9 bps of tightening for US HY down to +331 bps with spreads now in the lower +300 bps range the past few weeks. The current levels sit within ranges around the 2014 and 2018 cyclical lows and need a lot to go right on the trade front to remain at these compressed levels.
With a higher-quality index now vs. past cycles, the recent history includes a stretch below the 300 bps mark with the recent January low of +259 bps very close to the June 2007 lows. Like US IG spreads, we struggle to see the resolution of trade issues without further hiccups and US HY spreads remain vulnerable to more volatility even if they continue to grind tighter until the headlines come. Steel and aluminum tariffs on Friday and raising US-China tensions leaves more downside risk on trade deal outcomes with key partners before the 90-day pause windows start to elapse. Even if Trump extends the pause, the reality is that also can delays capital budgeting planning and slow consumer demand even more than we already have seen.
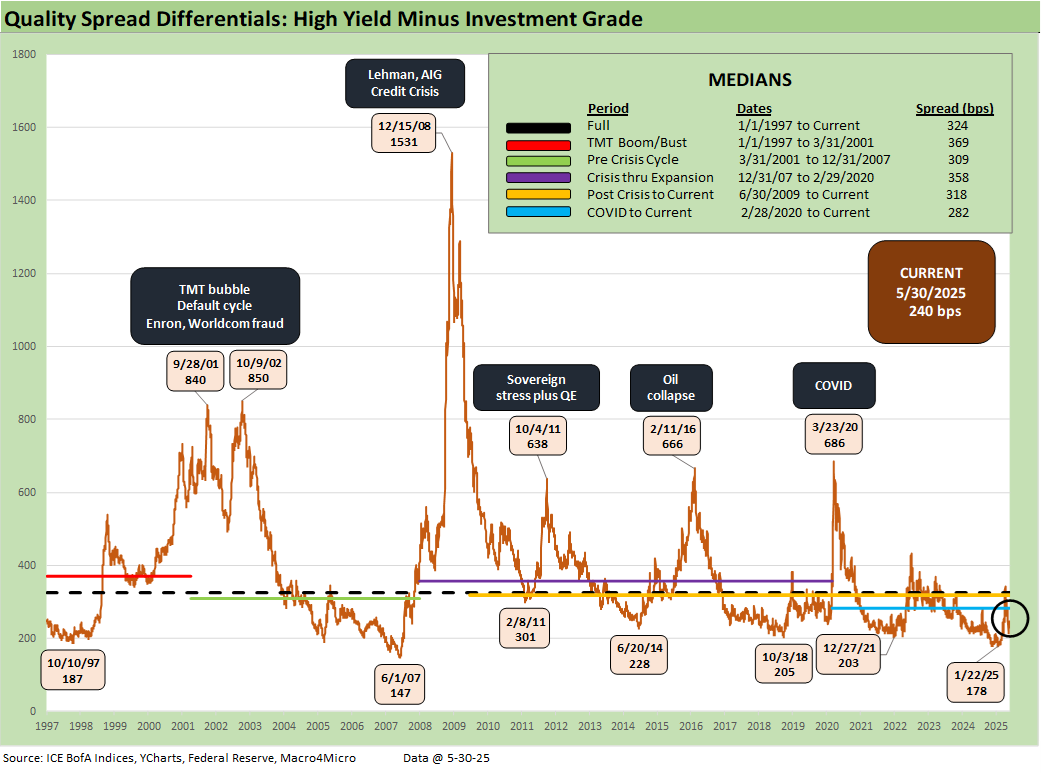
The differential between HY OAS and IG OAS (quality spreads) narrowed -7 bps this week as spreads rallied. This level remains tight in historical context but the recent period sees these sharing a closer relationship given the IG quality shift towards BBB and HY quality skew towards BB. The increase this week remains inside the post-COVID median and remains modestly above the 2014 low of +228 bps.
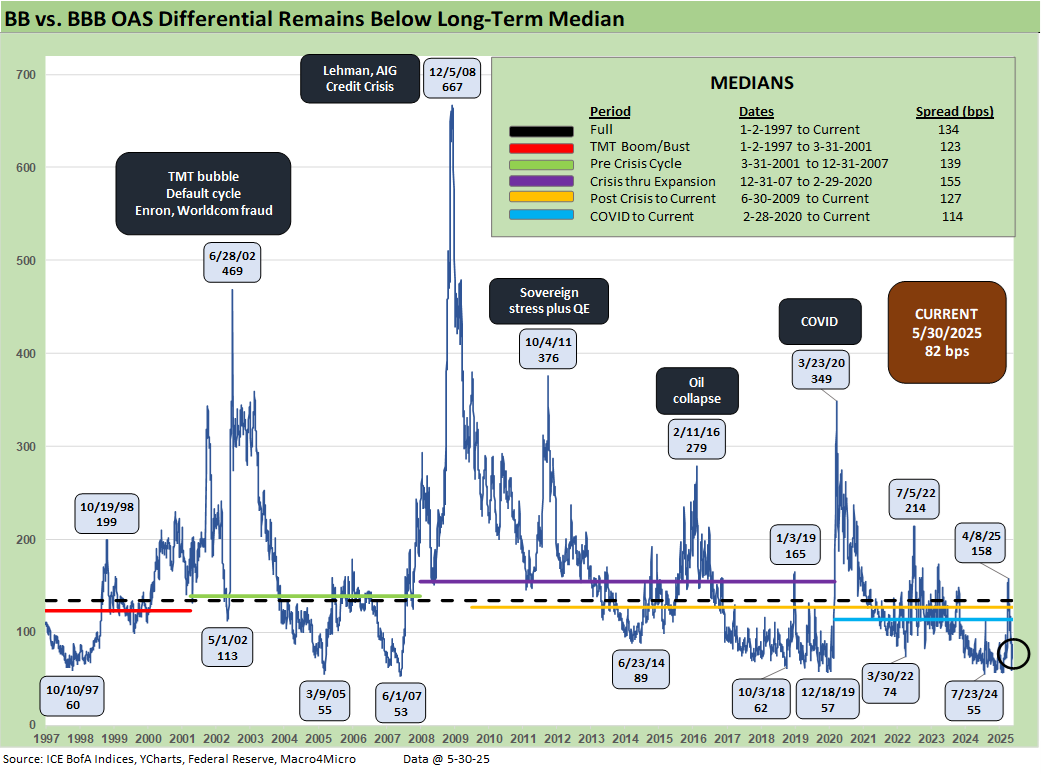
The “BB OAS minus BBB OAS” quality spread differential tightened -5 bps this week in the mixed trade-driven rally The most recent move remains in double digits, but still above the most recent all-time low territory saw late last year. This metric has stayed lower in recent history given the convergence in credit quality of the tiers and the core investor base, as the post-COVID history shows.
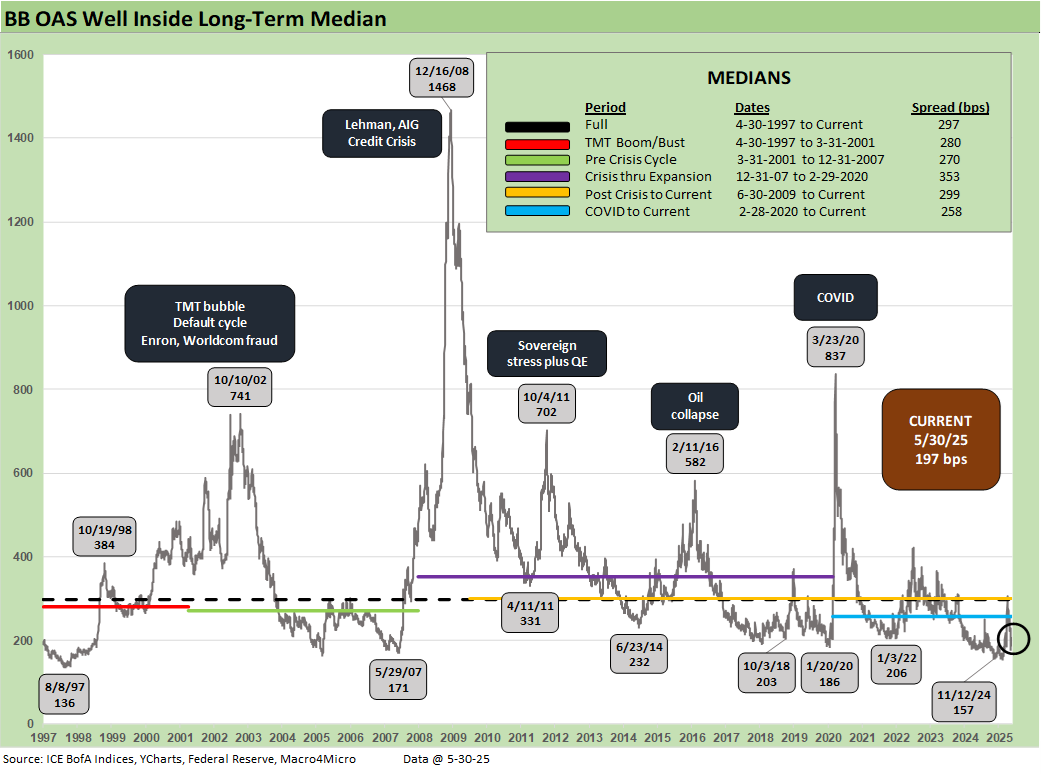
The BB tier tightened -8 bps since last week to +197 bps is just below the 2018 cyclical low and well inside the 2014 cyclical low. This has been the best performer in credit this year as seen above with decent total return performance and at least positive excess return given only +11 bps of widening YTD. The combination of higher quality and lower duration risk has paid off.

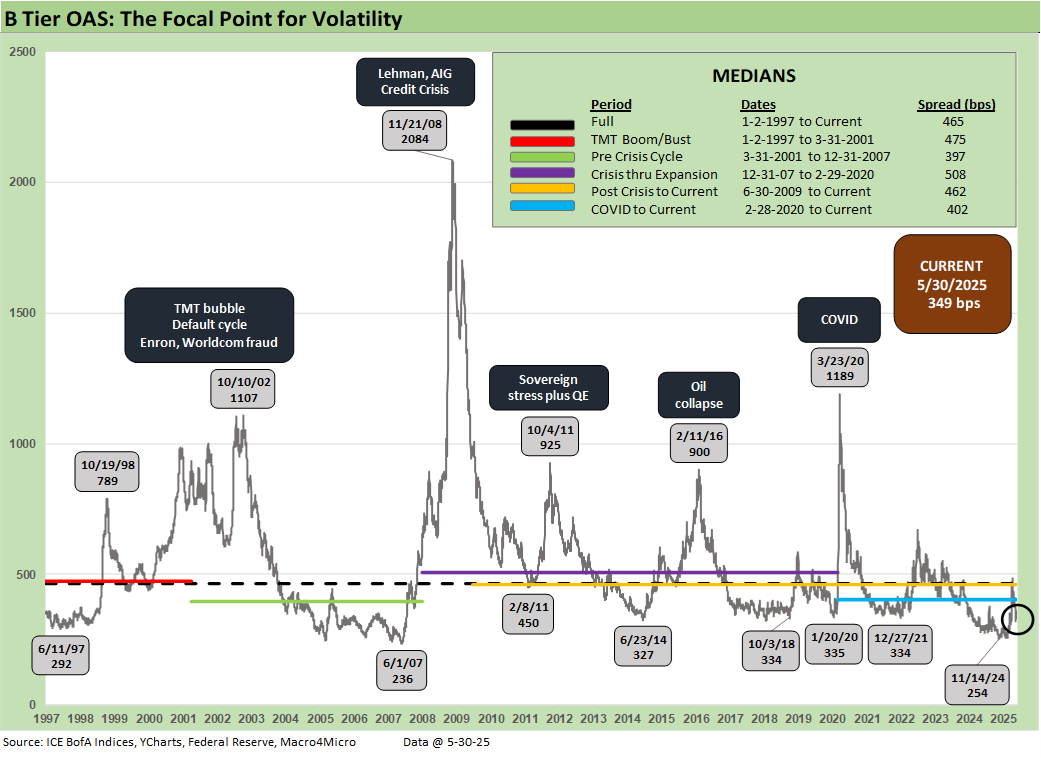
The B tier tightened -8 bps this week out down to +349 bps. The whipsaw this month saw spreads briefly above the long-term median at +486 bps, and the relief rally has recovered to -137 bps tighter since. The current level remains a little above lows in 2014 and 2018 but remain well below the longer-term medians.
The B vs. CCC tier OAS time series is plotted above. The timeline for B and CCC spreads highlights the points of major divergence along the way (see The B vs. CCC Battle: Tough Neighborhood, Rough Players 7-7-24).
The current CCC tier OAS at +896 bps tightened by -18 bps the past week though remained under the long-term median of +953 bps. The recent volatility was a brief reminder of the kind of B vs. CCC divergence that can happen in a hurry as markets reprice. Further tariff chaos still has the potential to repeat that volatility with recent US-China truce and EU tariffs flashpoints that are avoided for now.
The potential economic damage that could come in the summer and into the fall is still a gathering storm with the wide array of tariffs in the queue. The scale of the China shutdown was more immediate and far more serious, and you cannot rule out that chaos coming back. A 50% EU tariff could have seen similar dislocation for many industries. As least the more extreme outcome are lower probability (for now) and those hits to prices and expense lines are mitigated (but can be revisited in a tit-for-tat retaliation scenario). Another increase in Section 232 tariffs on Steel and Aluminum now raise the bar again for retaliation from major partners, especially EU and Canada.
We would argue that there is nothing quite like the China risk that was in evidence before the truce even if China is the #4 trade partner and EU #1, and those risks were elevated again after this weekend – notably on the Hegseth commentary and Rubio threats against Chinese students to revoke visas. The China trade issue is back on the front burner.
China problems like what we saw unfolding would bring devastation to many retailers and small businesses. That threat still lurks until a deal is struck and, even then, the problems for goods prices and company margins will be severe. The often-heard refrain that “we imported low inflation from China” as usual begs the question “What are you importing if you remove that?”
The CCC YTW is just hovering the 13% line at 12.99% after being above 14% just last month, but the underlying constituents are widely dispersed across an 81.87 composite dollar price. The CCC tier is still in the pricing zone of equity risk-returns with such yields.
CCC investing at this point demands careful capital structure analysis and rigorous issuer-level relative value research. Subject to how the tariff policies play out and how the stagflation wildcard unfolds, the distressed players are warming up. Costs will still be rising even as pauses and deals start to roll in at some point.
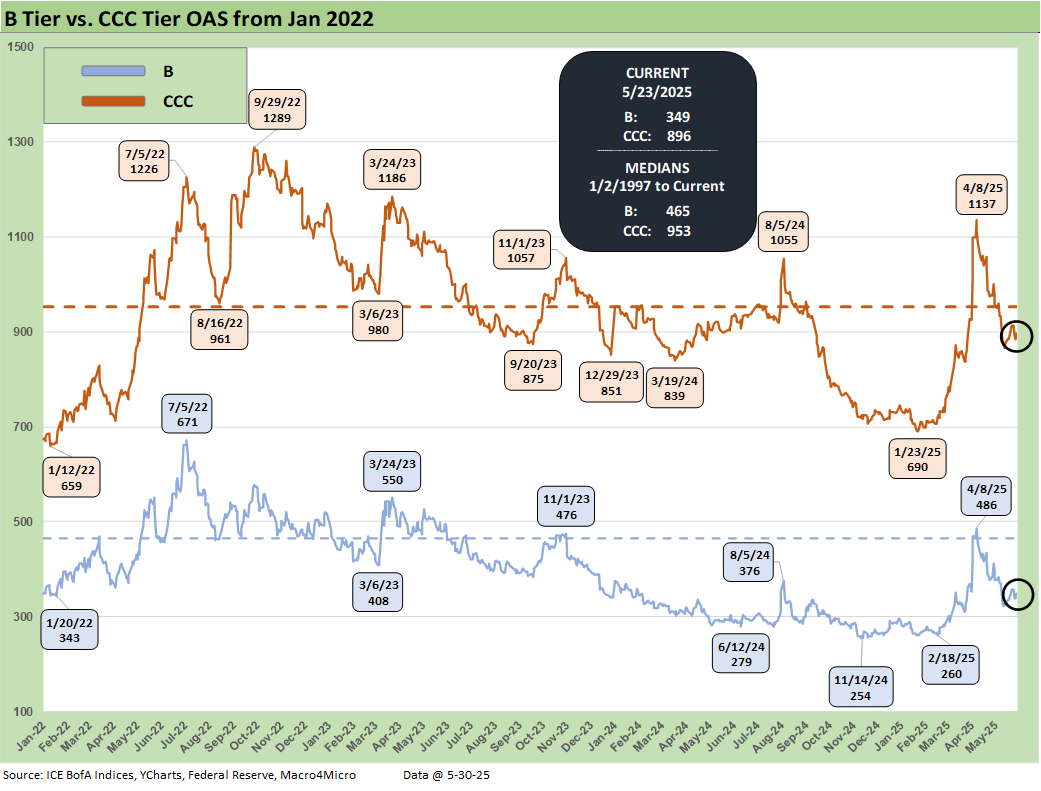
The shorter timeline from Jan 2022 just ahead of the end of ZIRP and start of the tightening cycle gives better granularity on the movements from a low for CCCs of +659 bps in Jan 2022 to a peak of +1226 bps in July 2022 and +1289 bps to end Sept 2022. Then spreads came down to the Jan 2025 tights of +690 bps ahead of the recent spike and whipsaw to current levels.
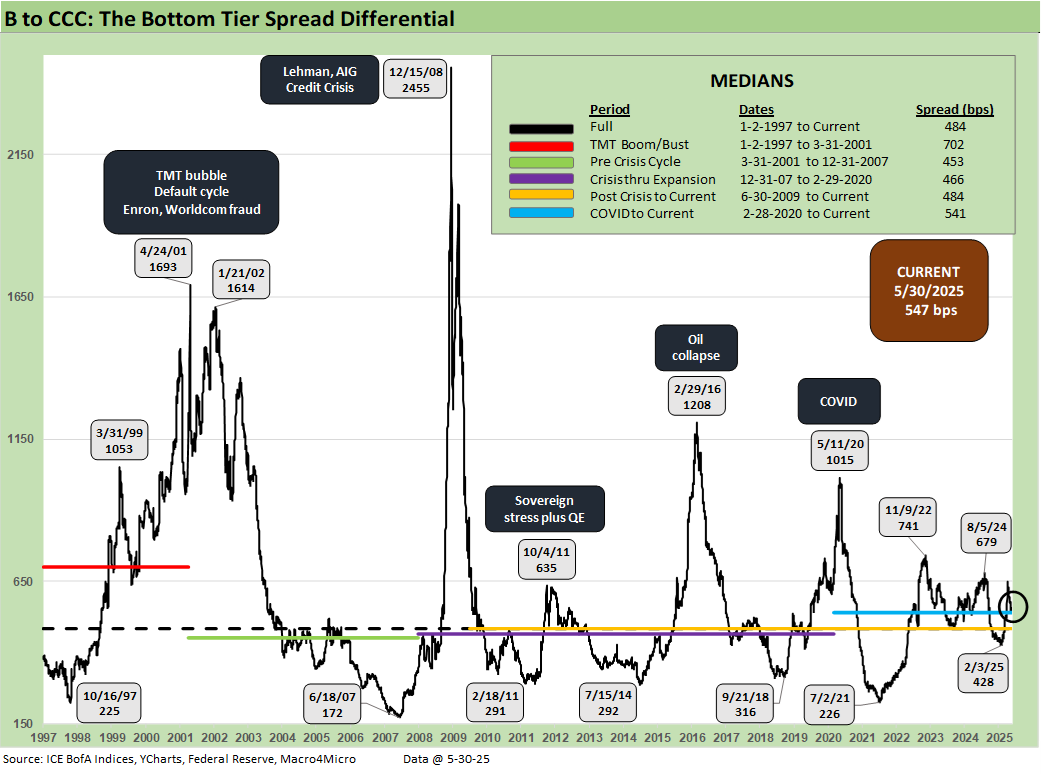
The B vs. CCC tier differential is broken out with the current +547 bps still higher than the long-term median and above the distinct market time horizons with the exception of the TMT HY credit cycle with its +702 bps median.
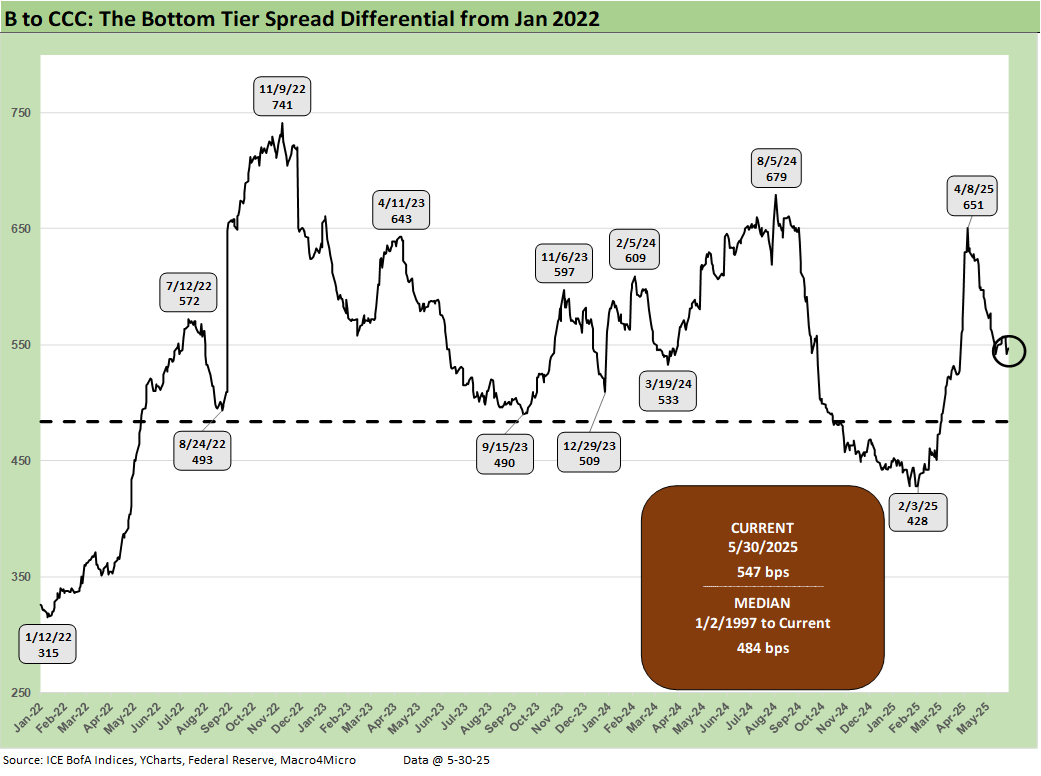
The above chart frames the “B vs. CCC tier” quality spread differential across the short timeline for better granularity. Spreads widened with a vengeance since the low of Feb 2025 at +428 bps even if quality spreads recovered from the early April spike to +651 bps on April 8.
A look at yields…
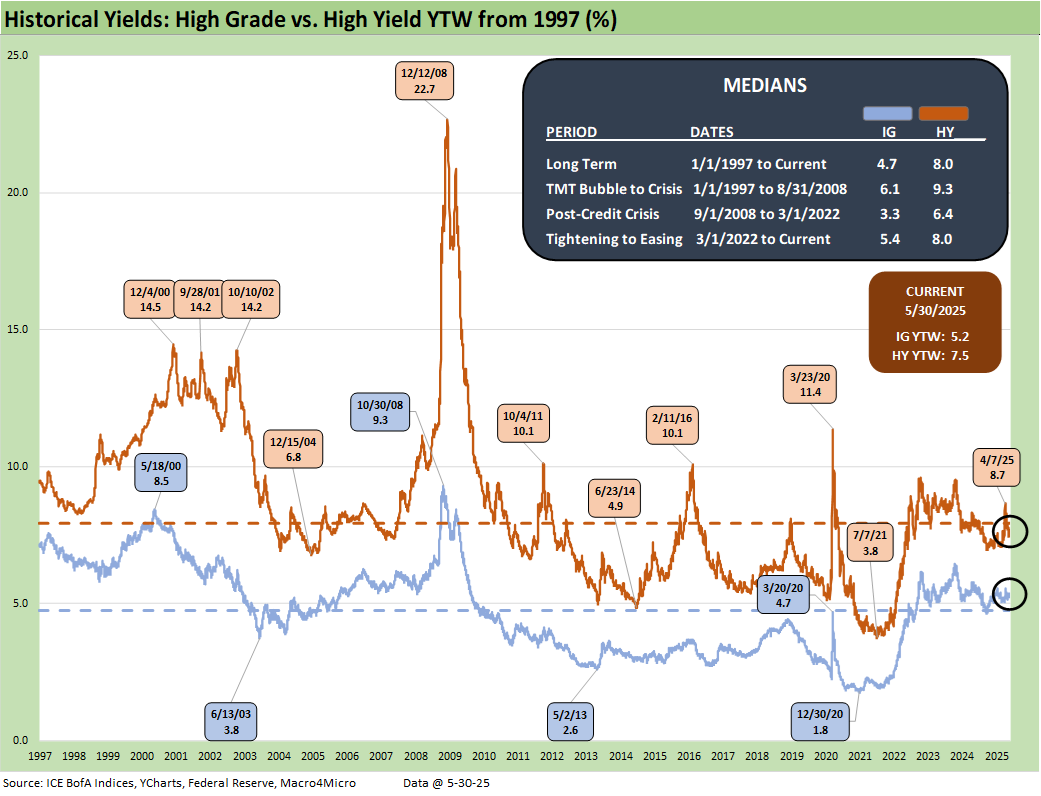
Moving away from spreads, which are well below long-term medians this week, yields for both IG and HY have a more complex story in historical context given the post-crisis distortions of ZIRP and “normalization.” The normalization period of Dec 2015 to Dec 2018 never really got on track with the economic weakness and Fed easing of 2019 followed by a COVID crisis and return to ZIRP in Mar 2020 (ZIRP ended March 2022).
The current IG YTW at 5.21% (vs. 5.33% last week) declined on the combination of UST rally and spread tightening and remains below the 6.1% pre-ZIRP median on YTD UST curve moves.
The HY YTW decreased to 7.48% (from 7.68%) vs. a pre-ZIRP 9.3% median. We consider the pre-ZIRP years the most rational frame of reference in light of the post-crisis ZIRP and QE as well as the COVID Fed reactions.
Spreads will remain a key swing factor for reaching those yield medians of pre-ZIRP years, and we just saw material volatility in credit risk pricing in HY the past five weeks. UST yields are a tougher call with the tariff backdrop that still threatens stagflation as well as the potential for further technically driven upward shift on the supply-demand fears. A pause on EU tariffs avoided more immediate self-inflicted pain this past week but still leaves the trade picture unresolved with many large trade partners to address. The steel industry historically is one that the EU takes very seriously plus pharma is a massive line for EU imports with that Section 232 on the way. Canada has to feel like Trump has declared economic war on them, and his 51st state chatter is still in his routine.
Stagflation risk remains in the debate. Away from stagnation + inflation, old fashioned recession risk would pressure UST rates lower and credit spreads higher, but this is no ordinary cyclical turn. We cover the UST shapeshifting in our separate Footnotes publication on yields as the UST curve saw another minor rally this week.
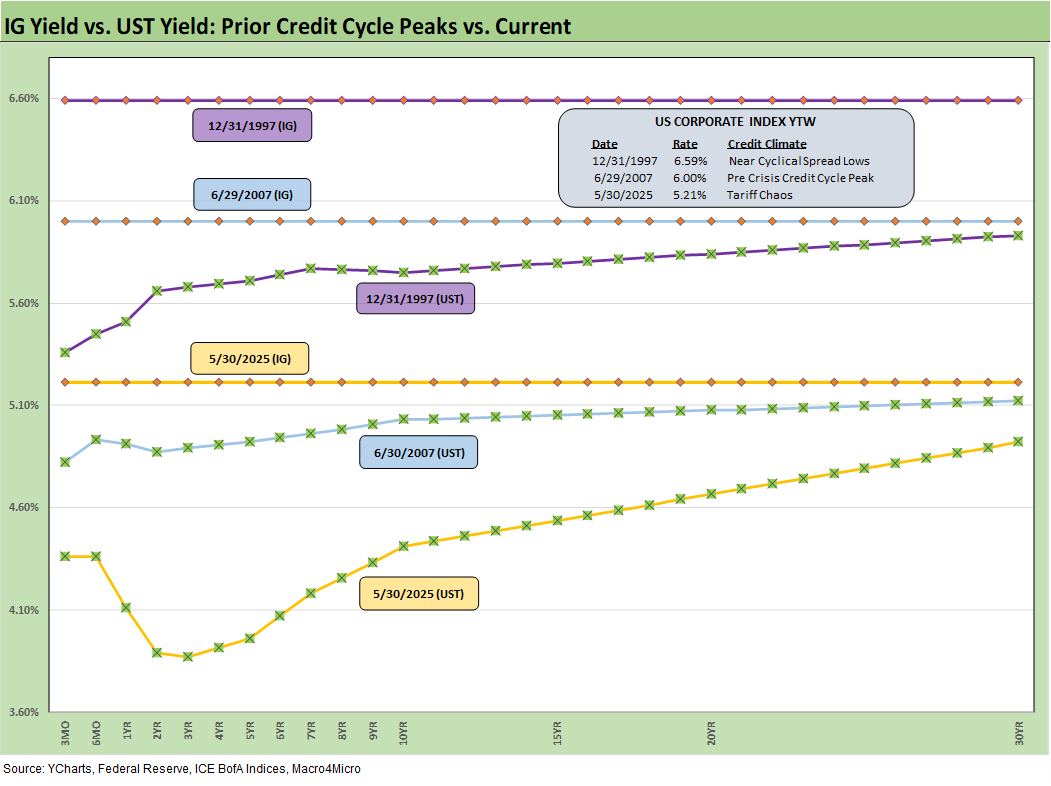
The above frames current IG index yields vs. previous credit peaks along with their respective UST curves. We include both prior credit peaks in June 2007 and Dec 1997 for context as prior peak credit cycles when high risk appetites saw investors chasing yields. Those 1997 and 2000 markets saw poor risk symmetry and low spreads.
Today’s UST curve is still low in those historical credit peak contexts. We just saw a glimpse recently of rising long yields and the return pain that comes with it. Renewed focus on the budget this week will return that risk into focus given the possible size of deficit increase. Stagflation risks stay in the mix with the current market beyond the credit cycle peak after the tariffs, and long dated yields still could go higher with spreads widening again for another round of return pain.
The short to intermediate IG market is still the safest bond game for now. The funds that are asset class constrained to HY can take refuge in the higher quality layers, but overall corporate default risks in HY bonds remain in check.
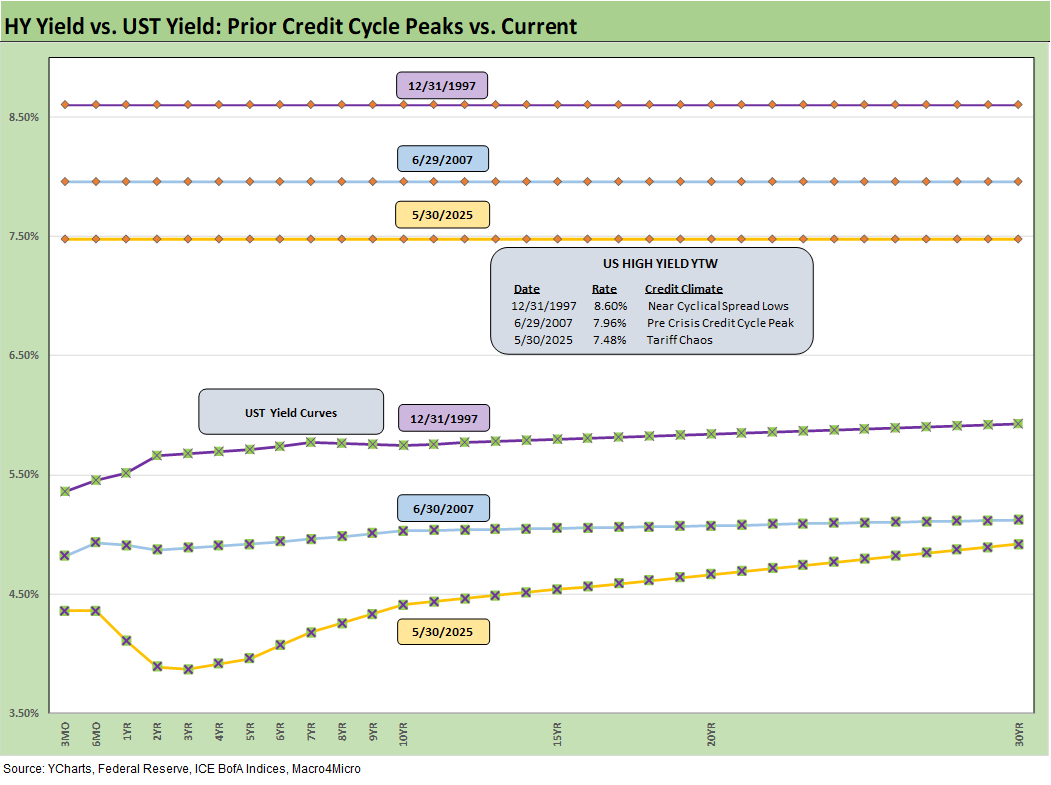
The final chart does the same 1997 and 2007 drill but for HY index yields. This week’s UST move leaves current HY index yields now below prior peak credit cycles at 7.48% vs. 7.96% in June 2007 and 8.60% in Dec 1997. The recent spread widening had moved HY index yields higher, but the recent reversal and rolling UST moves leave the current HY index YTW below both the 2007 peak and 1997 HY index levels.
The widening early this month gave flashbacks to the volatility and major spread moves of the 1997-98 and 2007-08 periods that also posted triple-digit widening months. The sheer speed of risk repricing has happened in earlier cycles even if those moves were for very different reasons.
Finding the catalyst for downside…
The challenge is identifying a fundamental transmission mechanism to more trouble for financial metrics and relative risks of default. Identifying a catalyst for pain now is easy with tariffs hitting the macro drivers (the consumer) and micro drivers (“buyer pays” hits margins or requires higher prices).
The recent tariff strategy is both unpredictable and unprecedented in modern capital markets, but at least the banks are much healthier. The China truce alleviated the immediate risks and now this week brought a fresh round of EU risks that are already in “pause mode” for the time being. Last week ended with a 50% blanket tariff before it was paused. Then this week ended with the Section 232 hike to 50% on steel and aluminum. Those are fighting words.
The overall uncertainty in getting trade deals over the line remains a threat. Reciprocal tariffs could end up being “assigned” again rather than negotiated. The clock is ticking. Those tariffs will still need their day at SCOTUS based on the IEEPA challenge.
We also see higher quality levels in the HY bond index as a starting point vs. 2007 and the late 1990s TMT bubble years. The reality is the tariff impacts and supply-side disruptions are only now just beginning in substance. It is hard to reflect forward-looking risks when so few know (including the White House) what those risks will be as “pauses” start and could get better or worse. China was a rough lesson for the markets.
EU now joins China on the pause clock that can be terminated or extended with ease, but Mexico and Canada have outstanding trade war risk as the effects of the tariff roll in and domestic political pressure picks up for leaders. It is useful for Trump to play his hand as the mood moves him in his own murky game theory plan, but corporate investment, big ticket purchase decisions by consumers, and FOMC policy setting can also take a protracted break beyond the pause.
The bad old days…
Looking back even more, the turn in the credit cycle always comes at some point and often with an external trigger or “assist” that can set it off. During 1990, securities firms started to collapse including Drexel’s Chapter 11 in Feb 1990 and bridge loan related bailouts of Shearson Lehman, First Boston, and Kidder Peabody. We do not face that type of financial intermediary meltdown risk here (at least not yet!). In a protracted stagflation bout, eyes will return to the regional banks.
The summer of 2007 was the start of major problems in the credit markets with asset risk and leveraged counterparty exposure and bank/broker interconnectedness risk soaring. Despite that backdrop that worsened in August 2007, the equity markets and S&P 500 and NASDAQ kept on rallying into Oct 2007. Later in the turmoil and well after the fact, the start of the recession was tagged as Dec 2007 (see Business Cycles: The Recession Dating Game 10-10-22).
The 2007 experience reminded the market that credit leads the cycle and equity lags. The same was true in 1999 with the HY default cycle underway and NASDAQ at +86% that year. This time around, the credit markets did not expect the tariff insanity and is still making up its mind. The real economic effects are more geared to the periods ahead when tariffs will be rolling in at the transaction level. That will be the reality point. We expect HY to stay unhappy and spreads to average wider as the tariffs roll into actual corporate fundamentals.
There are no frictionless wheels in high tariffs. The buyer pays the tariff at customs. How that gets spread around the seller to buyer to customer chain has a lot of moving parts. The “seller pays” and “selling country pays” has been a clear lie from the Trump camp, and he admitted as much when he demanded that Walmart “eat” the tariff cost. Why would there be anything to eat if the seller pays? Shady and misleading discourse is never new to Washington.
The problem is that Trump recently highlighted yet again the hundreds of billions he collected from selling countries. We cannot tell what Trump remembers as a fact and what he made up. Until the tariff deals are put to bed, outsized “surprise risk” in tariffs remains high on the list. Since he breached the USMCA, even a deal is not a reliable deal. Congress has allowed him to declare an emergency at will. Now SCOTUS will need to decide.
See also:
Footnotes & Flashbacks: State of Yields 6-1-25
Footnotes & Flashbacks: Asset Returns 6-1-25
Mini Market Lookback: Out of Tacos, Tariff Man Returns 5-31-25
PCE April 2025: Personal Income and Outlays 5-30-25
Credit Snapshot: Meritage Homes (MTH) 5-30-24
1Q25 GDP 2nd Estimate: Tariff and Courthouse Waiting Game 5-29-25
Homebuilder Rankings: Volumes, Market Caps, ASPs 5-28-25
Durable Goods Apr25: Hitting an Air Pocket 5-27-25
Footnotes & Flashbacks: Credit Markets 5-27-25
Footnotes & Flashbacks: State of Yields 5-25-25
Footnotes & Flashbacks: Asset Returns 5-25-25
Mini Market Lookback: Tariff Excess N+1 5-24-25
New Home Sales April 2025: Waiting Game Does Not Help 5-23-25
Existing Home Sales April 2025: Soft but Steady 5-22-25
Credit Snapshot: Lithia Motors (LAD) 5-20-25
Home Starts April 2025: Metrics Show Wear and Tear 5-19-25
Footnotes & Flashbacks: Credit Markets 5-19-25
Industrial Production April 2025: CapUte Mixed but Time Will Tell 5-15-25
Retail Sales April 25: Shopping Spree Hangover 5-15-25
Credit Spreads: The Bounce is Back 5-13-25
Recent Tariff Commentaries:
US-UK Trade: Small Progress, Big Extrapolation 5-8-25
Tariffs: A Painful Bessent Moment on “Buyer Pays” 5-7-25
Trade: Uphill Battle for Facts and Concepts 5-6-25
Tariffs: Amazon and Canada Add to the Drama 4-29-25
Ships, Fees, Freight & Logistics Pain: More Inflation? 4-18-25
Tariffs, Pauses, and Piling On: Helter Skelter 4-11-25
Tariffs: Some Asian Bystanders Hit in the Crossfire 4-8-25
Tariffs: Diminished Capacity…for Trade Volume that is… 4-3-25
Reciprocal Tariff Math: Hocus Pocus 4-3-25
Reciprocal Tariffs: Weird Science Blows up the Lab 4-2-25