
Footnotes & Flashbacks: State of Yields 6-8-25
We look at another off weak for duration with CPI/PPI teed up for this week and the Big Beautiful Bill under scrutiny.


So, if they charge a 25% tax (or more) at customs on all of this and the buyers write the check, there will be no cost to anyone?! Huh?
The fate of duration heavy assets will hang in the balance this summer as macro releases keep chugging along and the dueling variables of UST supply (deficit funding) and inflation fears (tariff price impacts) will get absorbed by the UST markets.
The slow and steady transaction-level impact of tariffs will flow into working capital cycles, expenses and prices even as a major stream of new Section 232 tariffs get released in the coming days and “reciprocals” hang in the balance with an eventual SCOTUS decision.
The May CPI numbers will get a lot of scrutiny this coming week as CPI and PPI get released. The big spike in aluminum and steel costs will be watched for flow-through impacts with a lot more to come as the clock ticks on import transactions that get embedded in unit costs.
The supply-demand topic for US Treasuries and the highly visible battle in Washington over projected deficits % GDP and US debt % GDP will make it hard to hide from the objective facts that hit the headlines.
Below we update our rolling State of Yields footnotes with data updates and some new commentary woven in.
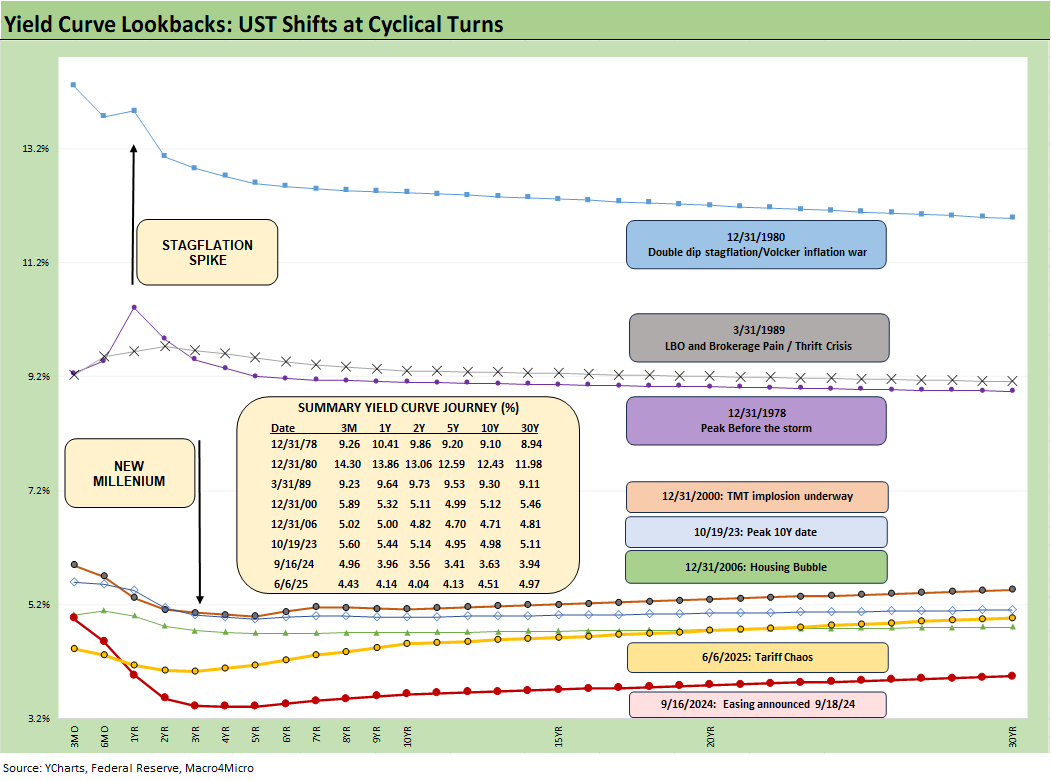
The above chart plots some key cyclical transition periods from the Carter inversion of 1978 across the Volcker years, the1980s credit cycle peak in 1989 (note the 9.2% 3M UST), the TMT cycle faltering in 2000 (on the way to a massive Greenspan easing in 2001), and the housing bubble in 2006 (with leveraged derivative exposure and structured credit out of control) .
The chart then jumps from 2006 to 2023 beyond the crisis period and the ZIRP years and COVID after the Fed went wild to save the capital markets and support the banks. That brought plenty of QE and normalization distortions of the curve shape.
The UST curve as a mixed outlook debate in 2025…
The bullish view for 2025 is that rates are very low today in the context of the pre-ZIRP years. Periods before 2007 had much higher rates on average. The cycles shown presented a mix of severe cyclical downturns and gut-wrenching changes in the structure of the US economy across time. Waves of deregulation from the late 1970s to early 1980s saw the de facto collapse of numerous bellwether industry leaders as the timeline rolled into the start of two decades of bull markets.
The move from the post-Vietnam inflation and oil price shocks of the early 1970s culminated in a brutal double dip recession (1980-1982) and a scarring experience with stagflation (see UST Moves 1978-1982: The Inflation and Stagflation Years 10-18-23).
The stagflation of 1980-1982 eventually flowed into the Reagan boom years and then after a fresh bout of risk-taking excess (1989 credit cycle peak, 1990 recession) before the Clinton years saw impressive bull markets (and a balanced budget). Those were superior economic performances under Reagan and Clinton – by a wide margin – and well ahead of those seen since 2000 (see Trump's “Greatest Economy in History”: Not Even Close 3-5-25, Presidential GDP Dance Off: Clinton vs. Trump 7-27-24, Presidential GDP Dance Off: Reagan vs. Trump 7-27-24).
The post-1990 Greenspan policies and what followed with the post-2000 TMT FOMC support changed the rules of the game. The 9.2% 3M UST ahead of the credit cycle peak in late 1989 (recession started 7/90) saw bridge loan stress and an HY market meltdown into 1990 (Drexel Chapter 11, broker bailouts etc.). The 5% handle 3M UST at peaks in 2000 and 2006 and in 2023 highlight that current rates are still quite low in historical context. The George HW Bush transition years were tough (see UST Moves: 1988-1989 Credit Cycle Swoon 10-20-23).
We see asset bubbles pop (2001, 2007) and even a pandemic (not shown above). Greenspan’s FOMC reactions to the post-TMT bubble support in 2001 became a bigger problem for those next periods of excess that led to 2007 (see Greenspan’s Last Hurrah: His Wild Finish Before the Crisis 10-30-22).
The US markets always came back strong even if the post-Clinton years from GW Bush to Obama to Trump damned the US to “slow and low” growth with high systemic UST debt. Those decades are still a story of remarkable resilience, but it all started with a balanced budget under Clinton and a GOP Congress that leveraged the now elusive concept of bipartisanship. You won’t see either of those again in a very long time (true bipartisanship and a balanced budget).
Up and to the right lives on…
The time-honored “up and to the right” history for equities can keep optimists in the game now, but the combined state of the US sovereign balance sheet, global trade war threats, and authoritarian ambitions are new elements that will be more headwind than neutral. We should note that the market had long stretches of time when equities materially underperformed history (2000 to 2009 with bookend crises and a bubble in-between). The 2008-2009 crisis brought the years when ZIRP and QE became major distorting factors. Rates have usually been a swing factor at cyclical turns.
If you buy into the themes of “This Time is Different,” then high systemic debt levels assure low and slow GDP growth. By assuring eroding consumer purchasing power for goods with tariffs, weak growth is almost assured in tandem with high mortgage rates and consumer financing rates in the quarters ahead. The times when we have seen exceptional growth rates has usually been on the other side of a crisis and very rough stretches. We’ve tended to see very strong years only when coming off very bad years.
For now, we live in a “2% handle economy.” Trump hit an annual GDP growth rate of 3.0% only once in a calendar year while Biden had a 6% handle in 2021 off the COVID bounce. Obama had zero 3% annual GDP years and Bush has two of them (during the 2004-2005 boom).
As noted in the chart above, we use the Oct 2023 UST peak date on the 10Y UST as a key frame of reference. The UST rates now are very low by any historical standard but well above the Sept 2024 lows as we lifted off from the initial easing into another steepener in 2025.
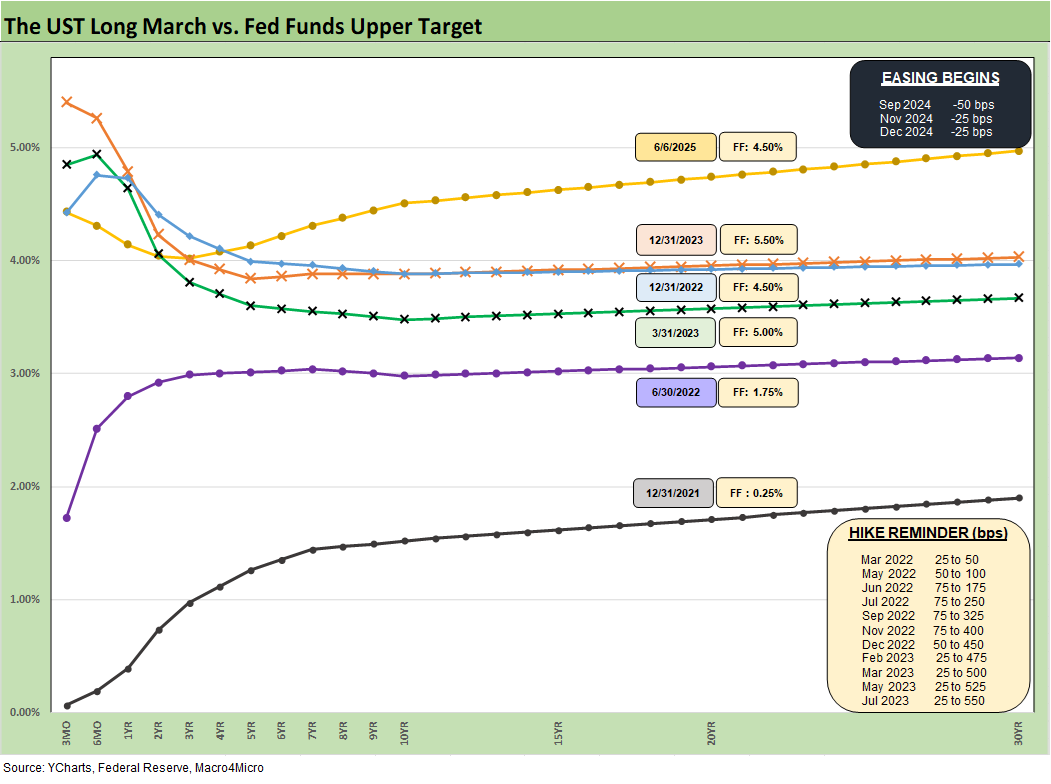
The above replays our weekly chart detailing the migration of the UST curve from 12-31-21 with memory boxes detailing the tightening dates and magnitude and more recently the easing. The UST curve seems to intermittently mix bear steepening patterns and flattening rallies since the Sept 2024 lows, but market fear was creeping into the shapeshifting after Liberation Day before calming down with the reciprocal tariff pause.
We shifted back into the bear steepening along the way while mixing in some mini rallies. The UST curve will not be helped by record supply and shrinking demand, fears around the dollar, and diminished confidence in US governance. We are looking at the highest risk of stagflation since the 1980-1982 double dip, and tariffs will certainly not help.
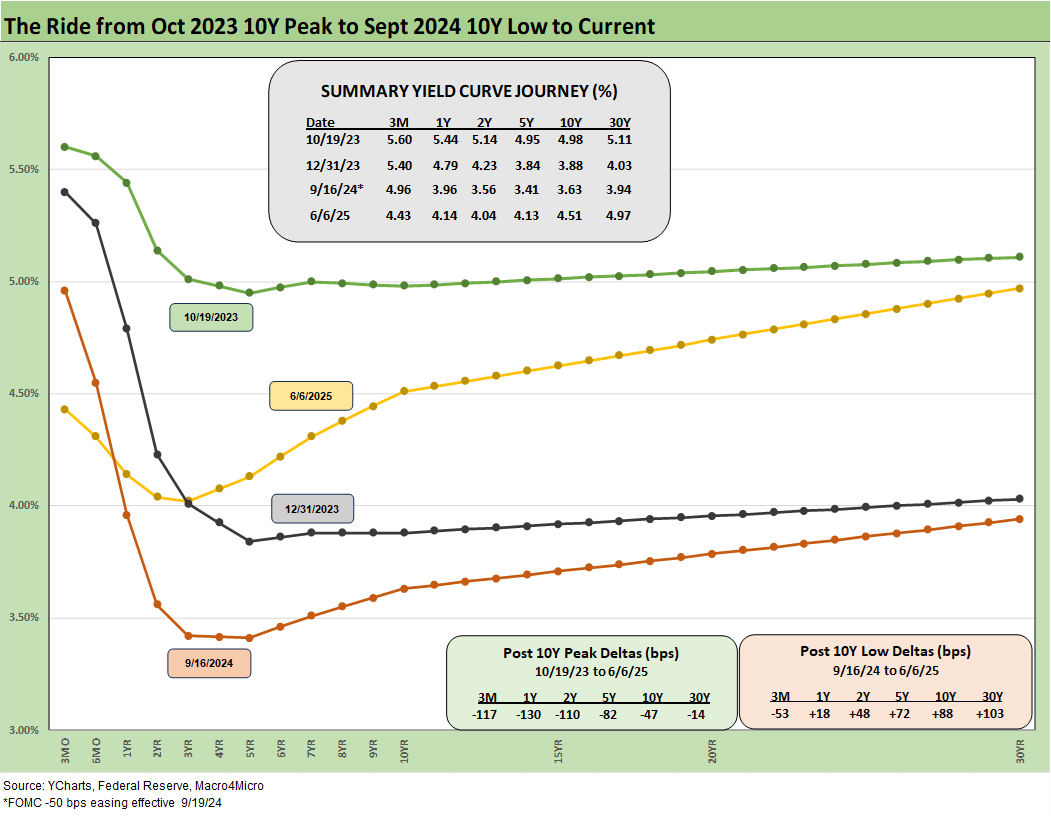
The above chart details the material move from the peak UST curve of 10-19-23 down into the UST bull rally of Nov-Dec 2023 and then eventually into the lows of Sept 2024. The Sept 2024 low tick only came after a bear steepener hit the curve through the summer of 2024. We then moved back into the bear steepener mode until the tariffs roiled the UST markets and initially sent 2Y to 30Y lower on cyclical fears.
The shift higher from Sept 2024 lows and the steepening from the low point at the end of 2023 is in the chart. We see the 10Y and 30Y notably higher with a more normal shape from 2Y out to 30Y. The challenge is still that front end inversion from 3M. This week we look at the 2Y to 10Y UST slope history further below. The inversion anomaly during a protracted expansion has been hard to shake with the FOMC holding the line over tariff-related inflation questions.
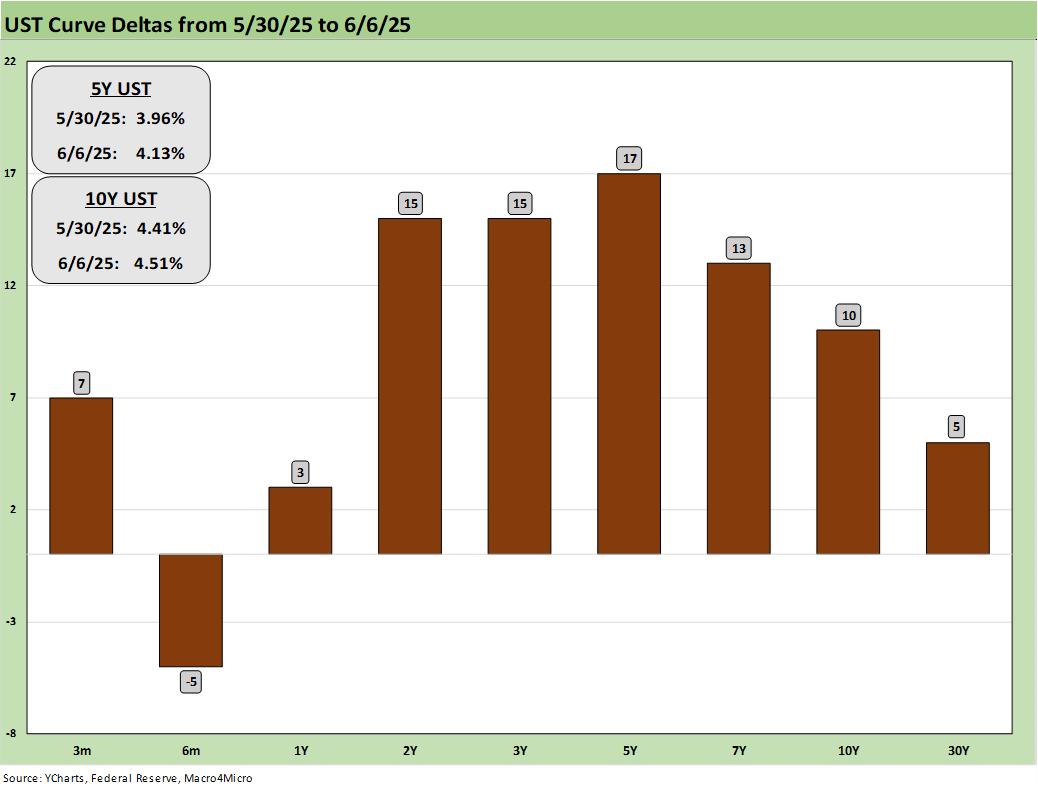
The above breaks out the weekly UST deltas that we already looked at in Mini Market Lookback: Clash of the Titans (6-7-25). The UST curve pushed higher on the week on good economic news with JOLTS and the Payroll numbers both constructive (Payrolls May 2025: Into the Weeds 6-6-25, Employment May 2025: We’re Not There Yet 6-6-25, JOLTS April 2025: Slow Burn or Steady State? 6-3-25).
Meanwhile, the Big Beautiful Bill is seeing its share of headlines with budget hawks staking out extreme positions on how threatening the systemic sovereign debt position could be in the future. Musk also had his share of complaints that sent headlines into a frenzy and rhetoric into the gutter.
The comments on the debt threat may be justified in many cases, but they also will draw a lot of attention from around the world. When our leaders are panicking about debt, the more likely forecast is that the US leverage metrics are heading in the direction of Italy (BBB tier) and are already higher than Spain’s (single A tier rating).
A saying we used to pull out back in 2011 went like this: “A nation is AAA if you run for their debt in a panic. The letters don’t matter. The problem of late is the erosion of faith in the fiscal and economic awareness and governance motives of US leadership. The reality of those various worries (rule of law, corruption, cabinet competence, etc.) show up in USD currency weakness. There are no Ronald Reagans or Bill Clintons around in 2025 to reassure.
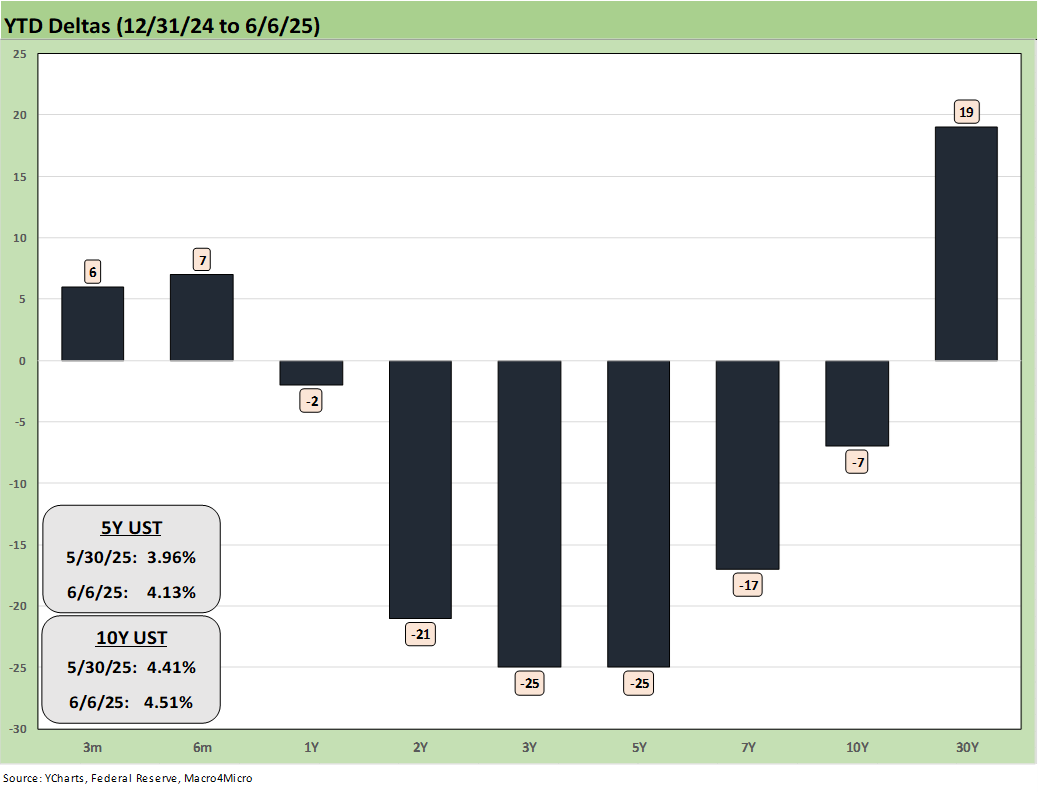
The YTD UST deltas are broken out above. We still see a rally from 2Y to 10Y, but the 30Y relationship has been breaking down in recent weeks. As noted in our separate Asset Returns Footnotes publication, we saw 5 of the 7 bond ETFs we track in positive range YTD and 2 negative (see Footnotes & Flashbacks: Asset Returns 6-8-25). The long duration UST 20+ year ETF (TLT) and the UST ETF (GOVT) were both in the red YTD with the other 5 bond ETFs positive across the ETF tickers SHY, LQD, AGG, HYG, and EMB.
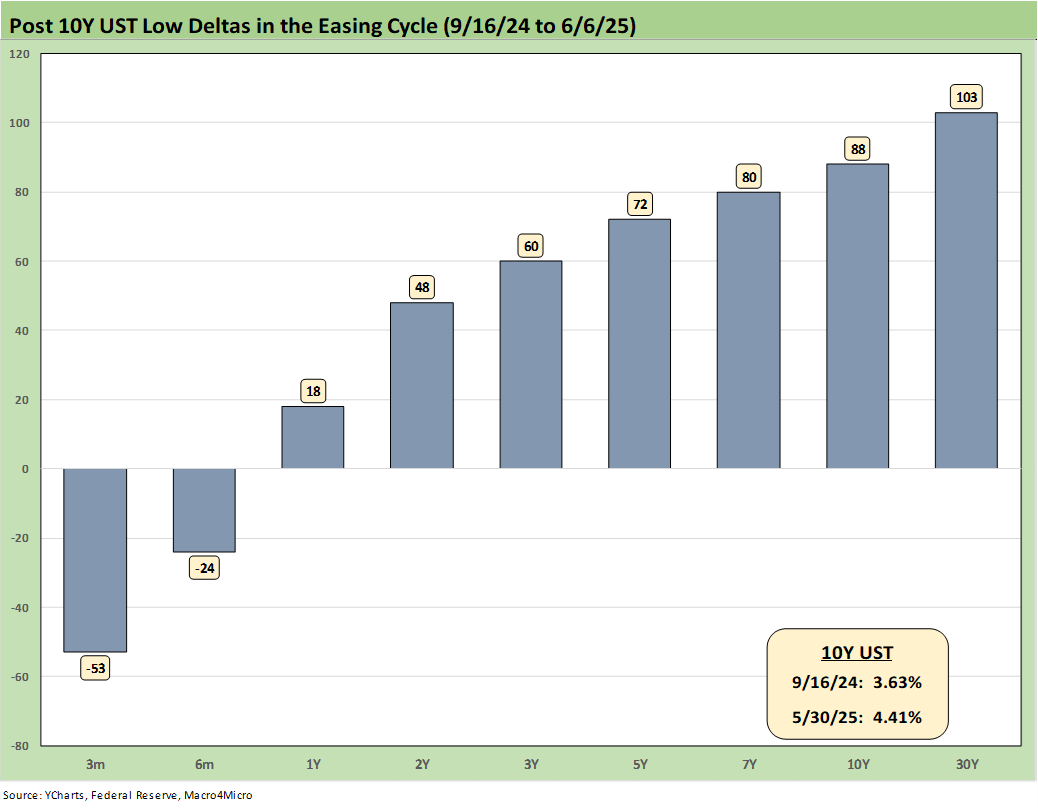
The above chart updates the UST deltas since the 9-16-24 lows that came alongside the easing. That has not worked as many market watchers predicted on the shape of the UST curve and number and pace of easing that was supposed to follow. While Trump rails at the Fed and Powell (this week he demanded 100 bps in cuts), the FOMC would likely be easing if it was not for Trump’s over-the-top and unprecedented tariff game plan.
The risks of an early move without clarity on the final tariff plan and some supportive market-based data could be very costly by compounding the problem and leaving the Fed facing inflation and stagnant growth. The payroll numbers this week lowered the odds of an ease materially as the other half of the dual mandate. We have the next FOMC meeting later this month with the release on June 18. The CME odds for unchanged fed funds in July is 83% while a Sept cut is now only 51% after this week.
The politics of tariffs is one challenge, but the fact remains that this tariff strategy has never been tried in the postwar era or in modern capital markets (for good reason?). That leaves confidence low and market risks high. The White House has not been helpful with its position that tariffs are paid by the selling country. That is a view they have voiced for too long. For those who do not know the facts (buyer/importer pay customs) it takes few clicks to read sea level industry commentary or even just the Fed Beige Book or commentary from manufacturing groups (e.g., National Association of Manufacturers or Chamber of Commerce).
“Selling country pays” and Trump claiming he “collected hundreds of billions of tariffs from selling countries” became a political loyalty test like “I won the election in 2020” and “Trump 1.0 was the greatest economy in history.” Facts don’t support these claims.
For a few samples:
May 2025 Beige Book: “All District reports indicated that higher tariff rates were putting upward pressure on costs and prices…However, contacts’ responses to these higher costs varied, including increasing prices on affected items, increasing prices on all items, reducing profit margins, and adding temporary fees or sur charges. Contacts that plan to pass along tariff-related costs expect to do so within three months.”
Excerpt from Chamber of Commerce: “The sudden imposition of the 25% EU steel tariff… (note from editor: now 50%) “…”was a harsh setback for my small company, hitting my sea freight order, which arrived days after the tariff was introduced, with an unexpected $8,700 charge on top of the normal customs fees I pay. A big hit for a small, family-run business.”
Excerpt from National Association of Manufacturers: “According to another recent NAM survey of its members regarding the impact of tariffs on manufacturers, 87% of small and medium-sized manufacturers indicated that they may need to raise prices, and one-third could slow hiring.” From 1Q25 survey: “Manufacturers expect raw material prices and other input costs to rise 5.5% over the next year. This marks the highest anticipated rate of increase since Q2 2022, when inflation hovered between 8% and 9%.
The intense political flavor that tariffs have taken on tend to convince Congressional leaders to do what they usually do, which is deny facts and curry favor. The same is true in Cabinet positions these days, which was not usually the overriding qualification when you select a cabinet.
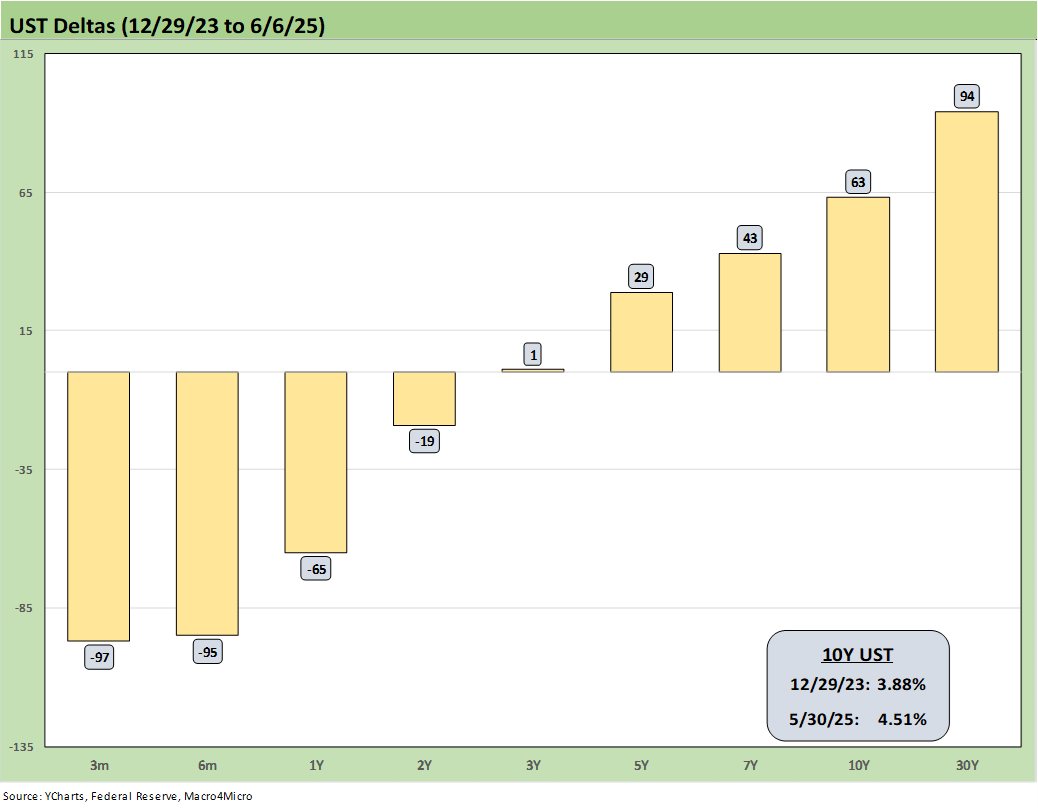
The above chart updates the UST deltas from the end of 2023 after a massive rally in rates and risk in Nov-Dec 2023. The follow-on in 2024 expected by the consensus mildly disappointed the UST bulls in the number of FOMC cuts (the market got 4 x 25 but not the number of 5 to 6 FOMC 25 bps cuts expected). The expectation of a pronounced bull flattening during 2024 also did not play out as expected when a bear steepener prevailed by the end of the year.
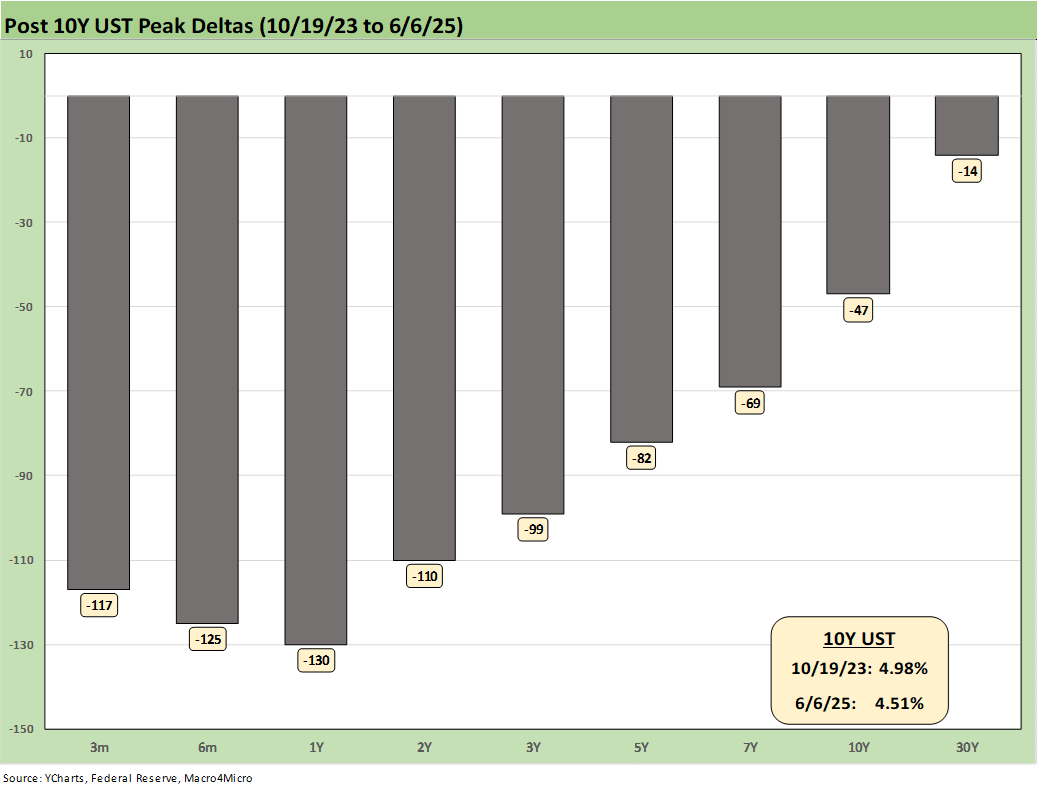
The above chart updates the running UST deltas from the 10-19-23 peak date of the UST 10Y when it barely missed the 5.0% line. For those looking for a frame of reference on what a bad move in inflation metrics might mean, these deltas at least offer a recent set of data points during an inflation fighting year such as late 2023 and into 2024 (until Sept 2024 began the easing process). That is why we keep revisiting that timeline. It reminds us what reversion could mean.
These rally deltas could reverse in part or in whole with the wrong inflation outcomes. We don’t need to see 2022 again, but the old saying “It happened before, it can happen again” resonates for many.
Losing a rally of -47 bps in the 10Y UST above would hurt the mortgage market and would lead to a material valuation headache in equities, M&A economics, and capital project planning. Mortgages have been a drag on housing (new and existing home sales). The risk of inflation heading the wrong way would do more damage. Stubborn rates or higher rates in the short end to 5Y would damage consumer durables financing and related volumes.
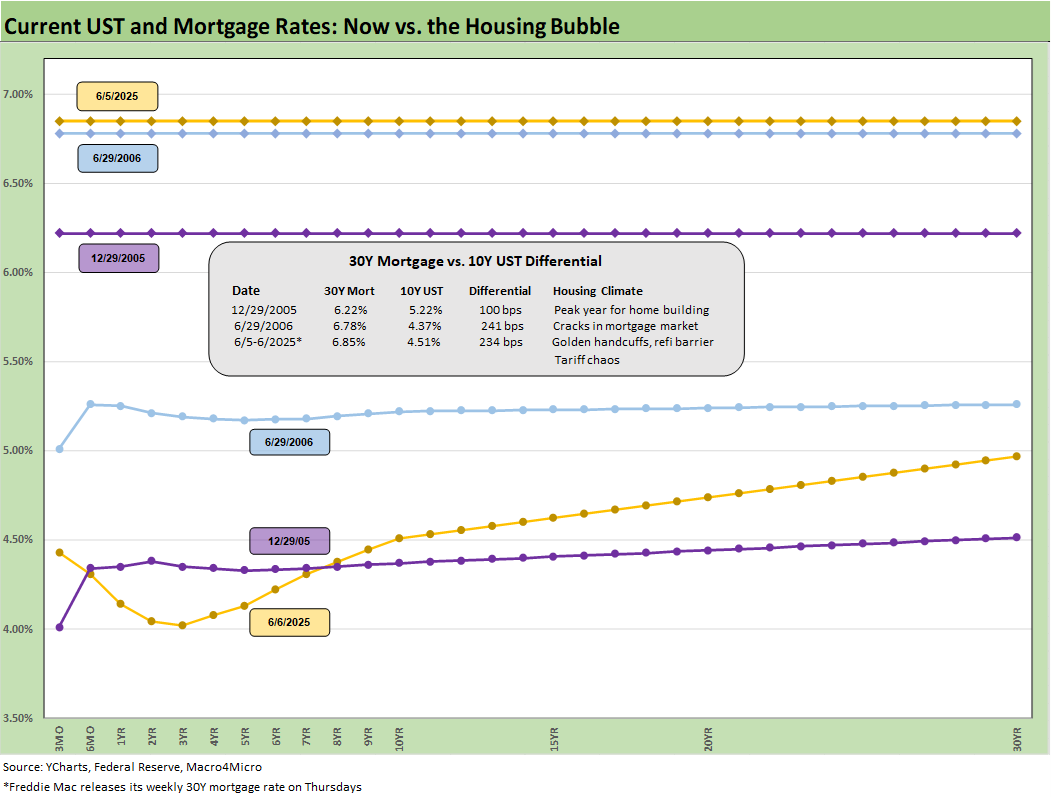
The above chart is one of those replay slides we update each week. This one posts the UST curve for this past Friday and the Freddie Mac 30Y Mortgage benchmark rate (noon Thursday release). We include two useful historical periods including the peak homebuilder year end of 2005 and mid-2006 when RMBS quality concerns were catching headlines as the housing bubble was peaking.
We post UST curves for each period in the chart. The past week saw rates move lower to 6.85% from 6.89% last week and from 6.86% the prior week. We have seen minor moves recently after a 200 bps range since fall 2023. The Mortgage News Daily survey ended Friday at +6.97%.
We include a column above detailing the differential between the Freddie Mac 30Y and the 10Y UST. That differential moved lower this week to +234 bps from +248 bps last week and from +235 bps the week before. The year 2005 posted a differential of only +100 bps and makes a statement on what the mortgage market was like in 2005. The mortgage market was very hot back then in the housing bubble as mortgage volumes soared during that peak homebuilding year and a very busy period of refinancing was running alongside as a source of funds for homeowners.
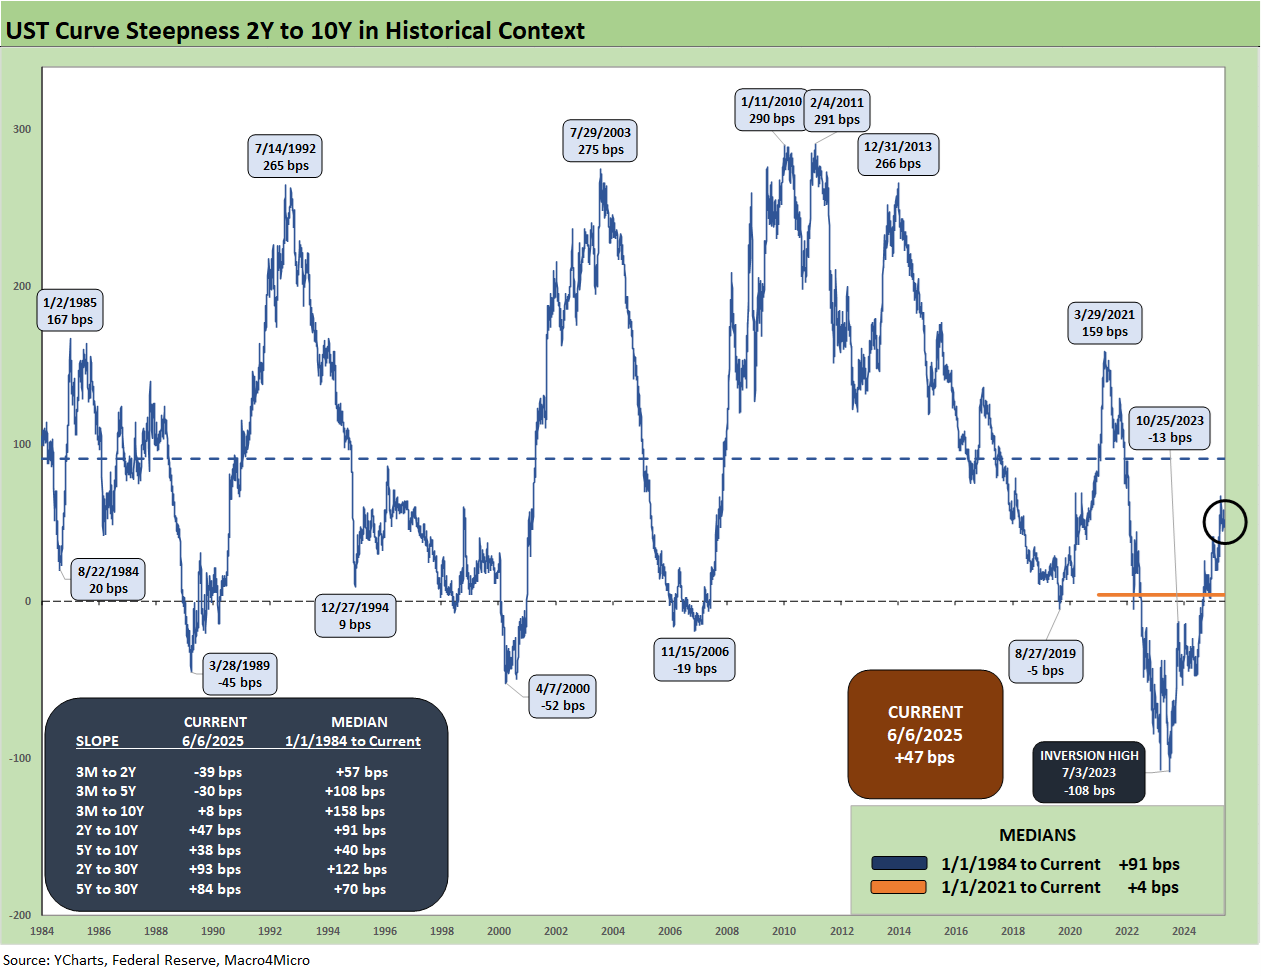
This week we update the 2Y to 10Y UST slope history from 1984. We see the current slope at +47 bps vs the long-term median of +91 bps. We are a long way from the peak inversion of -108 bps in July 2023. We also include the other UST segment slopes we like to watch in the box embedded in the chart. Upward sloping and some positive term premium is at least getting back closer to normal with an upward sloping UST beyond 2Y UST.
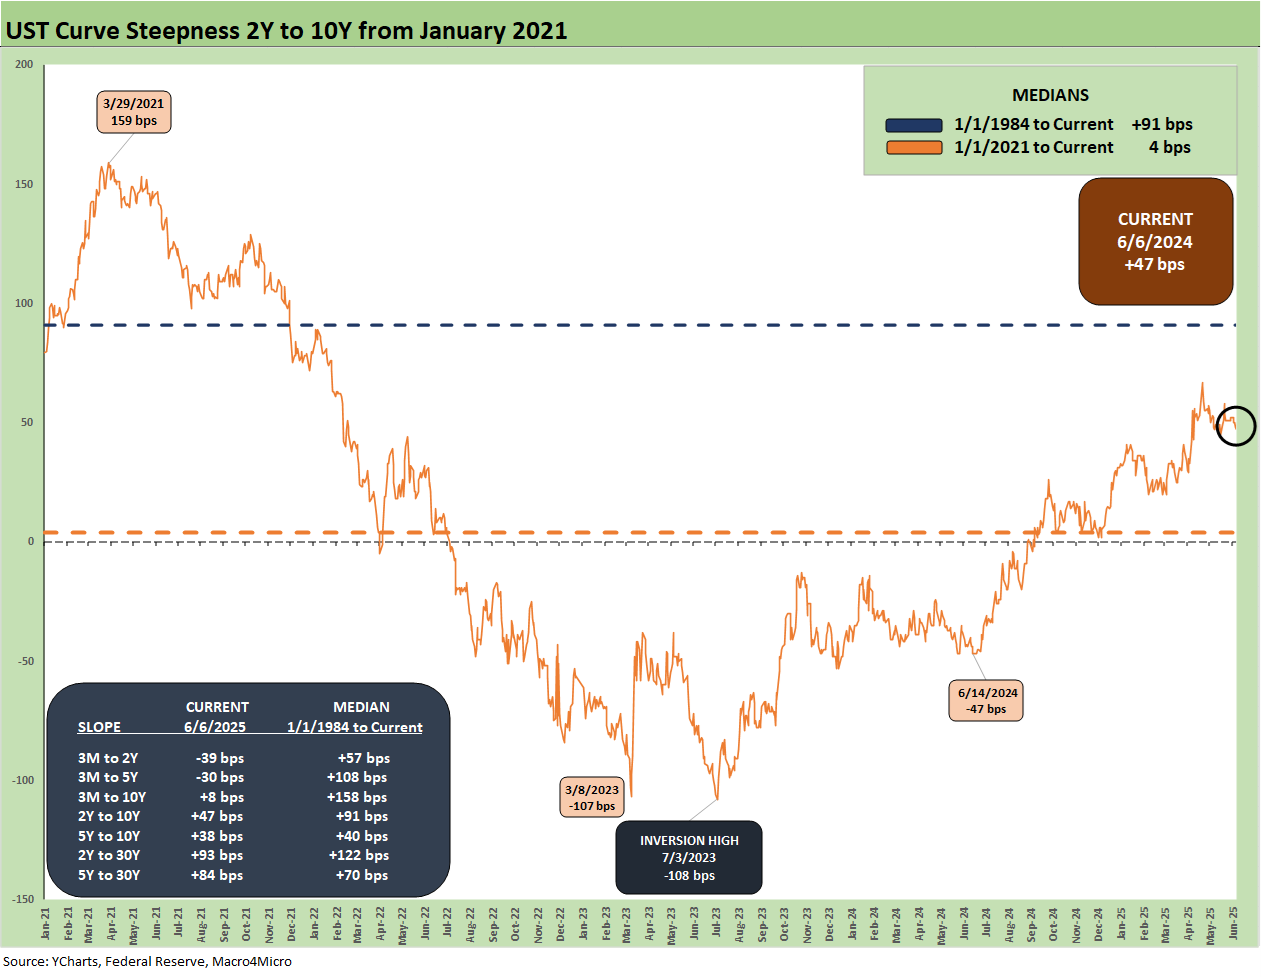
We shorten up the timeline for the 2Y to 10Y UST in this chart rom early 2021 and the days on ZIRP for a more granular view of the 2Y to 10Y ride across the inflation bout, the tightening cycle, and the early stages of easing. We see the +159 bps slope peak in March 2021 on the way to the peak inversions in March 2023 (-107 bps) and then back down to -108 bps in July 2023. The March to July 2023 period had some UST whipsaws around the regional bank crisis.
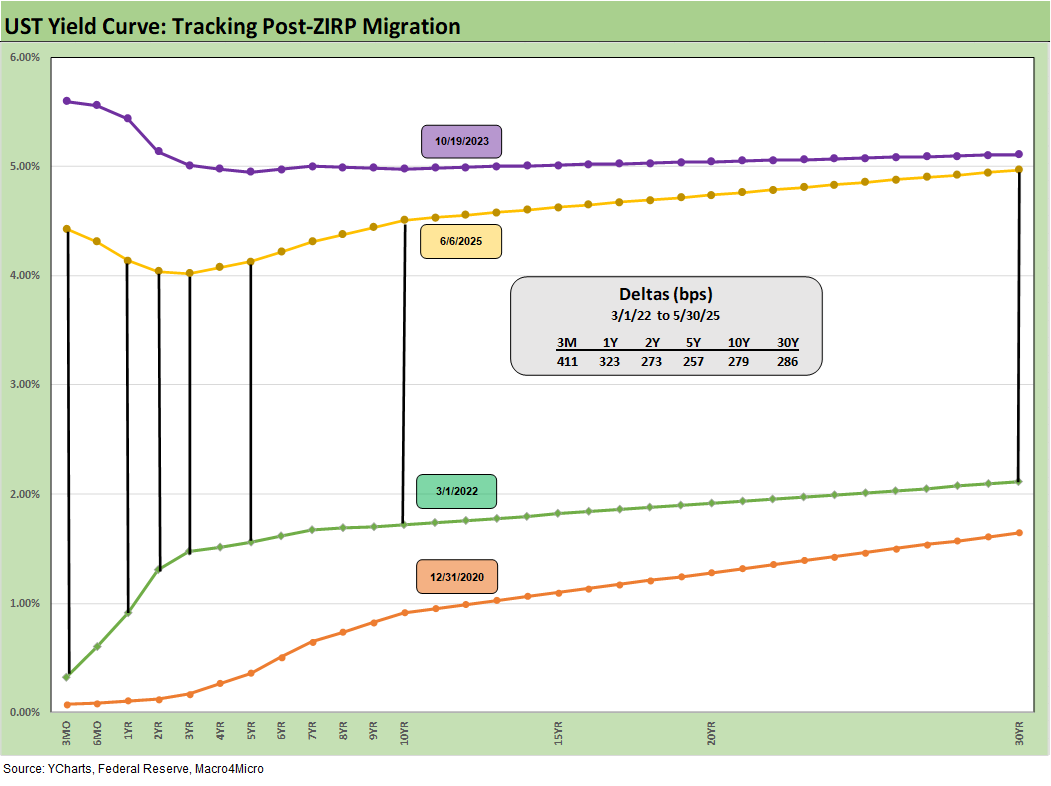
We wrap this week’s State of Yields with an update of the running UST deltas since March 1, 2022 just ahead of the end of ZIRP (effective 3-17-22). We include the 12-31-20 UST curve and 10-19-23 peak UST curve as frames of reference.
See also:
Footnotes & Flashbacks: Asset Returns 6-8-25
Mini Market Lookback: Clash of the Titans 6-7-25
Payrolls May 2025: Into the Weeds 6-6-25
Employment May 2025: We’re Not There Yet 6-6-25
US Trade in Goods April 2025: Imports Be Damned 6-5-25
Past-Prologue Perspective for 2025: Memory Lane 2018 6-5-25
JOLTS April 2025: Slow Burn or Steady State? 6-3-25
Tariffs: Testing Trade Partner Mettle 6-3-25
Footnotes & Flashbacks: Credit Markets 6-2-25
Mini Market Lookback: Out of Tacos, Tariff Man Returns 5-31-25
PCE April 2025: Personal Income and Outlays 5-30-25
Credit Snapshot: Meritage Homes (MTH) 5-30-24
1Q25 GDP 2nd Estimate: Tariff and Courthouse Waiting Game 5-29-25
Homebuilder Rankings: Volumes, Market Caps, ASPs 5-28-25
Durable Goods Apr25: Hitting an Air Pocket 5-27-25
Mini Market Lookback: Tariff Excess N+1 5-24-25
New Home Sales April 2025: Waiting Game Does Not Help 5-23-25
Existing Home Sales April 2025: Soft but Steady 5-22-25
Credit Snapshot: Lithia Motors (LAD) 5-20-25
Home Starts April 2025: Metrics Show Wear and Tear 5-19-25
Industrial Production April 2025: CapUte Mixed but Time Will Tell 5-15-25
Thank you for a comprehensive article.
For any1 interested, here are my May CPI estimates:
https://arkominaresearch.substack.com/p/may-2025-cpi-forecast?r=1r1n6n