
Producer Price Index Feb 2026: Getting Warmer
PPI rattled the market by coming in high, but the bigger worry is what was low in Feb 2026 but clearly set to go higher.


Throw some more line items on the fire…
We look at some key line items in a PPI release that never lacks for a massive wave of data to review from broad categories in Table 1 to adjusted and very granular line items in Table 2. Services remain a headache with Final Demand Services at 3.8% and 68% of the Final Demand-weighting while Final Demand Goods were more muted at +2.5% despite a sharp MoM rise from Jan to Feb.
Table 2 offers a wide range of commodity groupings including food to metals with some eyepoppers such as +48.0% in “fresh and dry vegetables” and +34.4% in ‘nonferrous metals.” Some of these trends were in evidence in CPI and PCE data (see PCE Inflation Jan 2026: Personal Income & Outlays 3-13-26, CPI Feb 2026: It’s Making You Wait… 3-12-26).
Food and energy will be the ones to watch with Food facing multiple pressures from Iran fallout in their production chain and other major factors that will be hitting inputs (shipping, labor, tariffs, etc.). PPI lines in this release show “roasted coffee” at +25.8%, “beef and veal” at +13.0%, fish/shellfish at +12.2%, and confectionery end products of +8.2%. On a bright note, Eggs PPI is down by -80.4% after Trump cured the Avian Flu.
Final Demand Energy PPI posted -0.7% YoY and Final Demand Food stood at -0.3% YoY. Both of these supportive deflation lines clearly look vulnerable to disruptions and notably in oil and gas markets, fertilizer, and transport cost pressures as we look ahead to the rest of 2026.
With the FOMC unchanged on fed funds today, FedWatch odds looking more like late fall timing on cuts. Inflation appears set to rise on energy, food, and goods as tariff pricing decisions weigh in. Warsh will be greeted with unfriendly numbers barring very favorable developments in Iran and on the tariff decision front that are hard to confidently handicap. Payroll weakness may help the easing crowd, but more than a single cut would mean the inflation metrics are moving lower and the markets getting great news on productivity.
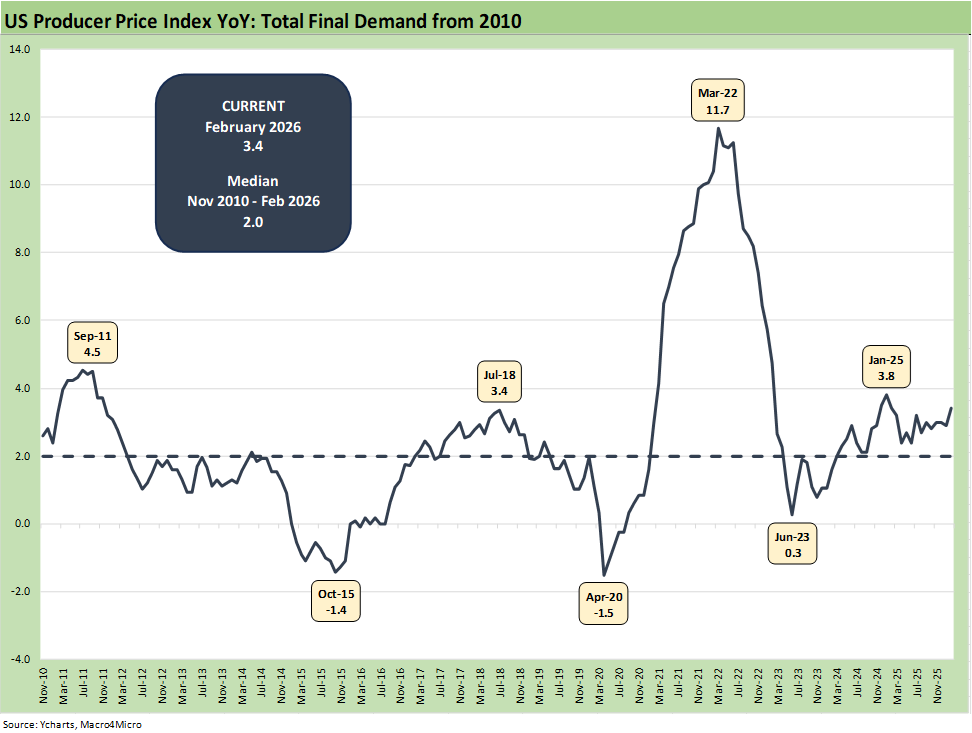
The above March 2022 chart updates the total Final Demand PPI from Nov 2010 to Feb 2026 with the latest Final Demand reading at +3.4% YoY. We see the sharp move higher in the post-COVID rebound running into widespread supply-demand imbalances into a March 2022 peak. For those who remember the obscene inflationary effects from commodities to used cars, there was a more complicated array of forces weighing in than political spin would suggest. We look at that policy-intensive period in detail in our PCE updates (see PCE Inflation Jan 2026: Personal Income & Outlays 3-13-26).
The late February 2022 invasion of Ukraine was a key driver of an oil and gas spike that has some relevance to today. We often highlight how Trump never mentions Putin as a major factor in the inflation picture (only Biden and Powell). The Final Demand PPI for Energy in March 2022 spiked to +36.7% (data source: the original March 2022 PPI release). At that time, Gasoline hit 59.9% PPI YoY with diesel at 63.8%, home heating oil at 105.9%, LPG PPI over 91%, and “residential natural gas” at +22.8%.
Such moves in energy flow into goods and services across a range of time lags depending on price strategies, working capital cycles and regulatory actions. We look back at the 2022 experience as a reminder of what kind of chaos can unfold along the PPI chain as weeks go by in an oil and gas shock.
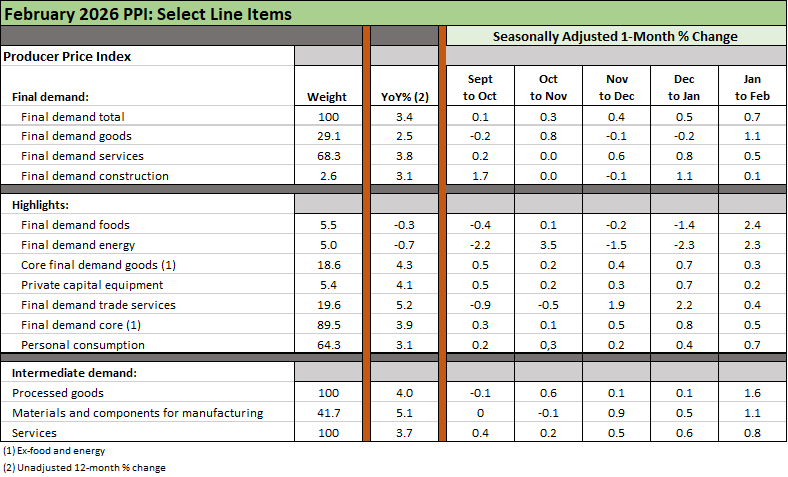
The above table breaks out some of the high-level lines we like to watch from Table 1 of the PPI release. We also do the usual “following the scrolling finger” approach in Table 1 and Table 2 under the “Unadjusted 12-month % change” column.
When you flag those YoY numbers, then next step is flagging the highest YoY numbers and looking for outlier months vs. steady high patterns. The trend line of PPI pressure requires a look at recent months to see if the bad news is evident in 2026. We will be getting some of that pressure in the March 2026 PPI numbers as the Iran War unfolds.
In recent months, we see Services posting 3 consecutive high months. Goods posted a high MoM in Feb of +1.1% and so did Final Demand Foods at +2.4% and Energy MoM at +2.3%.
See also:
Industrial Production Feb 2026: Capacity Utilization 3-16-26
Market Lookback: The Gulf of Cause and Effect 3-15-26
Market Commentary: Asset Returns 3-15-26
PCE Inflation Jan 2026: Personal Income & Outlays 3-13-26
GDP 4Q25 Second Estimate: Sharp Move Lower 3-13-26
Housing Starts Jan 2026: Total Starts Up, Completions Up, Permits Down 3-12-26
CPI Feb 2026: It’s Making You Wait… 3-12-26
Existing Home Sales Feb 2026 3-10-26
Market Commentary: Asset Returns 3-8-26
Payrolls Feb 2026: Into the Weeds 3-8-26
Employment Situation Feb 2026: Payrolls Get Ugly 3-8-26
VIX: Market Still Not Getting the Vapors 3-6-26
Meanwhile…Back in Economics and Tariffs 3-2-26
2025 trade Deficits: Reality vs. Rhetoric 2-19-26
2025 Spread Walks and Multicycle Return Histories 1-5-26
Annual Return Differentials: HY vs. IG Across the Cycles 1-3-26