
Industrial Production Feb 2026: Capacity Utilization
Industrial production and “cap ute” were essentially flat in Durables and Nondurables MoM but mixed by industry.


Industrial production in Feb 2026 was up +1.4% YoY but slightly positive MoM at +0.2%. Capacity utilization for total manufacturing was flat MoM at 75.6%, which is well below the long-term median of +78.2%.
In the context of recent quarters, manufacturing capacity utilization was ahead of 4Q25 but slightly below 3Q25 and flat to 2Q25. Durables was running slightly ahead of 2025 run rates.
Strong MoM moves in “Motor Vehicles and Parts” as well as “Electrical Equipment, Appliances and Components” sent good signals in Durables while “Machinery” faded.
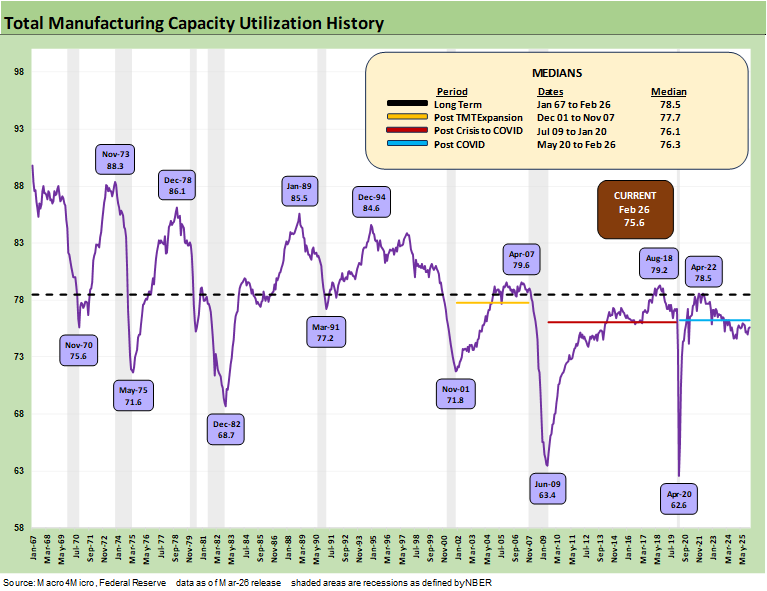
The above time series updates the long-term history of manufacturing capacity utilization since 1967. We see the material swings across expansion booms and busts. That includes the aftermath of some highly damaging oil spikes as capacity utilization later plunged. There was a lot more structural changes underway in those cycles than just oil and gas price pressures.
The May 1975 low of 71.6% was just as the economy was coming out of the late 1973 to early 1975 recession that unfolded after the Arab Oil Embargo. The 1980-1982 double dip recession came after the 1979 inflation spike took off with the Iranian oil crisis. Capacity utilization saw a 68.7 low in Dec 1982 as the economy was just coming off the recession trough. The first Gulf War came after the August 1990 invasion of Kuwait with capacity utilization hitting a low in March 1991 at 77.2, which is above where capacity utilization stands now in 2026.
The age of tech and credit excess in the late 1990s brought some new swoons with 71.8 in Nov 2001 after the TMT meltdown and HY default wave. Then came the post-credit crisis low of 63.4 at the recession trough in June 2009. COVID edged that one out with a record low of 62.6 in April 2020.
As we detail below in the recession histories, the idea of what is low or high capacity utilization in the context of corporate sector profitability is not as direct as one might think. Breakeven volumes, cost structures and pricing power are key drivers. The tariff excess as a core Trump policy only makes that unit cost analysis more complicated as we head into a new round of energy related cost pressures in 2026.
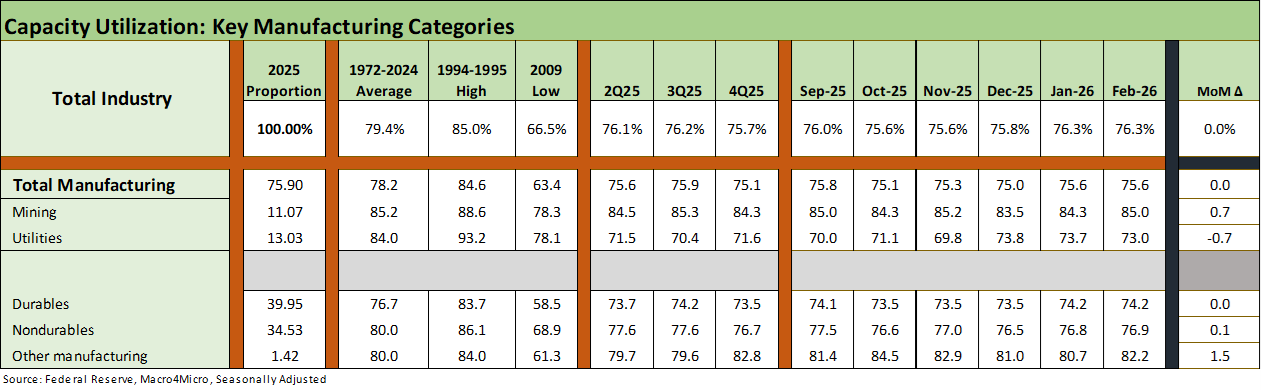
The above table breaks out the high-level groupings with total industry and total manufacturing flat. Mining ticked up and Utilities down for the month. We see Durables and Nondurables as the main events to track and especially the Durables sectors with all of its supplier chain to OEM multiplier effects.
Looking back from 2025 into early 2026, we see Manufacturing in a narrow range and the same for Durables. Tariffs have not moved the production needle much at all so far, but that does not tell the profitability story on the tariff cost impact. Most people (outside the White House) know that buyers/importers write the check for the tariff, so that implies a higher breakeven volume or some offsetting action on other costs or pricing. Those impacts will only play out over time across working capital cycles.
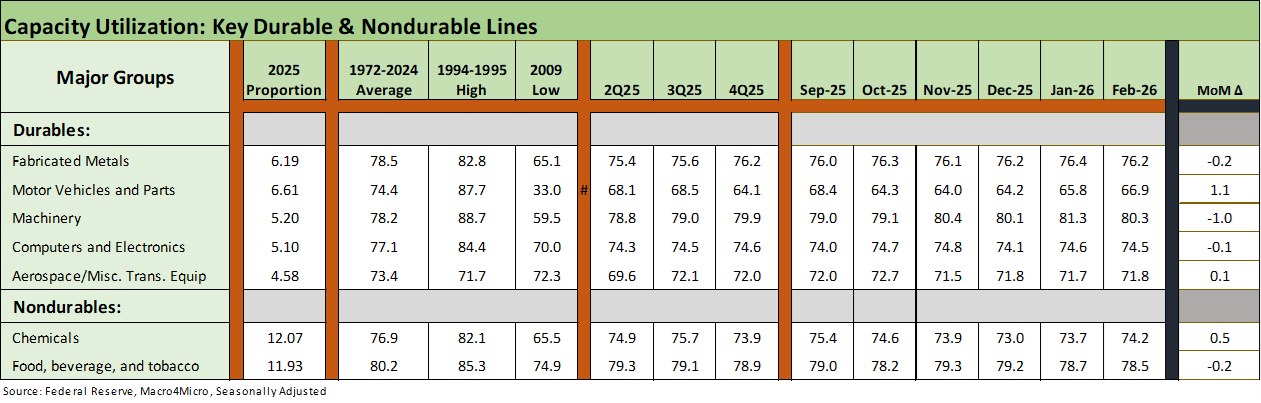
The above table breaks out the details for the top 5 Durables lines and the two largest Nondurables lines. We see a mixed picture across these major industries with only Motor Vehicles and Parts making a notable move higher and Machinery lower. We see 3 of 5 Durables lines tick lower and the two major Nondurables lines were a split decision. Chemicals rose and Food & Beverage declined.
The consumer story and the corporate sector capex optimism will be important to watch in coming weeks and months as guidance gets updated and the Iran fallout starts to flow into strategies from global players to small and midsized enterprises.
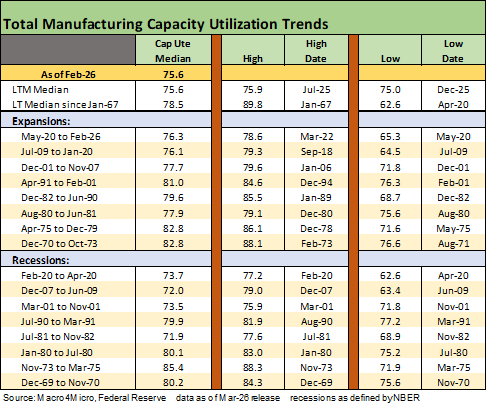
The above table updates the capacity utilization history for expansions and recessions. As we routinely discuss, the ability of companies to generate solid profits at lower capacity utilization in today’s markets relative to past cycles is tied to both automation and the evolution of low-cost global supplier chains. Low-cost supplier chains are getting undermined by tariffs, so the demands to improve efficiency as tariff mitigation measures need to be monitored. The “AI story” and what it all means for productivity and headcount will be a big part of that theme.
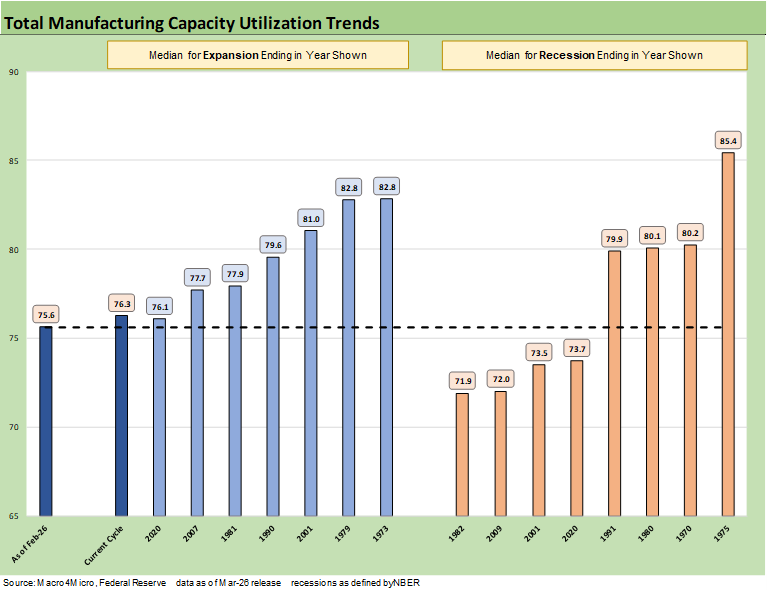
The above chart details economic expansion and recession averages and lines them up by height as a frame of reference. We see the current level on the left at 75.6%.
In the context of the tariff priorities and reshoring ambitions, the slack capacity implied by the chart underscores the analysis is a lot more complicated than just “build more plants.” That is a story told on an industry-by-industry basis. The multiplier effects are important but the relocation of supplier chains and OEM relocation is very slow to unfold. Autos are the main relocation stories, but that is generally to existing infrastructure and not new greenfield plants.
See also:
Market Lookback: The Gulf of Cause and Effect 3-15-26
Market Commentary: Asset Returns 3-15-26
PCE Inflation Jan 2026: Personal Income & Outlays 3-13-26
GDP 4Q25 Second Estimate: Sharp Move Lower 3-13-26
Housing Starts Jan 2026: Total Starts Up, Completions Up, Permits Down 3-12-26
CPI Feb 2026: It’s Making You Wait… 3-12-26
Existing Home Sales Feb 2026 3-10-26
Market Commentary: Asset Returns 3-8-26
Payrolls Feb 2026: Into the Weeds 3-8-26
Employment Situation Feb 2026: Payrolls Get Ugly 3-8-26
VIX: Market Still Not Getting the Vapors 3-6-26
Meanwhile…Back in Economics and Tariffs 3-2-26
2025 trade Deficits: Reality vs. Rhetoric 2-19-26
2025 Spread Walks and Multicycle Return Histories 1-5-26
Annual Return Differentials: HY vs. IG Across the Cycles 1-3-26