
Market Commentary: Asset Returns 3-30-26
With another escalation countdown underway, the stakes get higher, the performance worse, and credibility strained.


It will only be a small, brief holy war! Trust me.
The asset return performance in 2026 has been ugly with a raft of negative numbers in tech and negative impacts on duration.
Unfavorable YTD UST curve shifts throw the favorable move of 2025 into reverse with sharply higher mortgage rates a threat to housing (see UST Deltas: Elevation Realities 3-29-26). We see bouts of UST curve relief (including today) as the handicapping ebbs and flows.
A wide array of energy related household costs and price threats could undermine consumer health, spending appetites, and GDP growth after a poor set of 4Q25 growth numbers (see GDP 4Q25 Second Estimate: Sharp Move Lower 3-13-26).
The stagflation threat remains real, and the juggling act of inflation vs. payroll fears and cyclical growth setbacks make for a very challenging set of conditions for the FOMC, which has seen the predictability of policy thrown into a state of disarray with Warsh facing a big challenge when he eventually gets in front of a confirmation process.
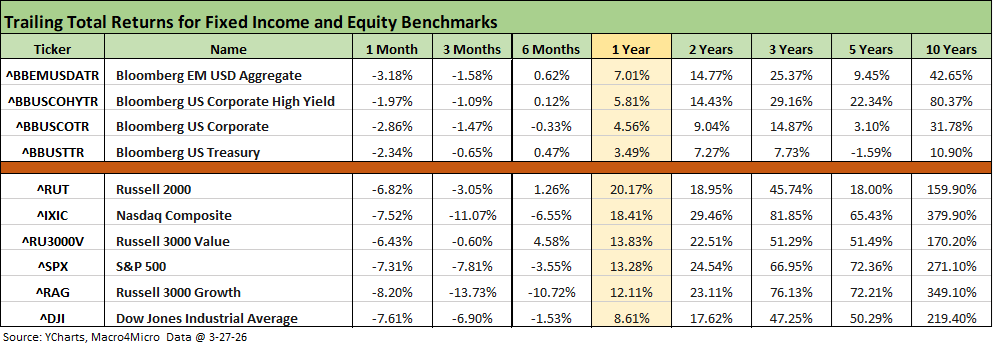
The update of the high-level debt and equity benchmarks captures the obvious pain of 2026 with all negative numbers for 1-month and 3-month timelines for both debt and equity. Tech and growth stock returns in the chart are especially ugly with double digit negative returns for the NASDAQ and Russell 3000 Growth lines.
The recent correction headlines for the Dow, NASDAQ and Russell 2000 raise the question of whether the S&P 500 will get there in the holiday-shortened week. The S&P 500 closed Friday only down by -8.74% from the late January peak. The “buy the dip” discussions will be a recurring feature until the escalation risk plays out to a finish.
The rolling return visual
In the next section, we get into the details of the 32 ETFs and benchmarks for a mix of trailing periods. Below we offer a condensed 4-chart view for an easy visual on how the mix of positive vs. negative returns shape up. We see it as a useful exercise in looking for signals across industry groups and asset classes.
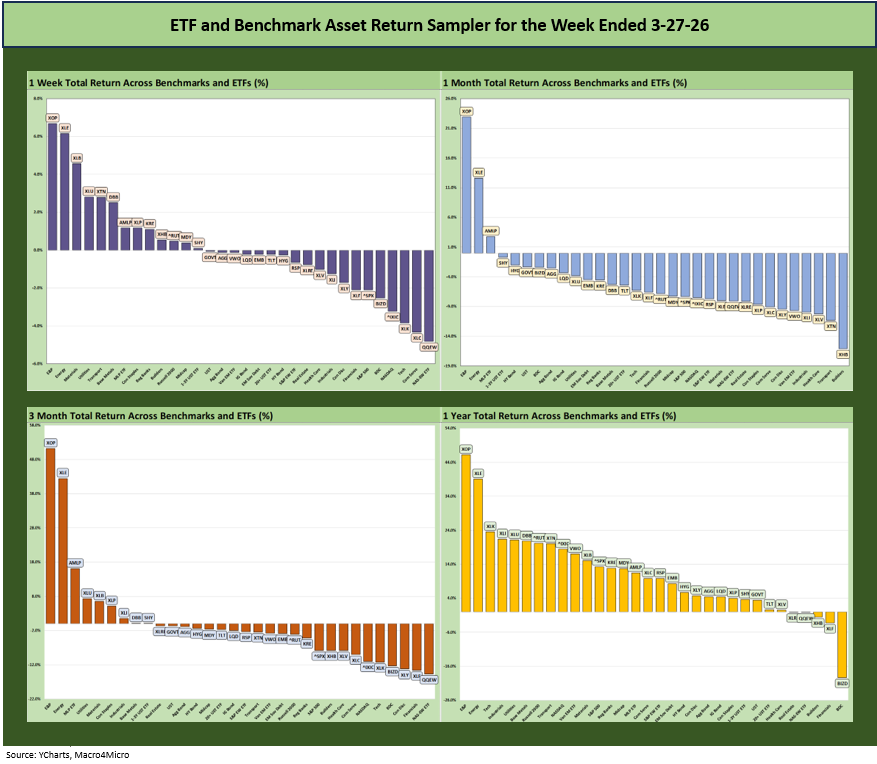
The positive vs. negative symmetry has been grim over the 1-week, 1-month, and 3-month horizons. We see the weak numbers in 2026 starting to eat into the still favorable 1-year returns.
The Magnificent 7 heavy ETFs…
Some of the benchmarks and industry ETFs we include have issuer concentration elements that leave them wagged by a few names. When looking across some of the bellwether industry and subsector ETFs in the rankings, it is good to keep in mind which narrow ETFs (vs. broad market benchmarks) get wagged more by the “Magnificent 7” including Consumer Discretionary (XLY) with Amazon and Tesla, Tech (XLK) with Microsoft, Apple, and NVIDIA, and Communications Services (XLC) with Alphabet and Meta.
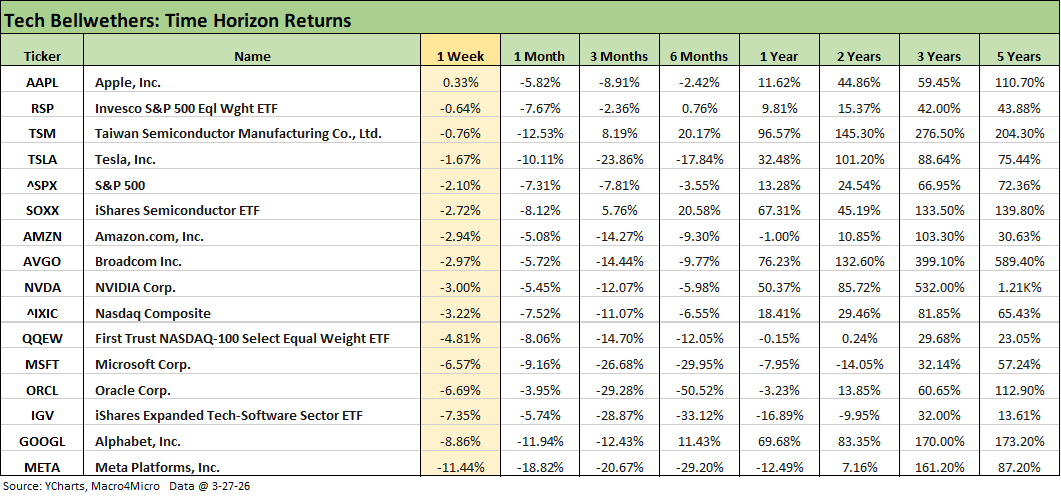
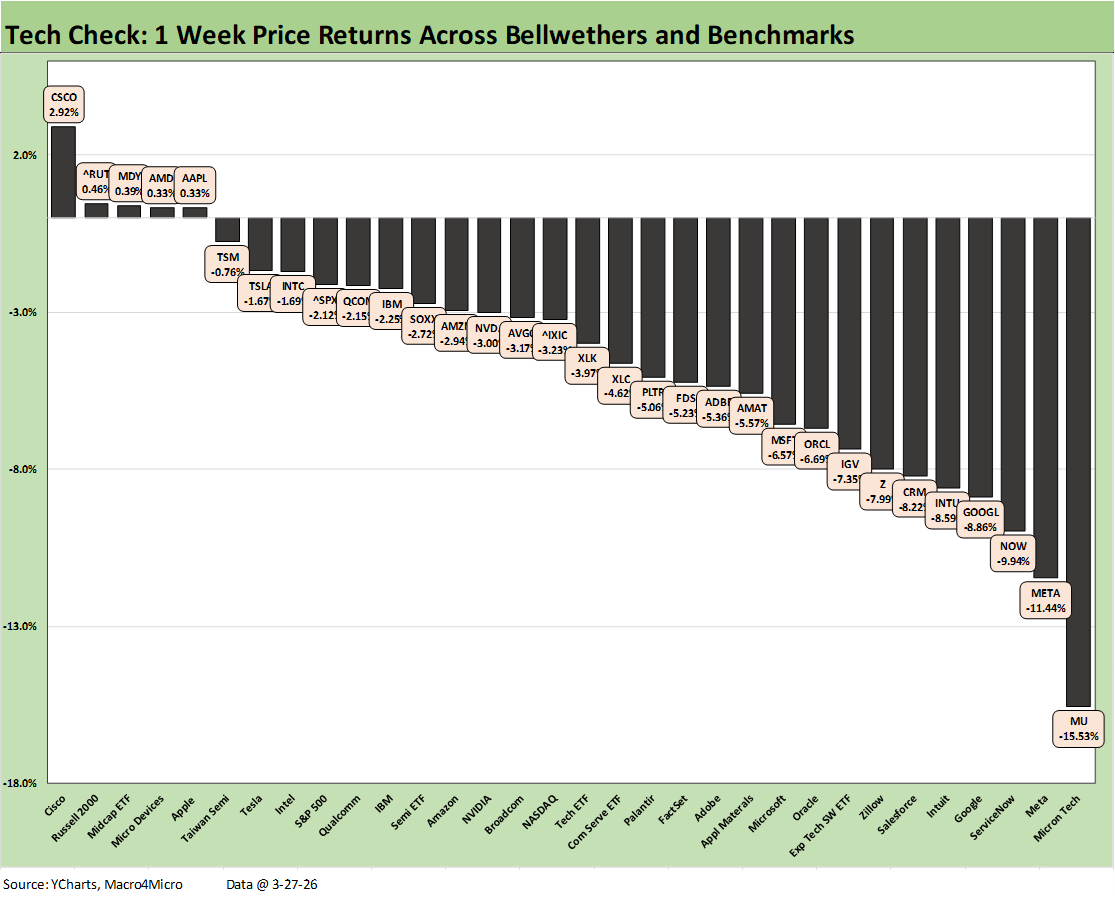
The tech bellwethers show only 1 positive weekly return with Apple (AAPL). We see zero positive returns looking back over 1 month. Over 3 months, the only 2 lines that are positive are Taiwan Semi (TSM) and the Semiconductor ETF (SOXX). For 6 months, we are up to 4 positive lines (only 3 tech lines) with the Semi ETF (SOXX) and Taiwan Semi (TSM) well ahead of the comps. Alphabet (GOOGL) is a distant #3. The Equal Weight S&P 500 Index (RSP) was barely positive for 6 months at +0.76%.
The commentary below is mostly a cut-and-paste from an earlier post on LinkedIn on Sunday with some additional inputs:
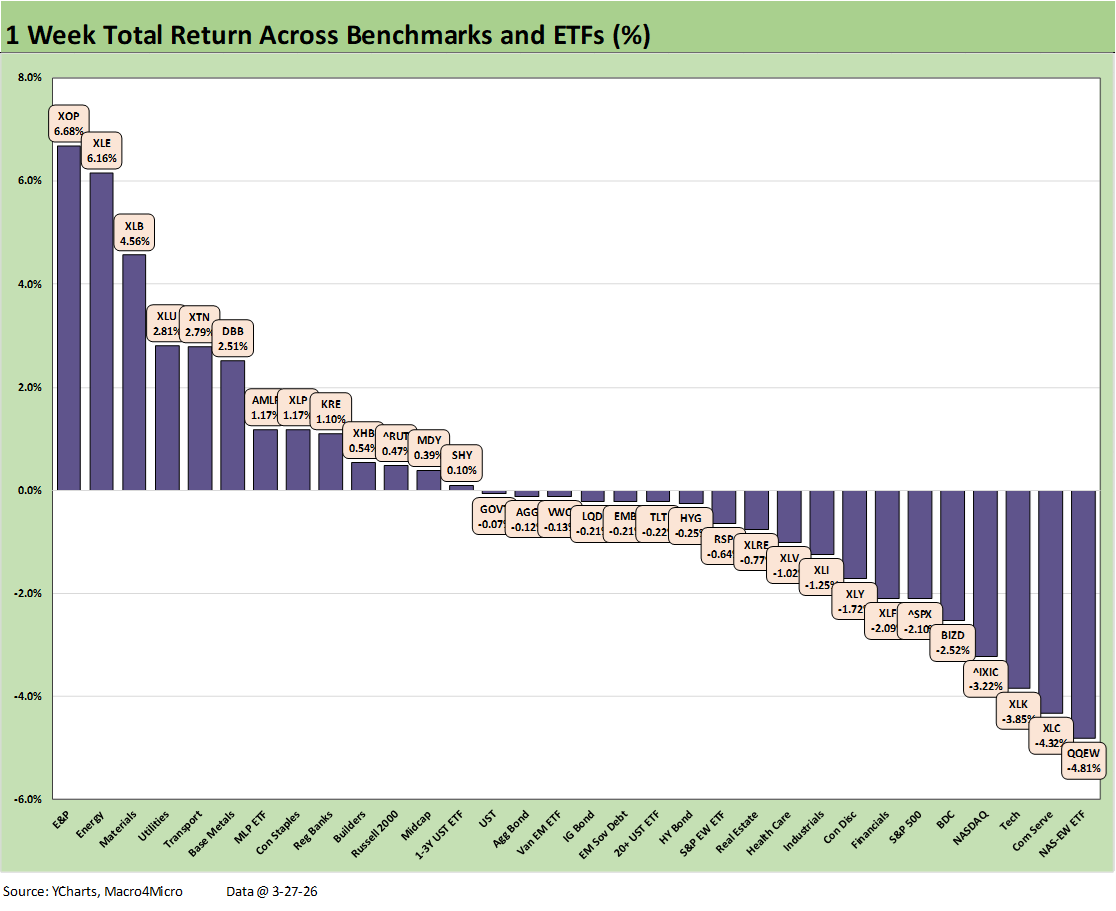
The chart details the weekly returns for the 32 benchmarks and ETFs we monitor. While this week overall was another grim one with NASDAQ and S&P 500 posting negative returns, the small cap Russell 2000 and Midcaps posted positive returns for the week even as they struggled YTD with small caps in the red and midcaps slightly above 0% YTD.
Small caps had already entered correction territory the prior week. The S&P 500 shows half the industry sectors in correction as the S&P 500 and NASDAQ reside in the bottom quartile this week as noted in the chart. The11 S&P 500 sectors showed a higher positive count this week than the last few with the positive count doubling to a still unsightly 4 of 11. The 4 positive S&P 500 sectors included Energy, Utilities, Consumer Staples, and Materials.
We see a positive vs. negative score of 13-19 this week in the 32 asset lines in the chart, and that is better than the 6-26 last week and the 3-29 the prior week. Tech was a mess last week with the Equal Weight NASDAQ 100 ETF (QQEW) in last place and the bottom 4 including Communications Services (XLC), the Tech ETF (XLK), and NASDAQ (IXIC).
The UST curve has been going the wrong way in 2026 with UST deltas rising YTD. We saw 6 of 7 bond ETFs in negative range this week with only the short duration UST (1Y-3Y) ETF (SHY) able to edge (barely) across the zero line into positive range.
We looked at the running YTD UST deltas in a LinkedIn post on Friday and updated that in a separate note on the weekend (see UST Deltas: Elevation Realities 3-29-26). The 30Y Mortgage rates have edged higher with the Mortgage News Daily survey closing at 6.64% on Friday. That comes after a brief dip below the 6.0% line in late February.
As already detailed in separate commentaries, the FOMC handicapping has been dramatically revised since the Iran fallout. Using the Oct 2026 FOMC meeting as a guide, FedWatch as of Monday morning has set the odds at 89.7% (up from 74.5% on the weekend) that fed funds will remain unchanged. There is an 8.1% (down from 23% on the weekend) chance of 1 hike and a 2% chance (up from 0% on the weekend) of 1 cut by then. As of 1 month ago, the odds were a 35% chance of 2 cuts.
The shifting debate is whether the oil spike will materially undermine growth and prompt Fed caution. It is worth noting that we have seen negative GDP growth in some quarters during past cycles without an NBER recession flag being thrown.
Iran has complicated life for the FOMC and Warsh. We assume Trump will continue to demand multiple cuts and negative real fed funds rates. That outcome just got more event-driven in nature. It takes more than a few Trump-appointed votes to make that happen.
The commentary below is mostly a cut-and-paste from an earlier post on LinkedIn on Sunday with some additional inputs:
The chart updates the weekly “Tech Check” list with 32 benchmarks and ETFs that we built out since the AI mini-panic and now the Iran drama. The simple realities include a higher UST curve flowing into discount rates that could be used in valuation. Shifting revenue expectations on price and volume are among the more obvious worries.
The positive vs. negative score is not pretty at 5-27 this week. That score is below the 8-24 from last week and 7-21 the prior week. If we take out the Russell 2000 and Midcaps (MDY) from the positive count this week, we only see Cisco (CSCO), Advanced Micro Devices (AMD), and Apple (AAPL) slightly positive.
We see a long negative tail with Micron (MU) on the bottom at -15.5% with Meta (META) also in double digit negative return range at -11.4% after the court decisions. Within the mix of Mag 7+3, we see 6 of the Mag 7 in the red and the same for 9 of the Mag 7+3. That’s a bad week.
The more mature “incumbents” are in the top quartile even if 3 of the top quartile members (Taiwan Semi, Tesla, Apple) posted negative returns. That is a low bar to clear to make the top tier.
The wrestling match around AI undermining current business models is ongoing, and the YTD returns for numerous SaaS-centric bellwethers are downright glum. The trailing 1-month score is 4-28 and 7-25 YTD.
For the YTD period, we see 5 of the bottom 6 in the YTD Tech Check from the SaaS-heavy services tier. YTD returns in the bottom 6 range from Zillow (Z) at -40.7% coming in last to FactSet (FDS) at -31.6%. FDS is 6 notches off the bottom. The top of the lowest quartile was the Software ETF (IGV) with a YTD return of -27.2%.
More investors are flagging the direct and indirect impacts of Iran on pricing, volumes, and overall demand and the potential to undermine unit cost structures. That includes the full range of global tech and services industries from semiconductors to data centers. Assumptions around growth rates (and thus multiples) are subject to challenge.
Meanwhile, cyclical anxiety can flow into IT budgets and what that means for tech sector growth rates and pricing power. Valuation and buy-the-dip signals get debated daily, but the moving parts are anything but straightforward when it comes to Iran. Tariffs were easier for investors to quantify with more confidence.
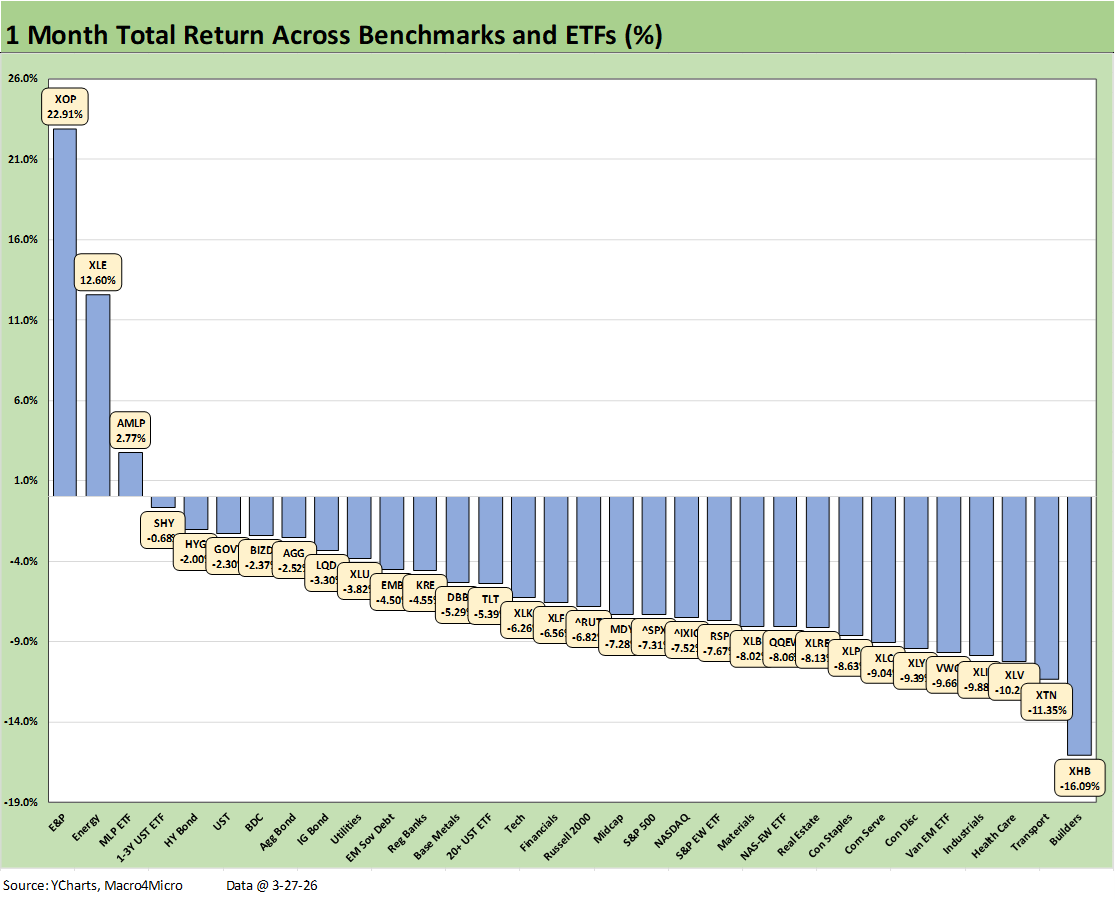
The 1-month review of the 32 benchmarks and ETFs weighed in at a score of 3-29 with only the 3 main energy ETFs in positive range across the E&P ETF (XOP), Energy (XLE), and Midstream ETF (AMLP). We see a Hi-Lo return range from #1 to #32 at 39 points with Homebuilders (XHB) sitting on the bottom at -16.1%. The median return in the mix of 32 was around -7.0%.
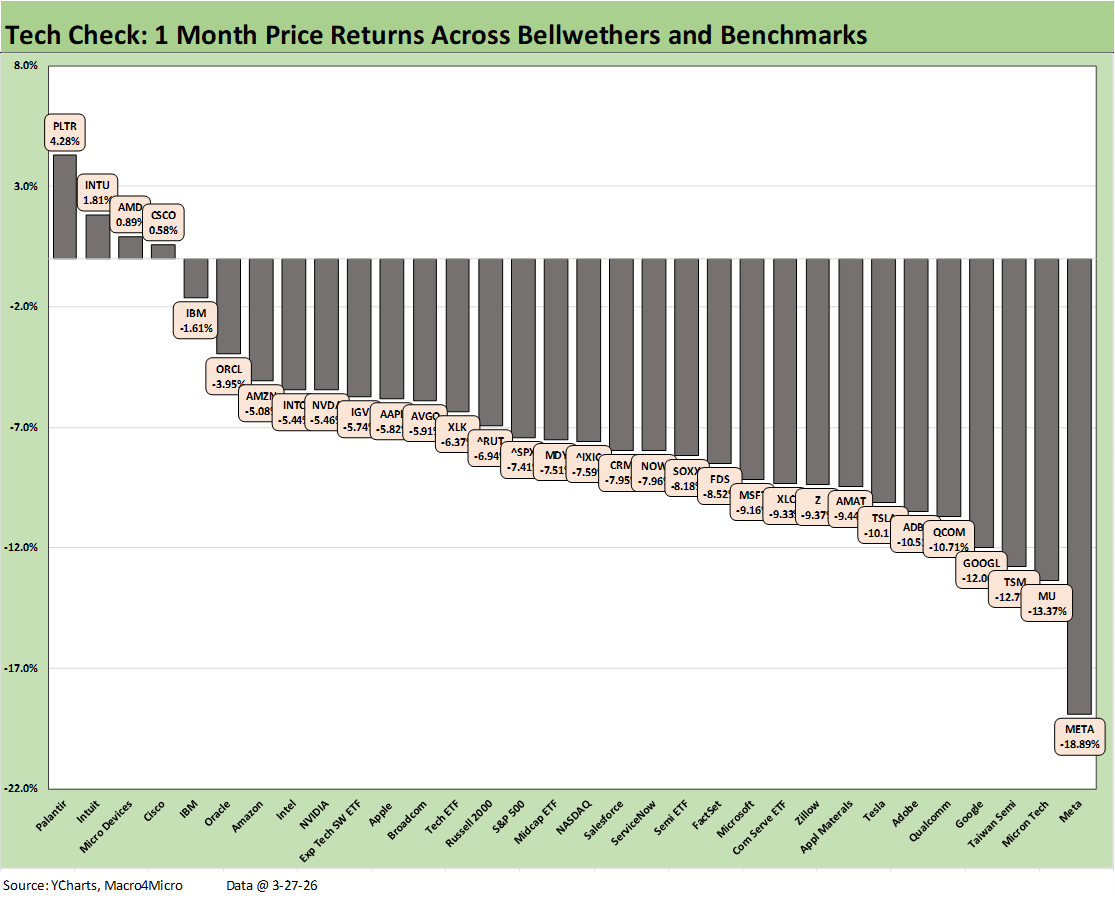
The trailing 1-month score for the 32 “Tech Check” names was 4-28 with Palantir (PLTR) at #1 followed by Intuit (INTU) at #2, Advanced Micro (AMD) at #3, and Cisco (CSCO) at #4. Taking the #1 rank only required a +4.28% return for PLTR. Meanwhile, the bottom quartile showed 7 of 8 lines with double-digit negative returns. Meta (META) sat in dead last at -18.9% after the adverse court decisions. We see 3 of the Mag 7 in the bottom quartile with Alphabet (GOOGL) and Tesla (TSLA) joining Meta in the lowest tier.
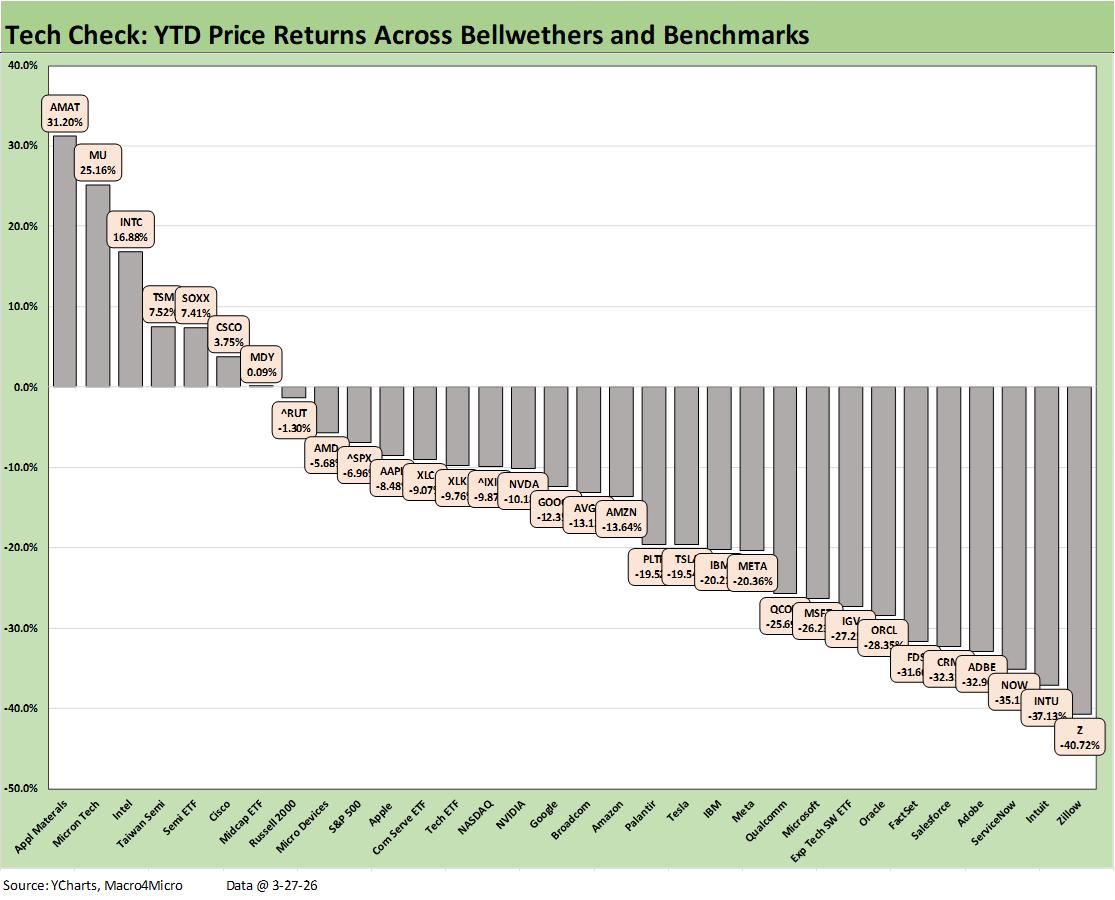
The YTD “Tech Check” list underscores a grim year with a 7-24 score. That includes Midcaps at barely positive. The heavy mix of SaaS-centric services names dominate the worst returns with Zillow (Z) in last place at -40.7%. We see such names comprising 5 of the worst 6 with Intuit (INTU) at -37.1%, ServiceNow (NOW) at -35.1%, Salesforce (CRM) at -32.3%, and FactSet at -31.6%.
At the top of the bottom quartile we see the Software ETF (IGV) at -27.2% just ahead of Oracle at -28.2%. That is a grim set of returns at the low end that drove a Hi-Lo range in the 32 Tech Check names of almost 72 points. At the top of the rankings we see Applied Materials (AMAT) at +31.2% with Micron (MU) #2 at +25.2% and longtime legacy leader Intel (INTC) at #3 with a +16.9% YTD.
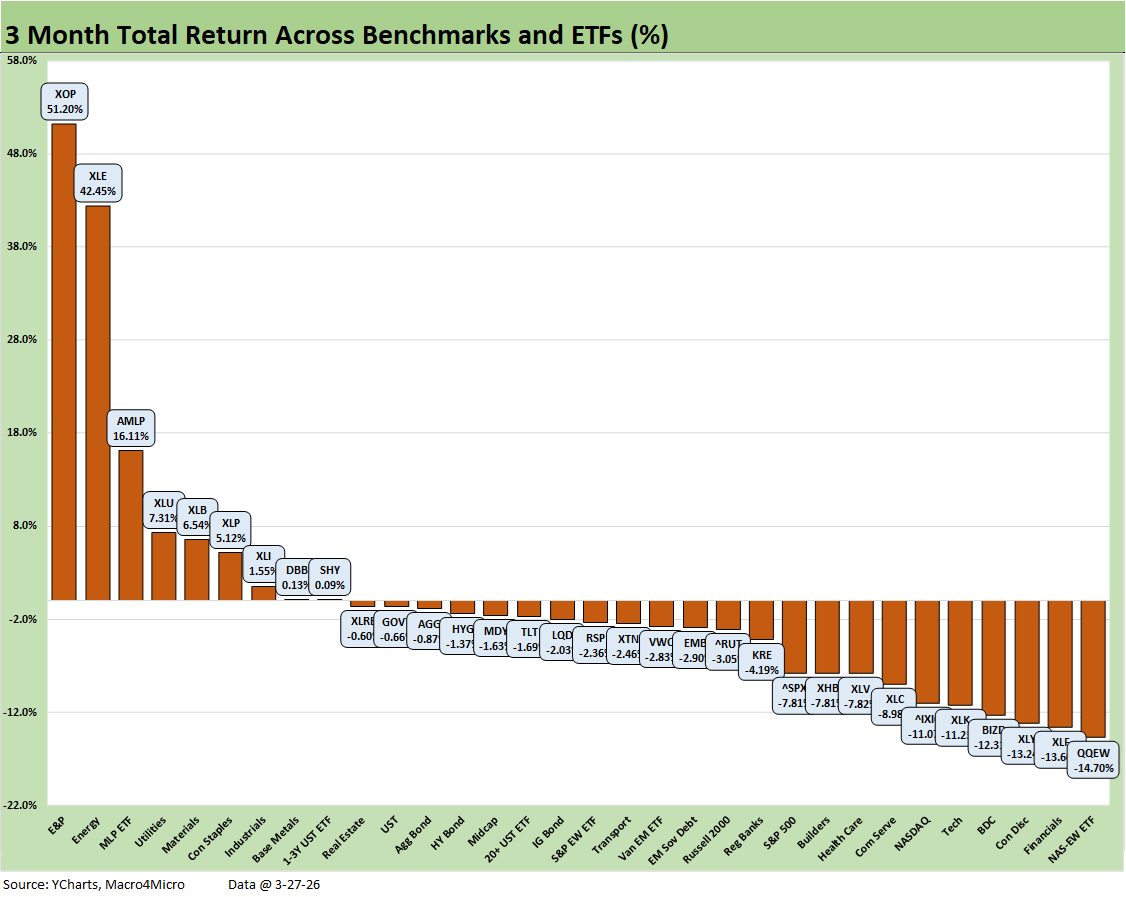
The 3-month period for the broader mix of 32 benchmarks and ETFs posted a score of 9-23 with energy ETFs (XOP, XLE, AMLP) holding down the top 3 slots followed by the more defensive Utilities ETF (XLU). An interesting twist was the cyclical Materials ETF (XLB) given the heavy chemical mix and the ability of US petrochemicals names to see upward pricing power in the Iran global meltdown. The US producers maintain access to lower cost natural gas feedstocks.
For bond ETFs, we see 6 of the 7 in negative range with the short duration UST 1Y-3Y ETF (SHY) very slightly positive. We covered the UST curve dynamics in this post-Iran mess in a commentary posted yesterday (see UST Deltas: Elevation Realities 3-29-26). The to-and-fro on inflation risk vs. cyclical pressures on payrolls will keep bulls and bears armed with talking points, but the potential for stagflation is on a scale we have not seen since the early 1980s.
Trump was out this morning with escalation threats again and deadlines ahead. Putting war crime threats in print (power plants, water, etc.) is not a PR enhancer with allies. The potential response from the Houthis adds one more major threat to shipping costs and supply and even more importantly a fresh potential oil supply shock via the Bab-el-Mandeb Strait. The threatened actions against Kharg Island and Iran power plants would take the Iran War to a radically more intense level.
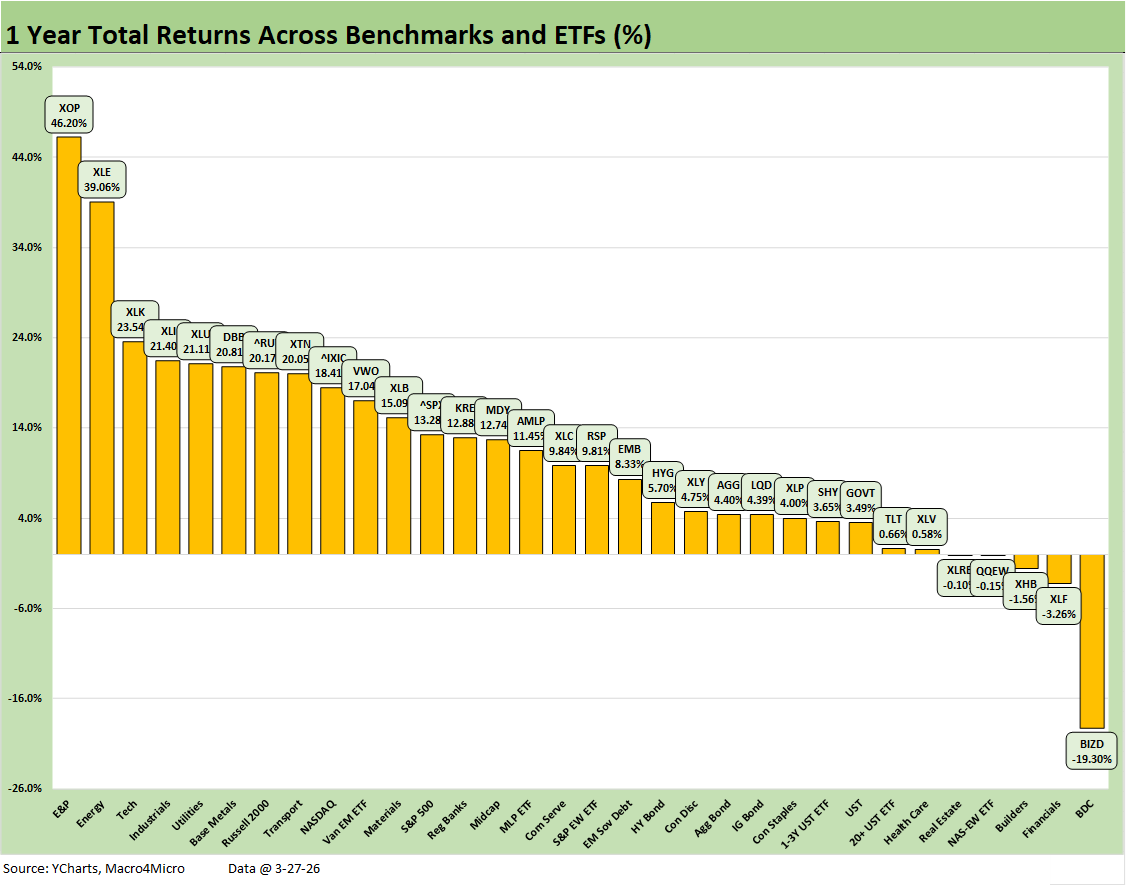
The trailing 1-year still impresses at 27-5 as the numbers keep benefiting from earlier results in 2025. The BDC ETF (BIZD) is the outlier at -19.3% with Financials (XLF) in second to last at only -3.26%. Homebuilders (XHB) and Real Estate (XLRE) are showing the adverse impact of the UST yield curve. The Equal Weight NASDAQ 100 ETF (QQEW) joined the 5 negative lines for the past year.
The top tier shows E&P (XOP) and Energy (XLE) well ahead of the pack. The Tech ETF (XLK) is still in the top tier despite the -9.9% performance over the last 3 months. A notable ranking for LTM is the fact that Russell 2000 is ahead of the NASDAQ and S&P 500 despite the small caps being the first benchmark to post a correction in this recent sell-off. The correction parade included the NASDAQ and the Dow to end last week with the S&P 500 a short distance away from the magic -10% correction line. We see a rally today (Monday morning) in stocks and bonds after a rough week.
See also:
UST Deltas: Elevation Realities 3-29-26
Market Commentary: Asset Returns 3-23-26
Market Lookback: Confusion Reigns, Dislocation Pours 3-22-26
New Homes Sales Jan 2026: The Nays Carry 3-19-26
Producer Price Index Feb 2026: Getting Warmer 3-18-26
Industrial Production Feb 2026: Capacity Utilization 3-16-26
Market Lookback: The Gulf of Cause and Effect 3-15-26
PCE Inflation Jan 2026: Personal Income & Outlays 3-13-26
GDP 4Q25 Second Estimate: Sharp Move Lower 3-13-26
Housing Starts Jan 2026: Total Starts Up, Completions Up, Permits Down 3-12-26
CPI Feb 2026: It’s Making You Wait… 3-12-26
Existing Home Sales Feb 2026 3-10-26
Payrolls Feb 2026: Into the Weeds 3-8-26
Employment Situation Feb 2026: Payrolls Get Ugly 3-8-26
VIX: Market Still Not Getting the Vapors 3-6-26