
Existing Home Sales Feb 2026
Existing home sales posted relatively mild volume and price moves with mortgages about to get stubborn again with the oil spike.


Total existing home sales and Single family home sales both posted modest increases MoM but were down YoY. Coops/condos sales were lower MoM and YoY.
The market saw yet another YoY price increase (32 straight YoY increases) and a MoM increase in median prices for existing and single family. Coop/Condo prices were down both MoM and higher YoY.
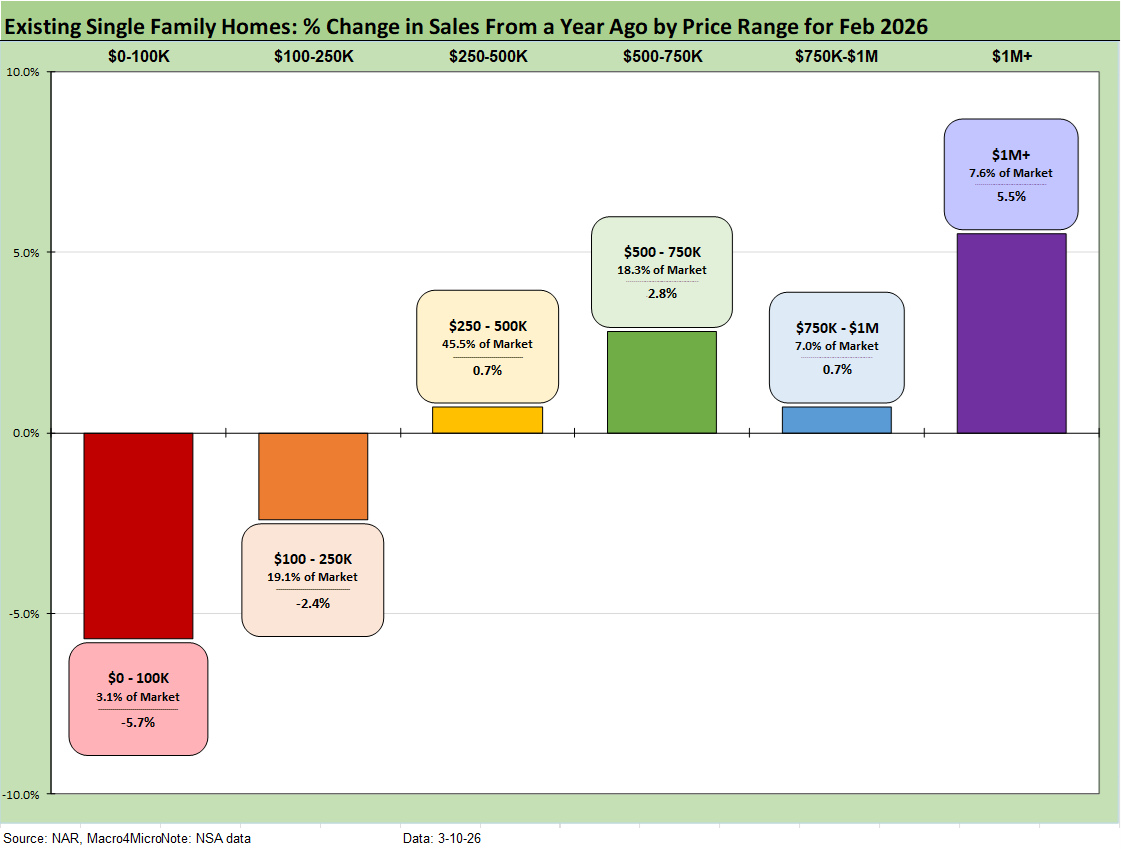
Across the 6 price tiers we reviewed, the top 4 price range tiers increased and the bottom two price tiers declined. Rising inventory and rising prices have been an odd combination.
The above chart shows the sales volume delta by price tier for Feb 2026, and we see 4 of the 6 price tiers posting positive growth with only the two lowest price tiers posting declines.
The volatility and disruption of the Iran war is undermining the rally we had seen in the mortgage markets with a slight uptick again. After a brief move below the 6.0% line into 5% handle range, the setbacks on the UST curve sent mortgages to 6.09% for the Mortgage News Daily survey as of the latest close. The range has been a tight one.
Mortgage rates have been stubborn all year and they are hovering on average in the low 6% area. The Freddie Mac 30Y set on Thursdays (6.0% on 3-5-26) is still material relief from the 6.63% of one year ago for Freddie Mac. This week brings the CPI and PCE inflation reports for some new “pre-Iran” reads on where inflation was setting up before the impact of the oil and gas spike started flowing into the system. Even with today’s oil price around $83 (WTI) as we go to print, that is still up by $15 per barrel from the pre-bombing period.
For existing home sales, the monthly payment math is still not working well for those looking to cash out, move up, or simply relocate. Expectations for a bull flattener in the UST market that would translate into low to mid 5% mortgage rates have been thwarted so far as we cover in other commentaries.
The three Fed cuts in the fall of 2025 (-75 bps) followed 3 actions (50, 25, 25) in the fall of 2024, in turn translated into UST curve steepening along the way. Back in the fall of 2024, the UST rally along the curve saw mortgage rates right around today’s level after easing while the 10Y UST dropped down to around 3.6% (current 4.15%) and mortgages near 6.0%. That Sept 2024 rally soon gave way to a steepening and tough road for mortgages into 2025 and now 2026.
Those expecting the 10Y UST to follow fed funds lower have been relatively disappointed since the easing cycle got underway, so the latest debates on how FOMC actions will play out under Warsh do not come with a sense of automatic bull flattening and lower mortgage rates.
The Iran oil spike and all the knock-on effects for CPI and PCE inflation that will come with energy pressure could make for a lot of frustration in the White House. The chance of an easing in June per FedWatch has plunged over the past month with the odds of “no action” rising to +60.8% as we go to print from 24.8% 1 month ago.
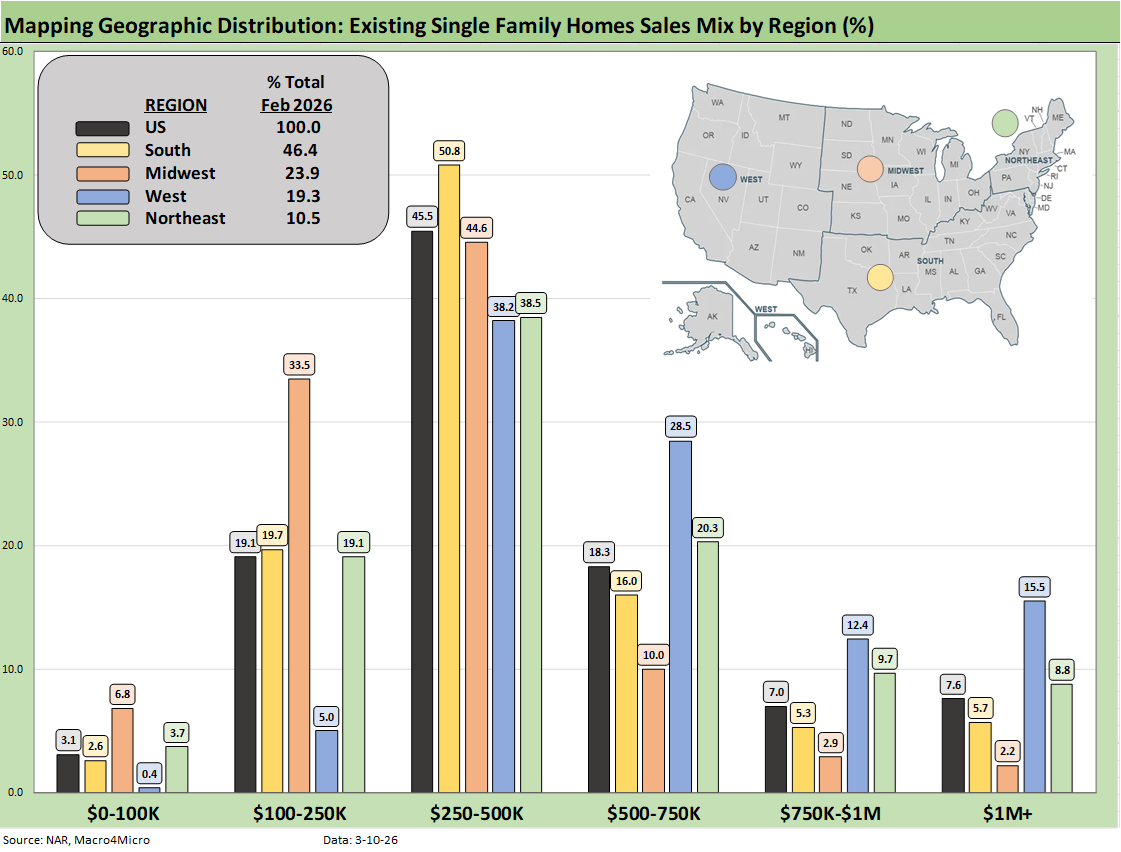
The above chart shows the geographic mix of volumes and details on price mix by region. The South is the main event in single family volumes whether new or existing at over 46%.
For the bar chart, we break out the mix for each region by price tier. For example, the South shows over 50% (50.8%) of its existing home sales volume in the $250k to $500K range and 16% of its sales in the $500 to $750K bucket.
The high cost of homes in the West (notably California) is clear enough just by glancing at the bar chart with over 15% at prices over $1 million. The second highest in the $1 million club is the Northeast at almost 9%.
We see a big concentration in the $250K to $500K although the $100K to $250K bracket for the Midwest stands at over 33%. The map explains what states are in each Census region. There is a very wide range of home price profiles in the West and Midwest states.
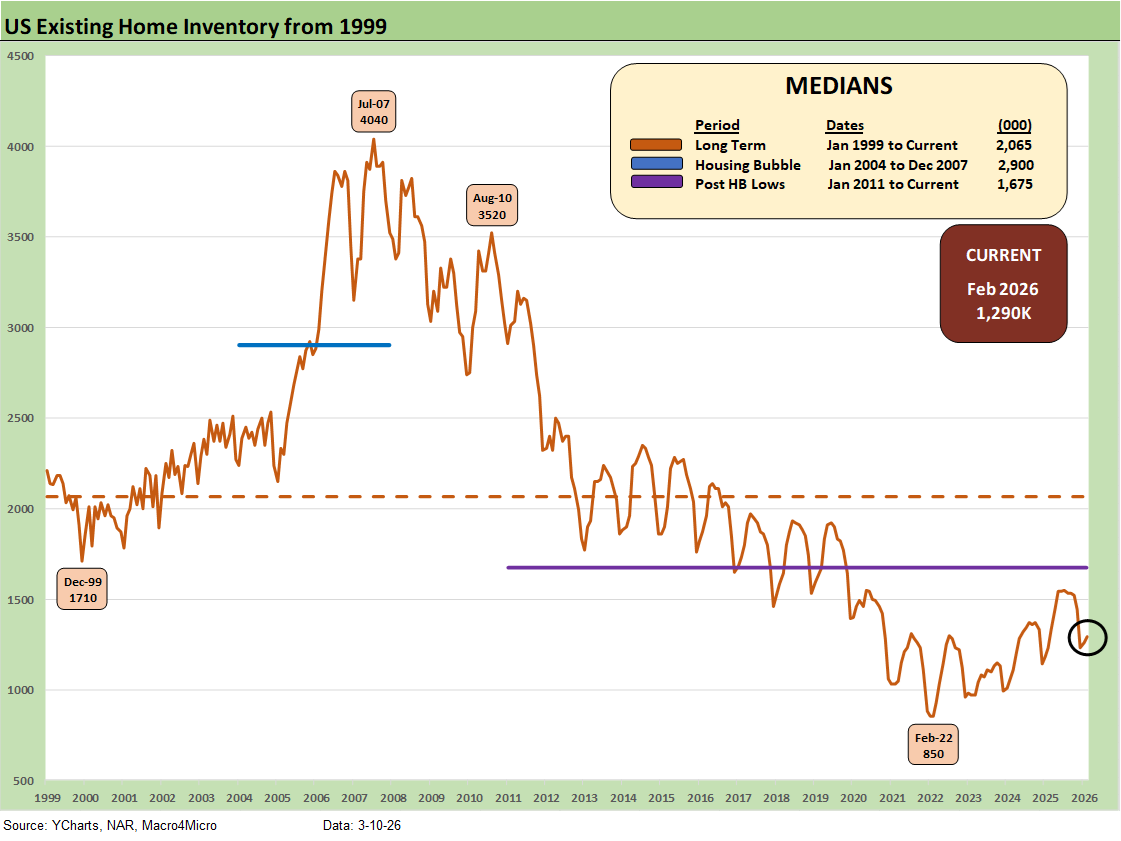
Inventory for total existing homes ticked slightly higher MoM (as revised) to 1.29 million units for +2.4% MoM and +4.9% higher YoY. Current inventory is well below longer term medians including 2.065 million for the post-1998 median. The median from Jan 2011 (homebuilding low) to current times is 1.675 million. In other words, existing home sales inventory remains extremely low even if the level is materially higher than the stunning low of 850K of Feb 2022 ahead of the end of ZIRP in March 2022.
The existing home inventory balance had shown a steady rise off the sub-1 million lows of 2022. Inventory had risen to the 1.3 million handle range in 2024 before dipping back down to a recent low of 1.14 million to close out 2024. We bounced off those numbers in 2025 to get back above 1.5 million handles before the recent move lower to 1.2 million handles.
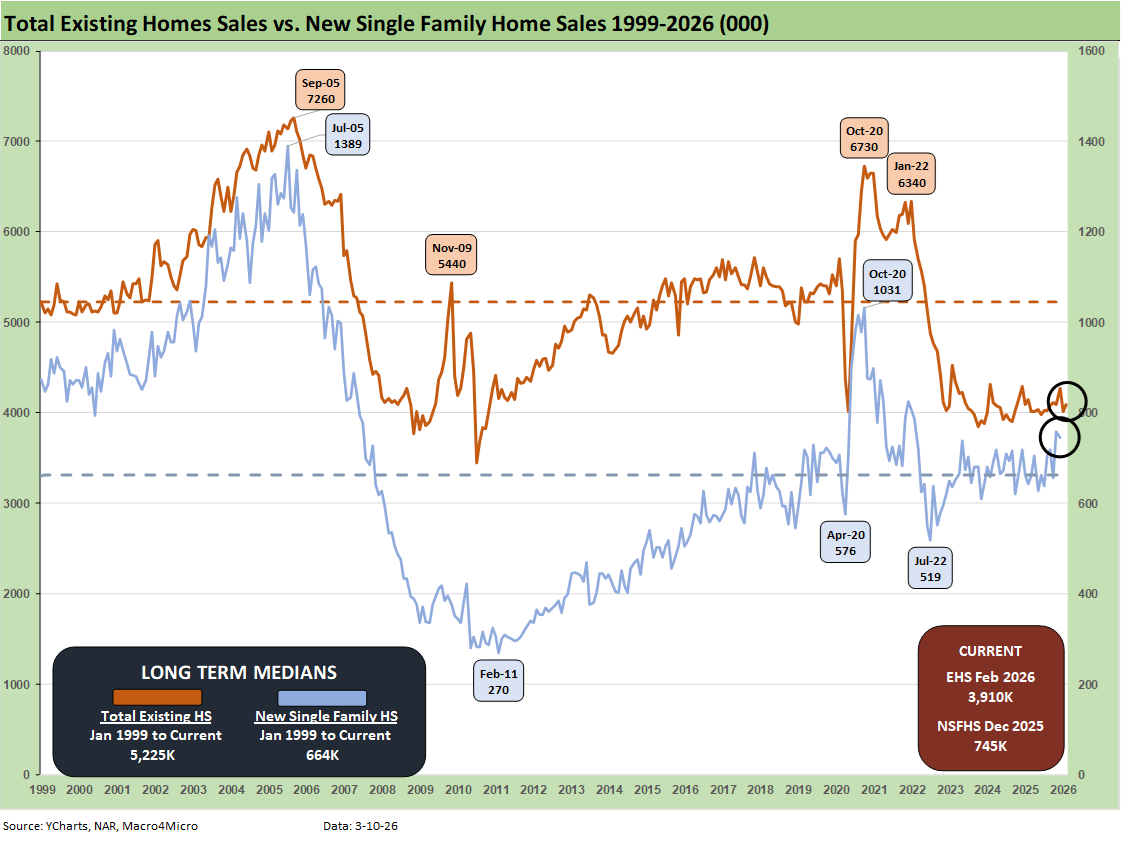
The above two-sided chart updates the trend line in total existing home sales vs. new single family homes. We had been operating without new home sales data from the Census Bureau since the shutdown, but we now have some updates (Note: the Jan 13, 2026 release from the Census covers through Oct 2025). The Census is very slow to catch up. From what we see on the Census site, the January 2026 new home sales should be updated March 19. As we have covered in our homebuilding commentaries, new home sales continue to struggle along with new residential construction (starts to be released this week).
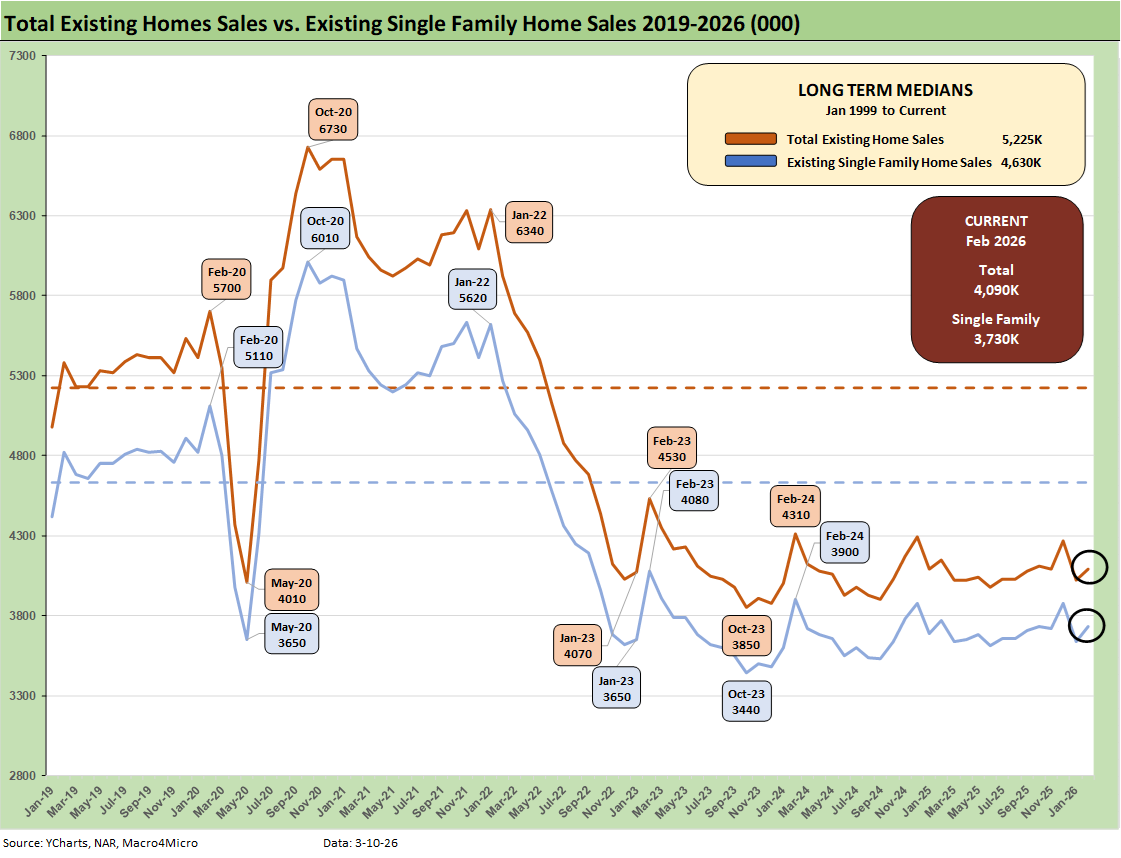
The above chart breaks out the timeline for existing single family alone of 3.73 million vs. total existing home sales of 4.09 million, which is well below the long-term median (from Jan 1999) of 5.22 million for total existing homes. Existing single family was +2.5% sequentially and -1.1% YoY (SAAR). The lower line is ex-condo/ex-coops. We saw 360K in condo and coop sales in Feb 2026, down from 380K YoY and down from 380K MoM.
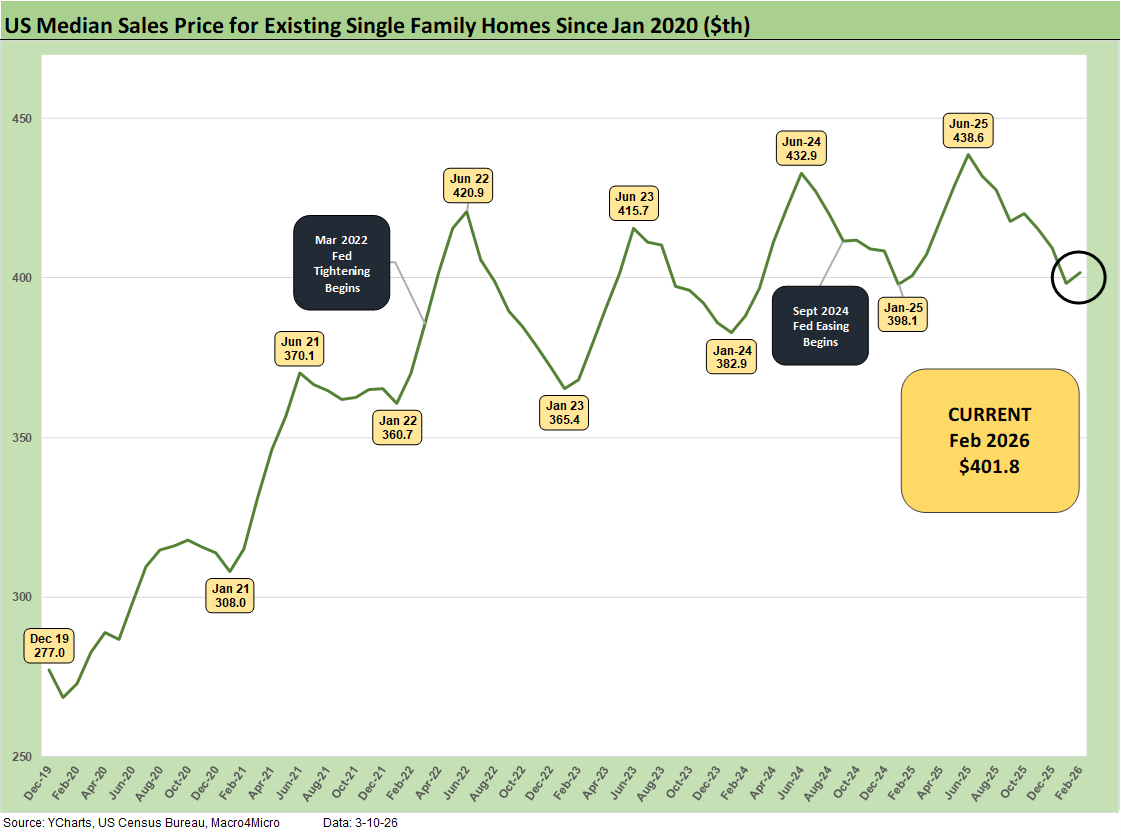
The above chart updates the median price for existing single-family homes at $401.8K after June 2025 hit a record $438.6K. The median price in Feb 2026 is dramatically above the $308K level back in Jan 2021 and $277K in Dec 2019 when mortgage rates were in a different zip code.
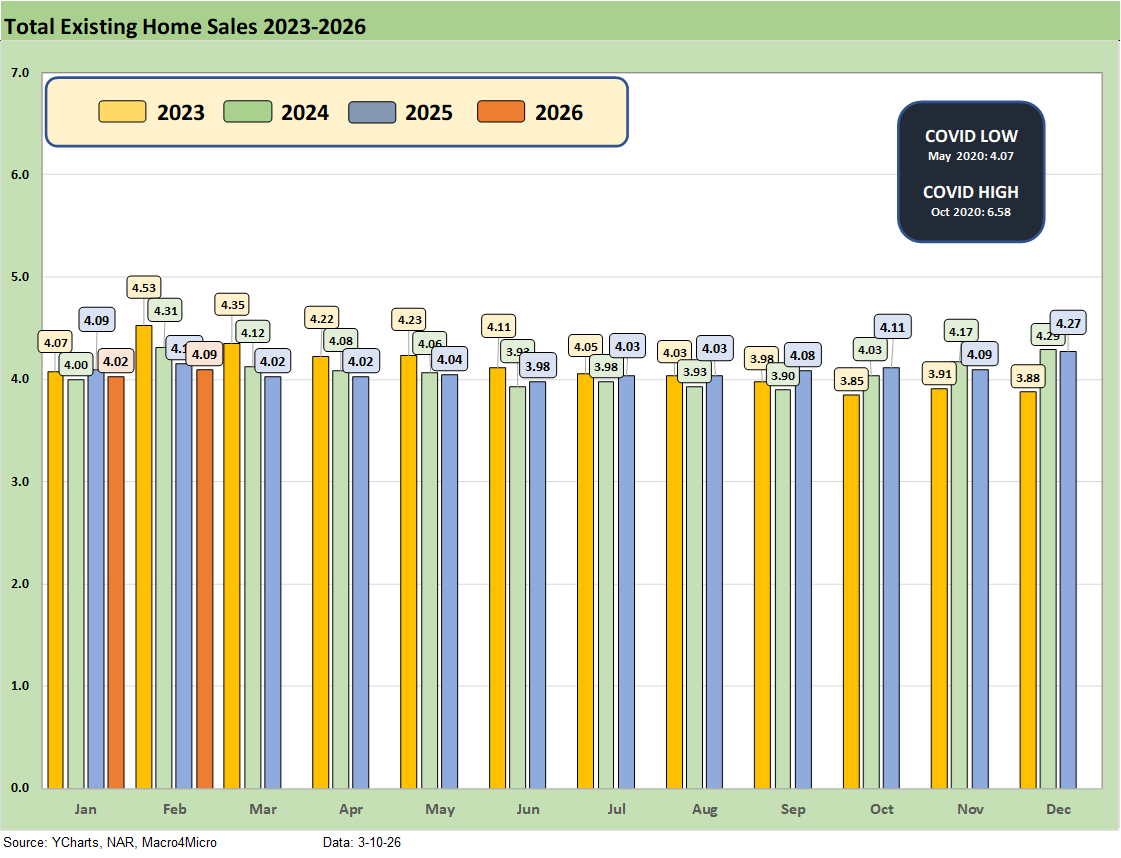
The above chart updates the monthly existing home sales across the timeline from Jan 2023 through Jan 2026. In the interest of visual quality, we had to delete the 2022 months when the market was posting 6 million and 5 million handle sales volumes in the first half of that year.
The current existing home sales volume is a long way from the mid-6 and high 5 million handles of 2021 and then into early 2022 when many homeowners had refinanced and new buyers locked in low mortgages. ZIRP ended in March 2022 and then the UST migration began and dragged mortgages to highs in 2023.
The Feb 2026 total of 4.09 million is near the May 2020 COVID trough of 4.07. We had a few sub-4 million handles along the way as noted in the chart, so the 2023-2026 period has been brutal for real estate brokers.
The above chart shows another angle on the sales mix across the price tiers. We just lift the numbers off the monthly handout for single family homes released by the NAR each month. It adds up over 100% but the message is clear enough. Higher price homes and buyers have had a better time.
The $250K to $750 range as two tiers add up to almost 2/3 of the market with the $100 to $250 showing a big share in some of the Midwest states as detailed in an earlier chart. We also looked at the growth trends for each tier in the first chart. Lower price tiers declined while the top 4 tiers rose. The lower price tiers are more on the cusp of where affordability and mortgage eligibility could be strained at 6% mortgage rates.
See also:
Market Commentary: Asset Returns 3-8-26
Payrolls Feb 2026: Into the Weeds 3-8-26
Employment Situation Feb 2026: Payrolls Get Ugly 3-8-26
VIX: Market Still Not Getting the Vapors 3-6-26
Meanwhile…Back in Economics and Tariffs 3-2-26
PCE Income & Outlays Dec 2025: Inflation Reversal? 2-20-26
4Q25 GDP (Advance Est.): Less Distortion This Time 2-20-26
2025 trade Deficits: Reality vs. Rhetoric 2-19-26
Industrial Production Jan 2026: Capacity Utilization Trends 2-19-26
Home Starts Dec 2025: Wrapping a Weak 2025 2-18-26
Market Lookback 2-17-26
CPI Jan 2026: Reassuring Numbers, Missing Pieces 2-13-26
Existing Home Sales Jan 2026 2-12-26
2025 Spread Walks and Multicycle Return Histories 1-5-26
Annual Return Differentials: HY vs. IG Across the Cycles 1-3-26