
Market Commentary: Asset Returns 3-23-26
We break out the asset returns with stagflation lurking, FOMC backpedaling, and foreign policy morphing.


A Whole New World…for 5 days?
The wags are already out there declaring “Taco Monday” but the ability to manipulate markets with a combination of brinkmanship and false deal chatter will remain a tactic to watch… that is, until it stops being a tactic.
The matchup of Trump whims vs. Iranian ideologues is a very challenging game when one side is offered extinction (or submission) and the other side shows a lack of consistency and confuses the world with so many conflicting statements. The backdrop will remain an endurance contest until the offramp materializes and Hormuz opens to a wider range of nations.
The rising cost of energy remains a fact of life with the question of “how high and for how long” the ongoing handicapping exercise. The big decline in oil today still sits on a very thin layer of assumptions. As we saw in the FOMC odds-making data (e.g. FedWatch) the probability has now shifted to negligible odds of FOMC easing in 2026 with higher odds of hikes by the fall per FedWatch (see Market Lookback: Confusion Reigns, Dislocation Pours 3-22-26).
Given the whipsaws of information and disinformation that are intrinsic to this high stakes “game theory” (if it can be called that), we saw the VIX swing to 31 before dropping back to just over 25 as we go to print. The Hormuz situation is being managed in a way that helps Iran (and Russia) and takes some pressure off China and others in Asia who are getting very annoyed. Meanwhile, Europe and Trump hold tighter to their mutual disdain (see VIX: Market Still Not Getting the Vapors 3-6-26). That could spell trouble later on trade.
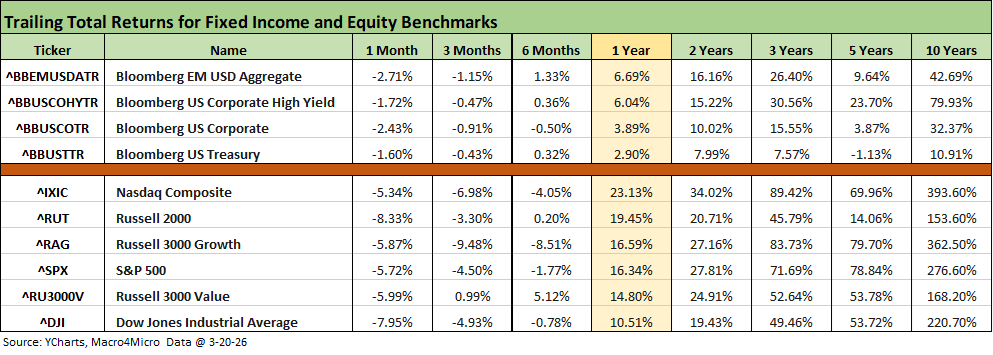
The above table updates the running returns across a range of timelines for our high-level debt and equity benchmarks. We line up the indexes in descending order of 1-year total returns.
The ugly 1-month numbers are apparent in the across-the-board negatives for debt and equity. For the rolling 3-months, only the Russell 2000 small caps generated a minimal positive return of just under +1.0%. Looking back over 6 months, large caps still struggled in the red zone while Russell 2000 and Russell 3000 value were at least positive. Growth benchmarks were negative with NASDAQ at -4.0% and Russell 3000 growth at -8.5%.
The rolling return visual
In the next section, we get into the details of the 32 ETFs and benchmarks for a mix of trailing periods. Below we offer a condensed 4-chart view for an easy visual on how the mix of positive vs. negative returns shape up. We see it as a useful exercise in looking for signals across industry groups and asset classes.
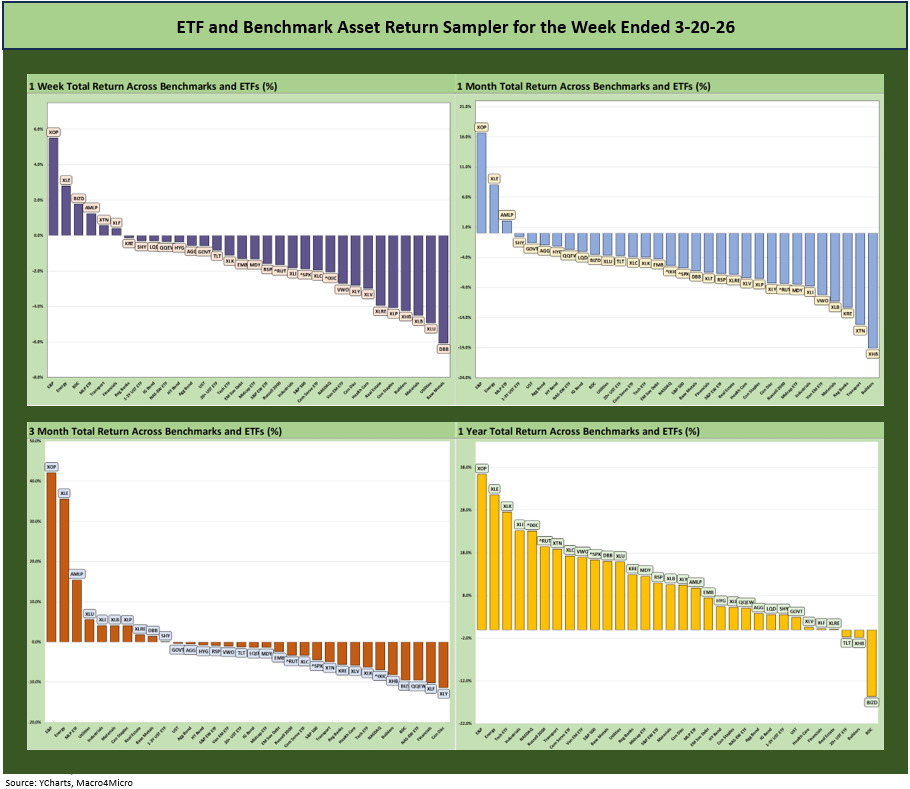
There is not much mystery in the return symmetry over 1-week, 1-month, and 3 months with the heavy weighting of negative returns. The story is clear with the word “correction” creeping into the market commentary lately.
The reality is corrections are quite common across cycles, so that is routine across time. The 2018 volatility in Trump 1.0 saw some corrections and even bear market commentary after a summer of 2018 that also saw some record highs (see Histories: Asset Return Journey from 2016 to 2023 1-21-24). Few in Washington seem to remember that 2018, back during Trump 1.0, saw negative returns on all the major bond and equity indexes. Cash was a top performer with sub 2% returns. 2018 continued what would be a record expansion from mid-2009 until COVID in Feb 2020.
What makes this market different is the long-term speculative flavor in tech and AI and now the turbocharged short-term speculation of geopolitics and how an Iran War will play out. Relative to the fruitless wars in Afghanistan and Iraq, a sustained clash with Iran would be without doubt the most unpredictable kind of war. That is especially the case given the history with the US vs. Iran, the decades of preparation by Iran for a war with the US, and the radical extremism of a heavily indoctrinated nation of over 90 million. Trump is not dealing with a spineless GOP Congress. This is the “bomb vest crowd” and not a limp and lame Senator looking to duck a primary. Trump may be using the wrong tactics.
Further below, we also look at the YTD “Tech Check” peer group of 32. That YTD timeline had a top quartile with negative returns in the bottom 2 slots with the Russell 2000 and Midcaps. The YTD charts for the tech check showed a 6-26 score for positive vs. negative.
Tech was the defining broad sector play with “AI fixation” but that started to go awry on AI fallout speculation. Now we add a damaging Iran War backdrop, energy spike, and supply crisis not only in energy but also across numerous critical supplier chains (helium sulfur, fertilizers, pharma inputs, etc.) that flow into pain for tech and agriculture among others.
The Magnificent 7 heavy ETFs…
Some of the benchmarks and industry ETFs we include have issuer concentration elements that leave them wagged by a few names. When looking across some of the bellwether industry and subsector ETFs in the rankings, it is good to keep in mind which narrow ETFs (vs. broad market benchmarks) get wagged more by the “Magnificent 7” including Consumer Discretionary (XLY) with Amazon and Tesla, Tech (XLK) with Microsoft, Apple, and NVIDIA, and Communications Services (XLC) with Alphabet and Meta.
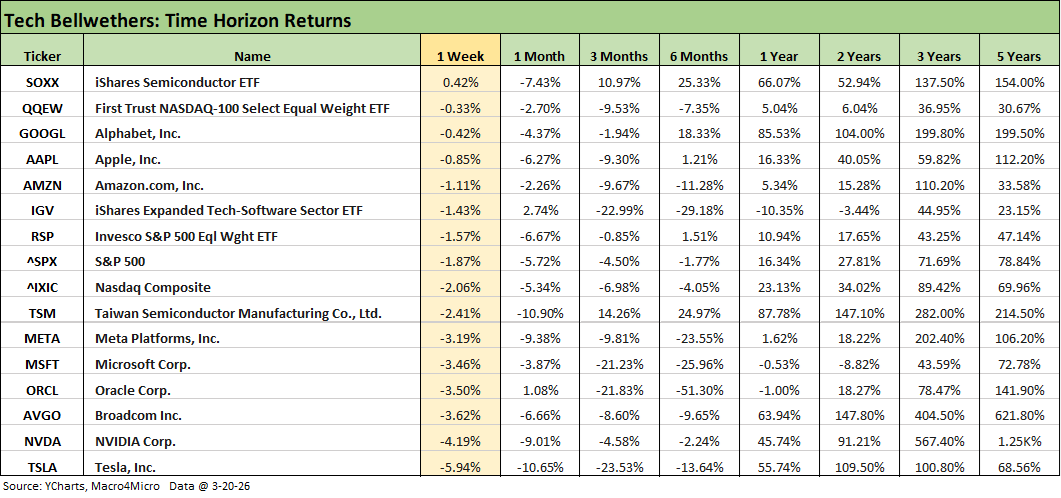
The above table updates the tech bellwethers against some broad benchmarks and notable subsector ETFs. For the week, we see a single line in positive range with the Semiconductor ETF (SOXX). All the Mag 7 names are negative and the same for the collective Mag7+3 (with Taiwan Semi, Broadcom, and Oracle). The Equal Weight NASDAQ 100 ETF (QQEW) was second with a negative return while Tesla was on the bottom at -5.9% and NVIDIA second to last at -4.2%.
We see a lot of negative returns across 1-month and 3-months with Tesla uglier than most back to 3 months. Even NVIDIA is in the red back to 6 months. Microsoft is in the red all the way back to trailing 1 year. Meta and Amazon generated negative returns back to 6 months. This backdrop is not 1999-2000 with the wide array of cash bleeders, but the valuation excess debate will not go away.
The software leveraged finance excess will remain a hot topic in private credit and how more trouble could reprice higher risk credit alternatives and lead to more dramatic HY bond repricing from the bottom up, but that is a story for another time.
The commentary below is mostly a cut-and-paste from an earlier post on LinkedIn on Sunday with some additional inputs:
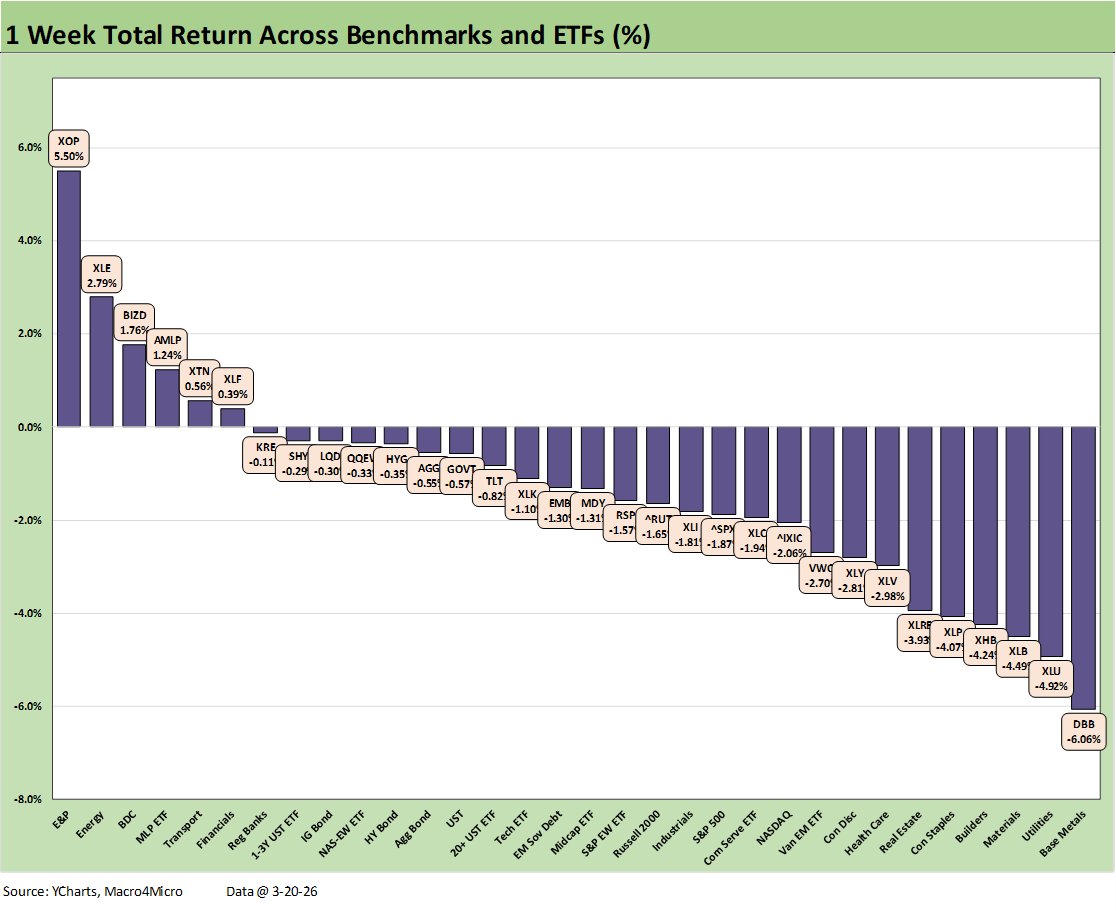
The above chart posts the weekly returns for 32 benchmarks/ETFs we monitor. The 6-26 positive-to-negative score marked an improvement from the 3-29 last week. That was a low bar.
Narrowing down themes is hard since it was a week where most everything went wrong even if energy assets performed well. Rates, cyclical expectations, fear of stagflation and myriad scenarios including steady escalation of a damaging war has dramatically shifted the odds of Fed easing and rising odds of FOMC hikes.
We cover the revised probabilities from FedWatch in a separate note (see Market Lookback: Confusion Reigns, Dislocation Pours 3-22-26). The news is not good even if Trump once again backed down by Monday on his threat to escalate by bombing civilian power assets (actually a war crime). That action would have crushed markets and set off chain reactions in the Gulf. The stagflation scenarios remain stubborn.
The checklist presents a range of fundamental, financial and geopolitical risks subject to decisions that face a lot of scrutiny. There is no shortage of “March of Folly” history where leaders ignore the realities of critical risks that cause wars and bring severe consequences. The rise of nationalism (think Vietnam), political ideologies (think China), ethnic enmity (think Balkans), religious factors (think Middle East) or racial lines (think South Africa) have brought their share of brutal wars and mass death.
Power-hungry, arrogant leaders often think they know more than everyone else (whether “the Best and Brightest” of Camelot or MAGA) and often fail to properly factor in underweighted risks. If they fail, they go about finding someone to blame when it all blows up. We are now in one of those N+1 moments.
Bad decisions and flawed assumptions are reflected in the current misinformation waves and recurring brinkmanship. The idea seems to be you just threaten to kill people to get them to submit. It is not a new strategy, but it is usually not plan A when you threaten the “martyr” and “bomb vest” culture.
Away from war scenarios, interest rate sensitivity and global cyclicality remain headwinds with Base Metals (DBB) last in weekly returns and Utilities (XLU), Materials (XLB), Homebuilders (XHB), Consumer Staples (XLP) and Real Estate (XLRE) among the worst performers. Materials (XLB) faces hydrocarbon-heavy costs and cyclical end markets.
The S&P 500 posted positive returns in only 2 of 11 sectors with Energy and Financials. In the ETF mix, XLF faced tough headlines and negative returns for the 1-month and 3-months. XLF is 2nd to last over 3 months with only Consumer Discretionary (XLY) worse. When financials and consumer names both struggle, that should ring some bells.
The 6 of 32 positive include 3 across E&P (XOP), Energy (XLE), and Midstream (AMLP). We see stragglers such as Financials (XLF) and the BDC ETF (BIZD) back in positive range this week. BDCs were a rock bottom performer over LTM at -15.6%.
Transports (XTN) was barely positive after posting negative double-digit returns over the trailing 1-month on airline pain and the potential for freight trouble as fuel cost soar and working capital dislocation could plague trade flows.
The commentary below is mostly a cut-and-paste from an earlier post on LinkedIn on Sunday with some additional inputs:
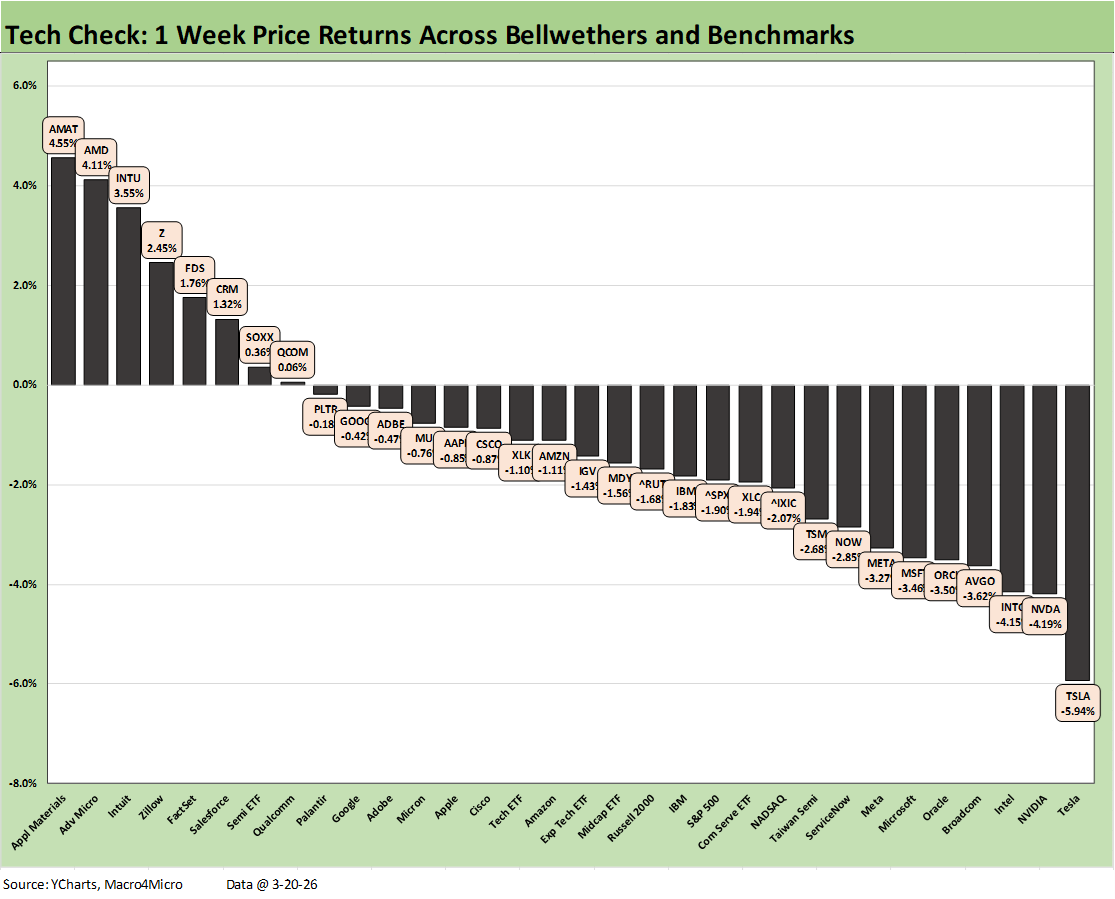
The above chart updates the returns on our “Tech Check” names that we started tracking with the AI replacement panic before the Iran War pyrotechnics. This week we added 4 more names to the list for a total of 32 companies, market benchmarks, and ETFs.
In descending order of market cap, we added Micron (MU) with $477 bn in market cap, IBM with $227 bn, ServiceNow (NOW) at $115.4 bn, and Adobe (ADBE) at over $101 bn.
IBM checks off a box as a legacy diversified tech and services operator. NOW and ADBE are in the IGV ETF. Of the four added, Micron was ranked #1 in performance YTD with IBM in the 3rd quartile and NOW in the bottom quartile at a YTD of -27.9% just ahead of ADBE at -29.1%.
The return score weighed in at 8-24 for positive vs. negative with fresh signs of a slow SaaS rally as AI displacement fears struggle to find the right valuation. Intuit (INTU), Zillow (Z), FactSet (FDS), and Salesforce (CRM) were in the top quartile this week. All four of those are deeply negative YTD and in the bottom quartile returns.
The top tier performers for this week were Applied Materials (AMAT) at #1 followed by Advanced Micro (AMD) at #2 with Qualcomm (QCOM) and the Semi ETF (SOXX) in the bottom two slots of the top tier.
The Mag 7 was entirely in the red with 4 of 7 in the bottom quartile (TSLA, NVDA, MSFT, and META). We see Alphabet (GOOGL) near the upper end of the second quartile with Apple a few slots below that, also in negative range. Within the Mag 7+3, we see Oracle (ORCL) and Broadcom (AVGO) in the bottom quartile with Taiwan Semi (TSM) just across the line at the bottom of the 3rd quartile.
Making a top quartile spot only required a positive return. The NASDAQ was negative and in the third quartile with the S&P 500, Midcaps, and the small cap Russell 2000. The Software ETF (IGV) was at the top of the third quartile.
We await the market wrestling with how to treat the Iran War fallout and how that could impact corporate sector IT budgets, AI economics, and how the software players will navigate what is expected to be some credit contraction headlines ahead in private credit.
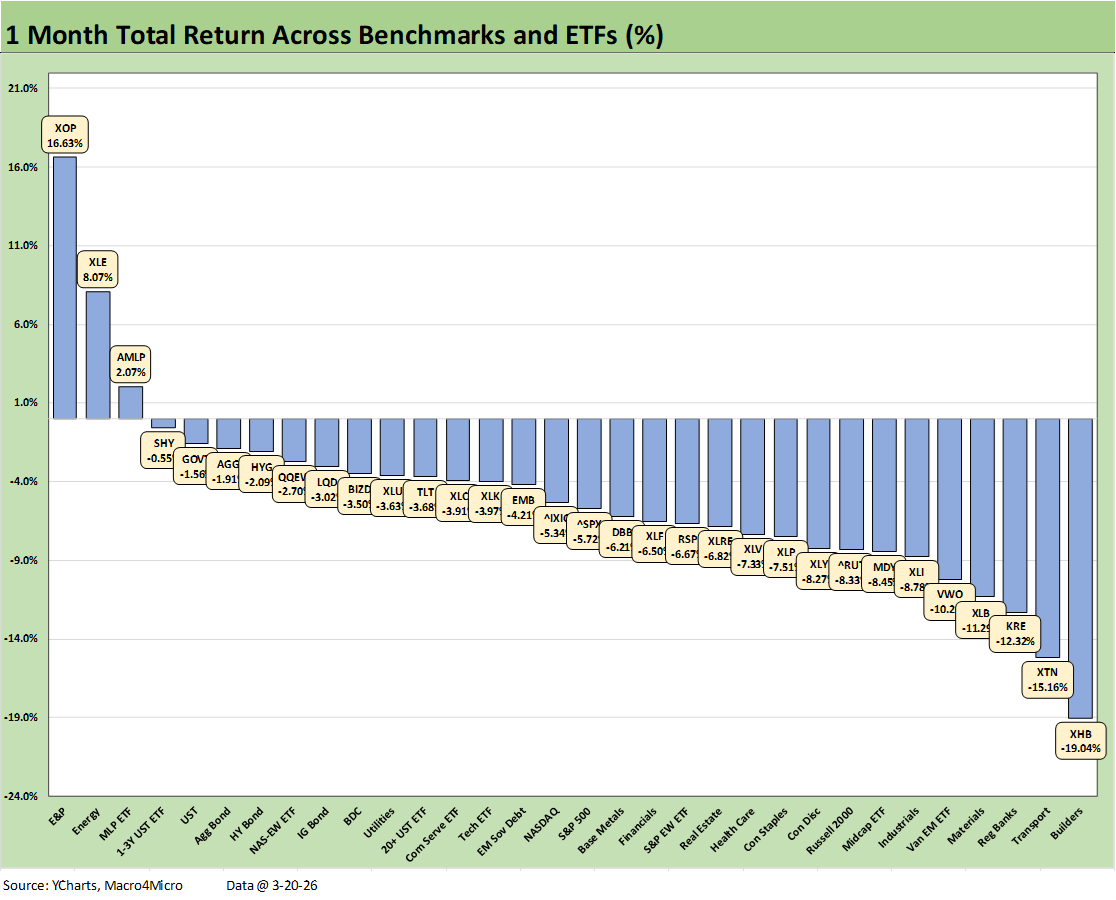
The 1-month returns for the broader peer group of 32 benchmarks and ETFs weighed in at an ugly 3-29 positive vs. negative. The 3 positive lines were comprised of the E&P ETF (XOP), the broad Energy ETF (XLE), and midstream energy ETF (AMLP). We see 5 of the 8 names in the top quartile with negative returns for the month. That tells the story by itself.
The bottom tier shows the increasing worries about UST curve dynamics and stagflation worries. We already detailed the radical shift in FOMC handicapping, and the steep UST curve in a separate commentary (see Market Lookback: Confusion Reigns, Dislocation Pours 3-22-26).
The bottom performer was Homebuilding (XHB) as residential struggles in this market (see New Homes Sales Jan 2026: The Nays Carry 3-19-26, Existing Home Sales Feb 2026 3-10-26). We see some of the commodities sensitive cost structures feeling the pain and the same for cyclicals. The Transports ETF (XTN) has been hit hard as jet fuel spikes and diesel costs soar. Airlines (excluding Delta) have been crushed even if they see some relief today on the oil plunge of the day.
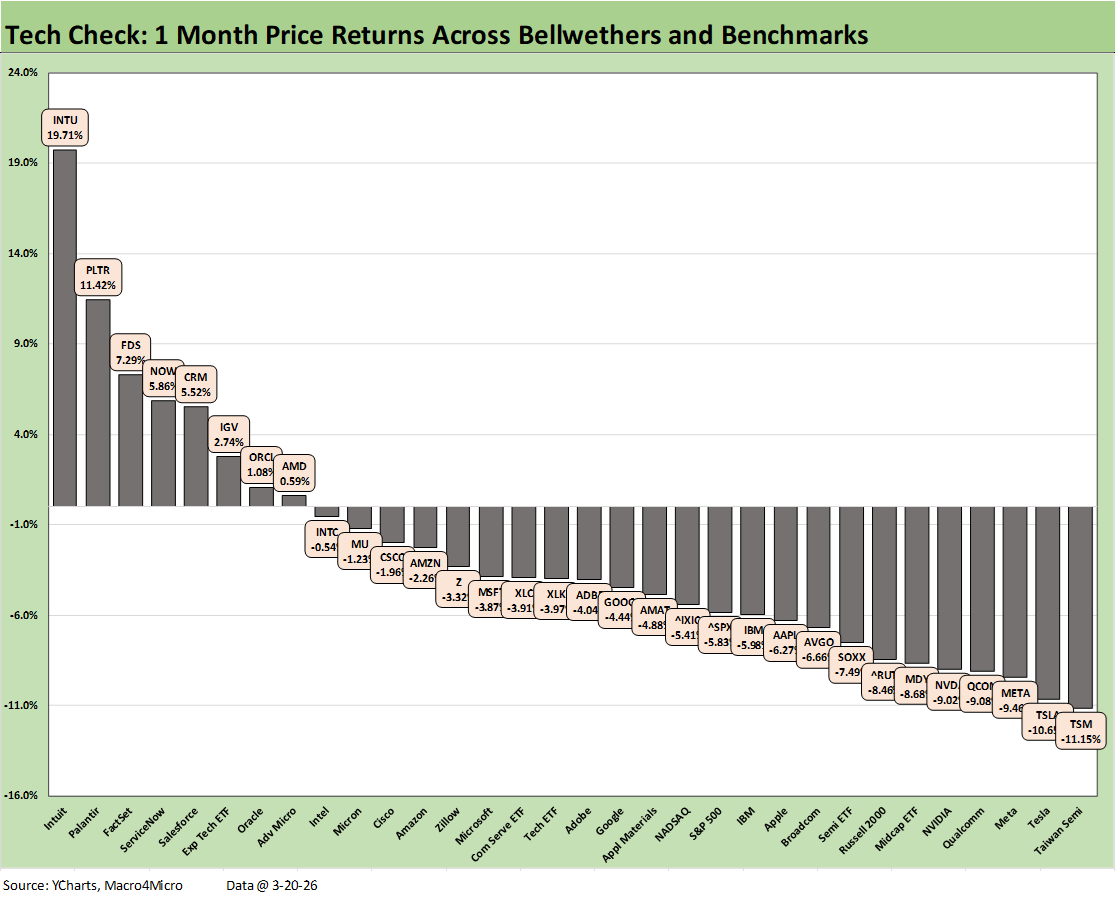
The 1-month “tech check” names posted a score of 8-24 on many of the same issues we discussed in the 1-week section. The challenge for tech valuation is increasing now given the inherent cyclicality of many customers and the potential need to revisit expense and capex budgets.
Challenges such as power costs will keep the focus on unfavorable energy CPI trends (even ex-oil) as electricity and piped utilities gas have been major headlines. Now we add oil into the equation along with soaring downstream products (gasoline, jet fuel, diesel).
We see the top quartile posting positive returns and everything else negative. Within that top quartile mix, we see some gradual recovery from the pain delivered in the SaaS panic. The YTD negative returns are broken out in the next chart. The top quartile in the 1-month returns includes such names as Intuit (INTU), FactSet (FDS), ServiceNow (NOW), and Salesforce (CRM). As detailed in the next chart, all 4 of these names remain deeply negative YTD. We see Zillow still in dead last YTD as that name had more than its share of other challenges.
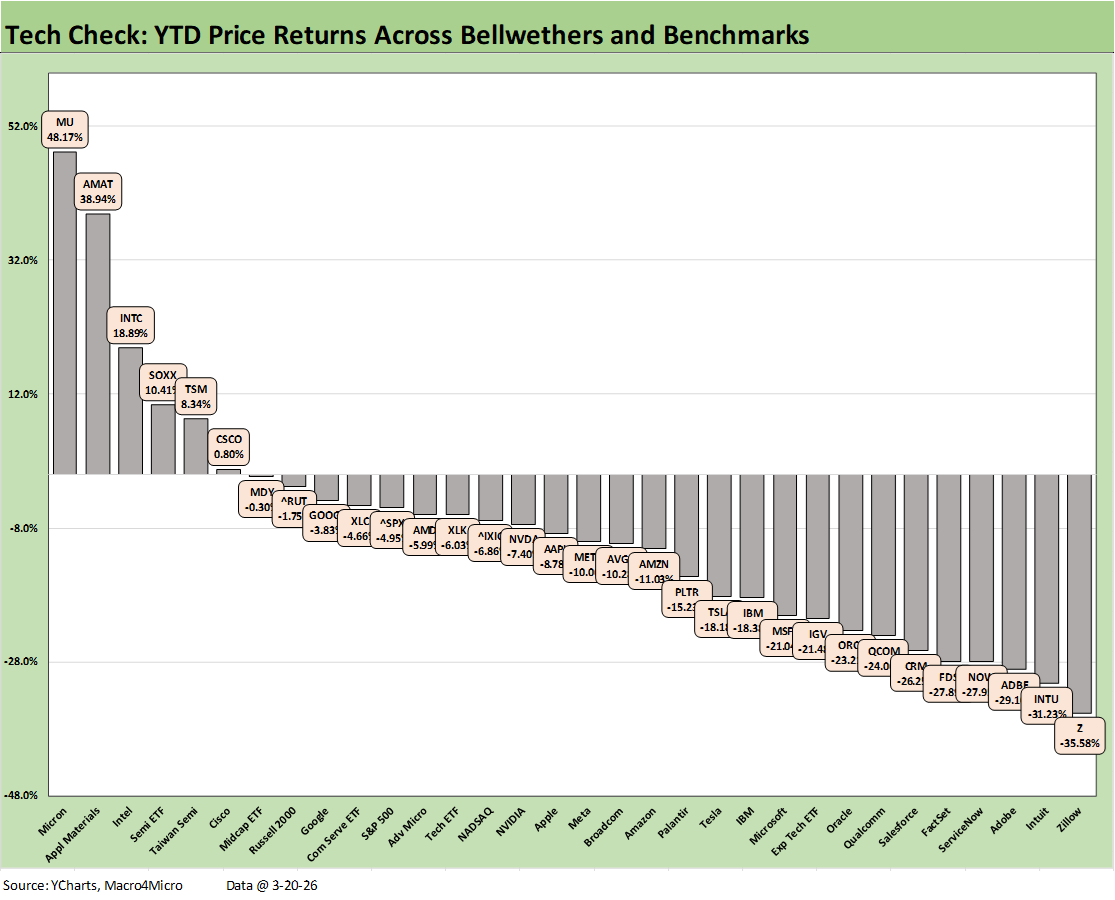
The YTD Tech check tells a clear story with a score of 6-26. Two of the top quartile names are negative and comprised of Midcaps S&P 400 ETF (MDY) and Russell 2000 at #7 and #8, respectively.
The winners YTD include Micron (MU) at #1 with a dramatic ride higher of +48.2%, Applied Materials (AMAT) at #2 with 38.9%, and Intel (INTC) #3 at 18.9% with the SOXX ETF at #4. Taiwan Semi (TSM) and another legacy name, Cisco (CSCO), rounded out the 6 of 32 running with positive returns YTD.
Sitting on the bottom is the collection of names impacted by the AI displacement panic. We see Zillow (Z), Intuit (INTU), ServicesNow (NOW), FactSet (FDS), and Salesforce (CRM) all worse than a -26% return YTD. Adobe (ADBE) was also in the bottom mix at -29.1% as various software names drove the Software ETF (IGV) to -21.4% at the bottom of the 3rd quartile.
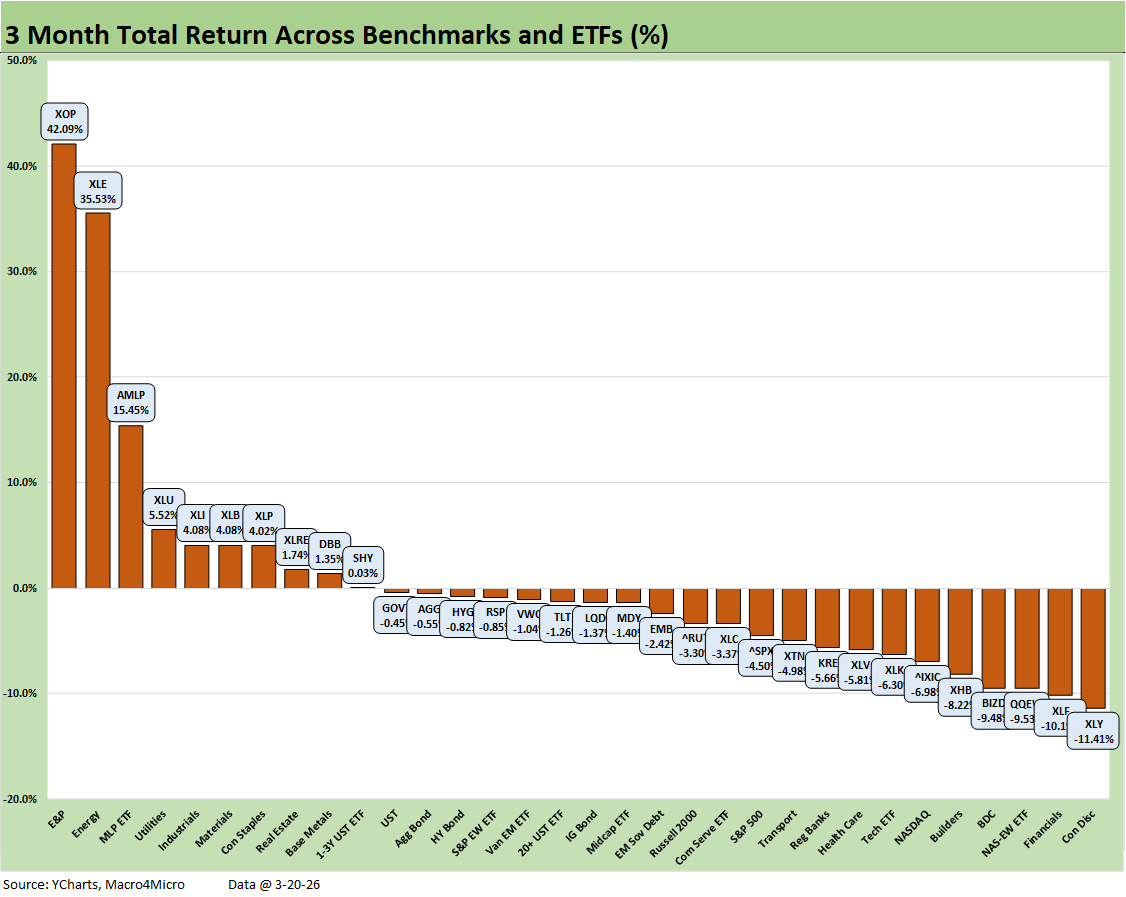
The 3-month mix across 32 benchmarks and ETFs stayed relatively consistent with a score of 10-22 and energy related ETFs (XOP, XLE, AMLP) holding down the top 3 spots with Utilities (XLU) a distant #4.
We see no tech-centric names in the top quartile, but the benefits of the earlier sector rotation saw the top quartile feature Industrials (XLI), Materials (XLB), and Consumer Staples (XLP). Real Estate (XLE) managed to edge into the top quartile despite the UST curve setbacks.
The bottom quartile mixed in some tech with interest rate sensitive equities (XHB) and some asset quality concerns found in the BDC ETF (BIZD) and Financials (XLF).
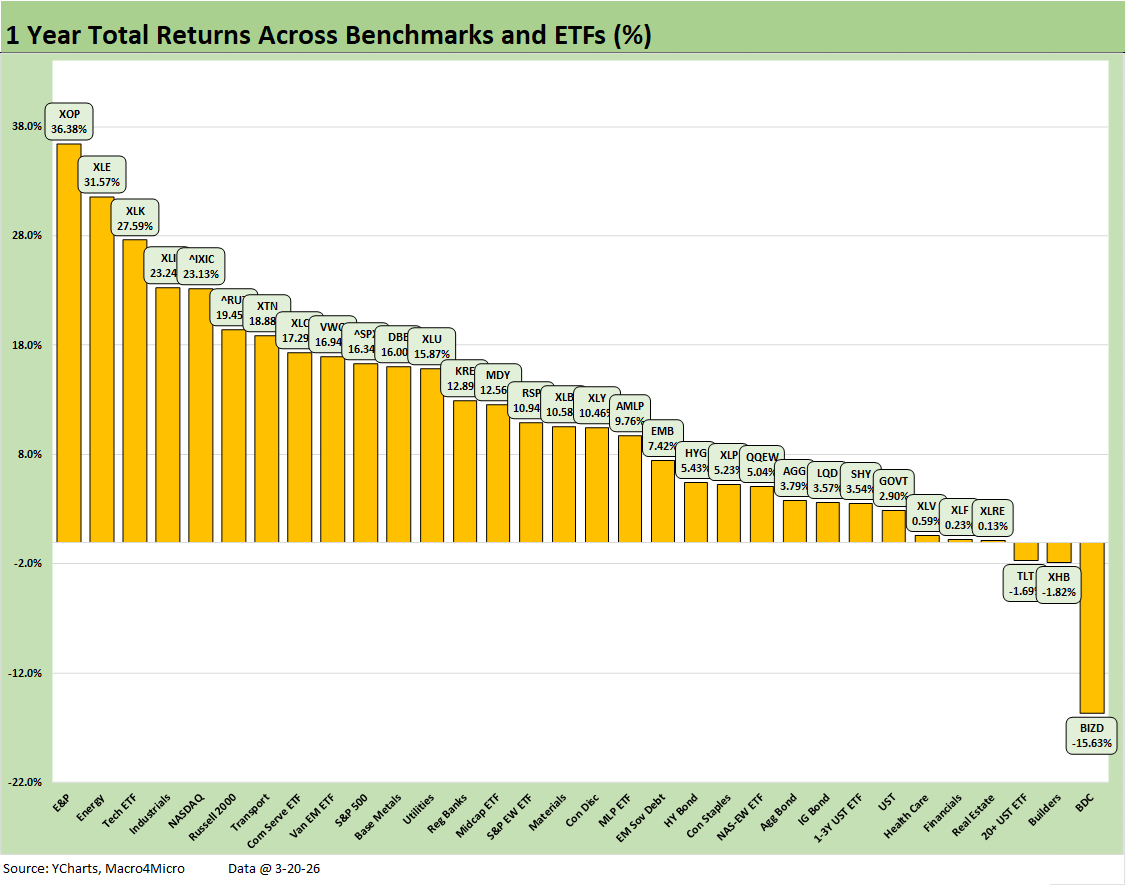
The trailing 1-year score of 29-3 is still living off the “old days” with the top quartile featuring Energy (XOP, XLE) on top and the Tech ETF (XLK), NASDAQ, and Communications Services (XLC) in the upper tier mix. Industrials (XLI) has been a steady, solid performer with a display of cyclical resilience and solid earnings trends. Small caps had a good year and beat the S&P 500, but that has been faltering of late.
See also:
Market Lookback: Confusion Reigns, Dislocation Pours 3-22-26
New Homes Sales Jan 2026: The Nays Carry 3-19-26
Producer Price Index Feb 2026: Getting Warmer 3-18-26
Industrial Production Feb 2026: Capacity Utilization 3-16-26
Market Lookback: The Gulf of Cause and Effect 3-15-26
Market Commentary: Asset Returns 3-15-26
PCE Inflation Jan 2026: Personal Income & Outlays 3-13-26
GDP 4Q25 Second Estimate: Sharp Move Lower 3-13-26
Housing Starts Jan 2026: Total Starts Up, Completions Up, Permits Down 3-12-26
CPI Feb 2026: It’s Making You Wait… 3-12-26
Existing Home Sales Feb 2026 3-10-26
Market Commentary: Asset Returns 3-8-26
Payrolls Feb 2026: Into the Weeds 3-8-26
Employment Situation Feb 2026: Payrolls Get Ugly 3-8-26
VIX: Market Still Not Getting the Vapors 3-6-26