
CPI Feb 2026: It’s Making You Wait…
The stable CPI metrics are still running above target with PCE inflation ahead this week and Iran fallout speculation heating up.


“But the CPI release said health care insurance was deflating?!”
Headline and Core CPI remain in check for Feb 2026 even if all eyes during the spring will be locked in on how the energy line and the scary impacts of higher freight and materials costs flow into other CPI lines. That includes food costs. Overall, the CPI mix looked a lot like Jan but is heading for a lot more change (see CPI Jan 2026: Reassuring Numbers, Missing Pieces 2-13-26). We get a PCE inflation update this week with PCE running ahead of CPI at this point (see PCE Income & Outlays Dec 2025: Inflation Reversal? 2-20-26).
Energy will remain the hot topic ahead as the Energy CPI of 0.5% (6.3% of CPI index) includes -5.2% for Energy Commodities (3.0% of CPI) along with Electricity (2.5% of CPI index) at +4.8% CPI and Utility Piped Gas (0.8% of CPI index) at +10.9% CPI. That Energy CPI includes a -5.6% CPI for Gasoline in the commodities bucket. The recent spike in gasoline will drive surcharges and delivery cost inflation in coming weeks and months that will necessarily flow into food, goods, and services as freight and logistics bills rise.
Health insurance inflation is one of those areas that the White House is unlikely to bring up given the trend in premiums experienced by the consumer. That said, right now the CPI line for health insurance shows deflation given the methods used by the BLS for health insurance. It is one of those issues (like Shelter and Owners Equivalent Rent) where the day-to-day realities of “cash-in, cash-out” at the household level don’t align with CPI. The reported Health insurance CPI is most definitely diverging from the household checkbook experience. We see a -3.6% YoY CPI for health insurance as of Feb 2026. Health care insurance has a CPI index weighting of 0.88% but punches above its weight class in importance for many consumers.
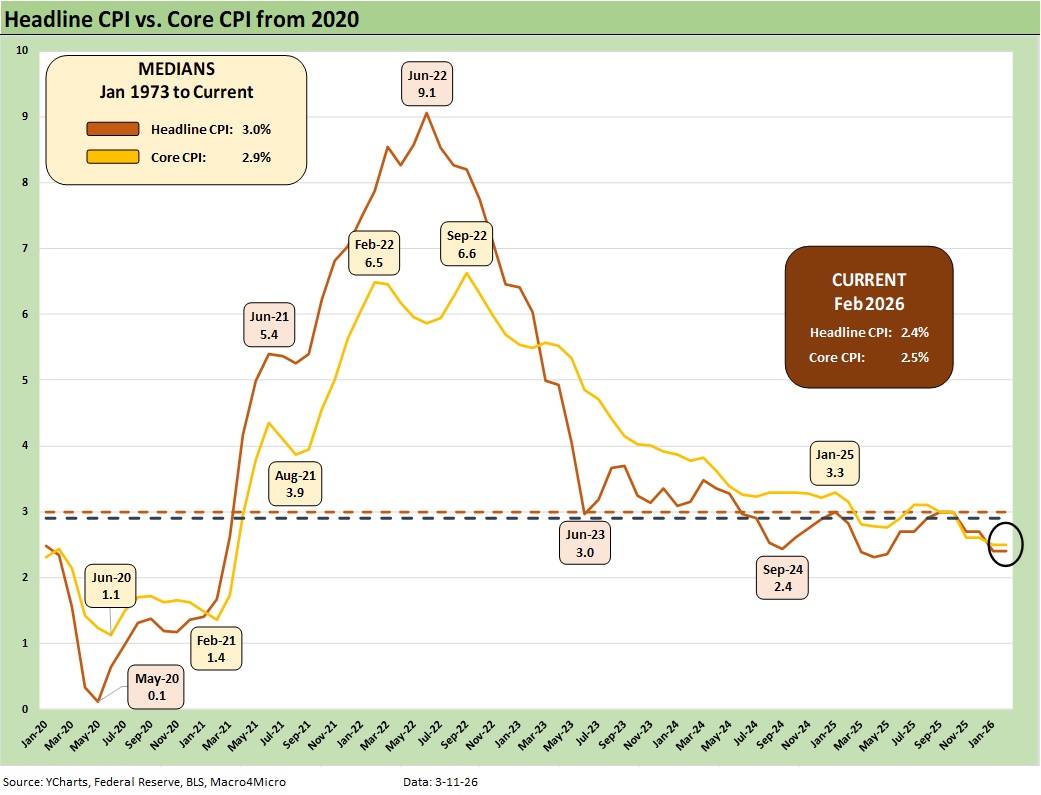
The above chart tracks the post-COVID journey of headline CPI and Core CPI since just before COVID and then across the inflationary spike into 2022. We saw the end of ZIRP in March 2022 and then the tightening cycle that saw sharply lower inflation across 2023 and into 2024. We see the 2.4% lows in late 2024 for headline CPI with the end of December 2024 at 2.9% for headline.
Trump always starts his bragging rights by comparing his CPI to June 2022, which is not how reality works. The FOMC did their job quite successfully across 2023 after they whiffed in 2021 by waiting too long. Trump doesn’t get to start his game clock at 9.1% in June 2022, and Trump should probably thank Powell and the FOMC for dealing him good cards.
By the numbers, the current +2.4% headline CPI is back around a recent Sept 2024 low point noted in the chart. The Feb 2026 2.4% headline and 2.5% core remain above target but are in a very good zone based on history. The Iran War and energy fallout is about to upset the applecart in coming weeks. For example, national retail regular gasoline is at $3.58 as we go to print, which is up by +22% over 1 month. Diesel is at $4.83 or up by 32% (Source: AAA). Diesel flows into the transport cost questions.
While Trump has slammed Powell and Biden as the most destructive forces since the Black Plague, the fact is that Biden was only the second President in 50 years to get through his term with no recession months. Clinton was the other recession-free President across two terms but with much better headline and PCE growth years to boast (see Presidential GDP Dance Off: Clinton vs. Trump 7-27-24). Avoiding a recession by late 2022 was a function of strong consumer spending and low unemployment that pushed through the CPI pain.
One could say that Powell led a Fed that tightened and beat inflation with no recession. Volcker had a double dip but also faced a much more dangerous inflation threat. We live in a policy world where the lack of blind obedience makes one the enemy subject to blame and the target of generally concept-lite and fact free attacks. Too often the attacks are economically incoherent. That will only muddy the analysis of the Iran war fallout.
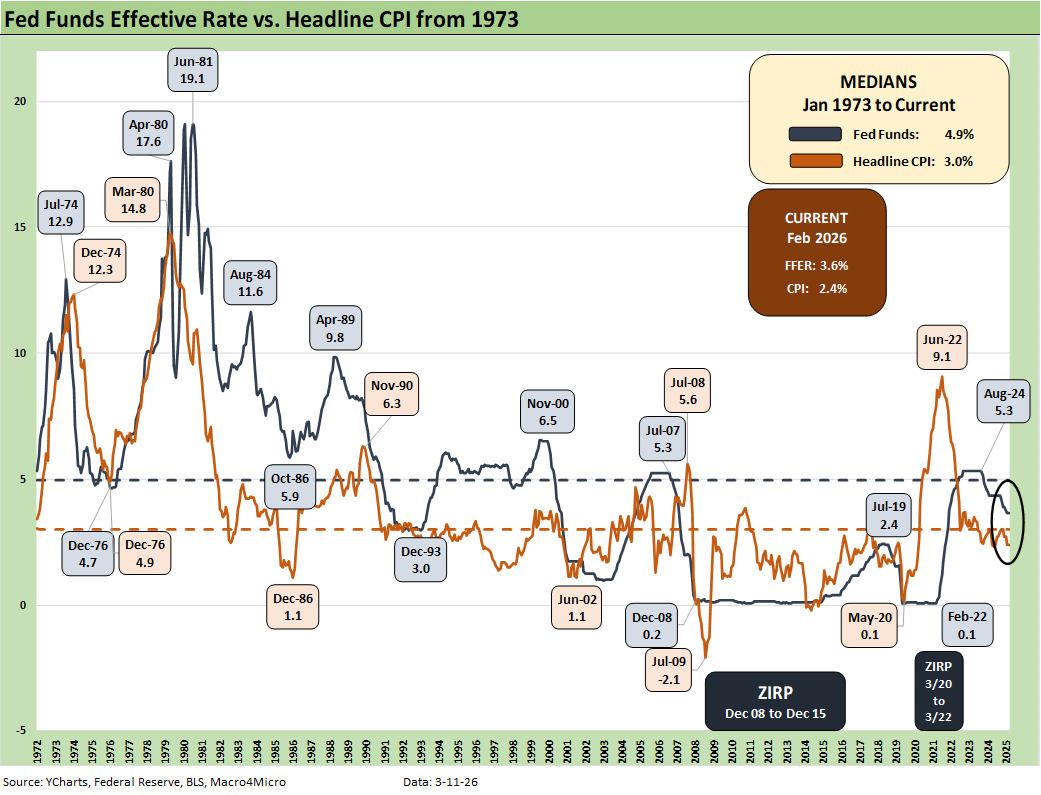
The above time series offers a reminder of the multiple market imbalances across the decades. The CPI spike in the aftermath of the COVID supply crisis teamed up with excessive stimulus action and the invasion of Ukraine by Russia in late Feb 2022. It is not a surprise that you never hear Putin’s role in the inflation spike cited by the White House.
The chart also offers a look at the first major inflation spike since 1979 brought Volcker into the job by August that year. The 1979 energy volatility is often framed as the “Iranian oil crisis” (sound familiar?). This current Iranian crisis is much more serious and damaging than the 1979 experience (unless you were a hostage). That period rolled into the mother of all tightening cycles from Volcker (including some 20% fed funds days) and a double dip stagflation cycle across 1980-1982 that crushed many bellwether companies.
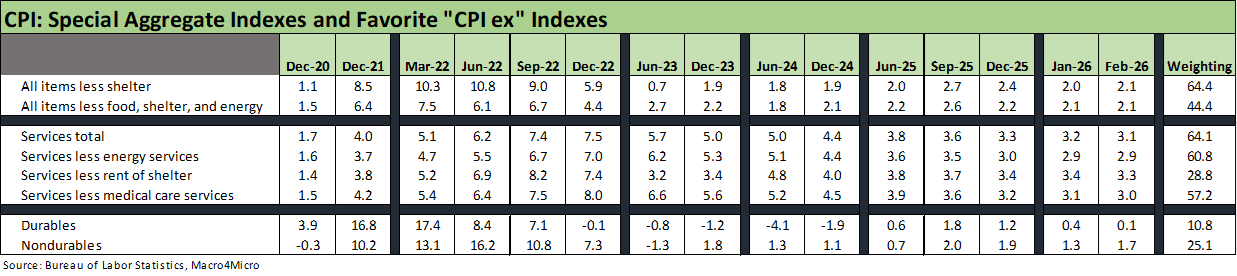
The above table updates the Special Aggregate indexes from Table 3 in the CPI release. Our favorite is “All items less shelter” since we consider Owners’ Equivalent Rent as a fairly useless derived metric that bears little resemblance to the household budget and the “cash in, cash out” checkbook experience. All items less shelter is at 2.1% in Feb 2026, which is down from the mid to late 2025 highs but above the 2023-2024 levels.
We see Services at 3.1% as the line remains stubborn in a services economy with a decent trend in consumer spending. We look for consumer spending metrics in GDP reports and the Personal Income and Outlays releases (we get both of those this week) among other releases (Retail Sales, etc.). Durables CPI levels are in check but above the deflation of 2023-2024. Nondurables also remain low in the sub-2% range.
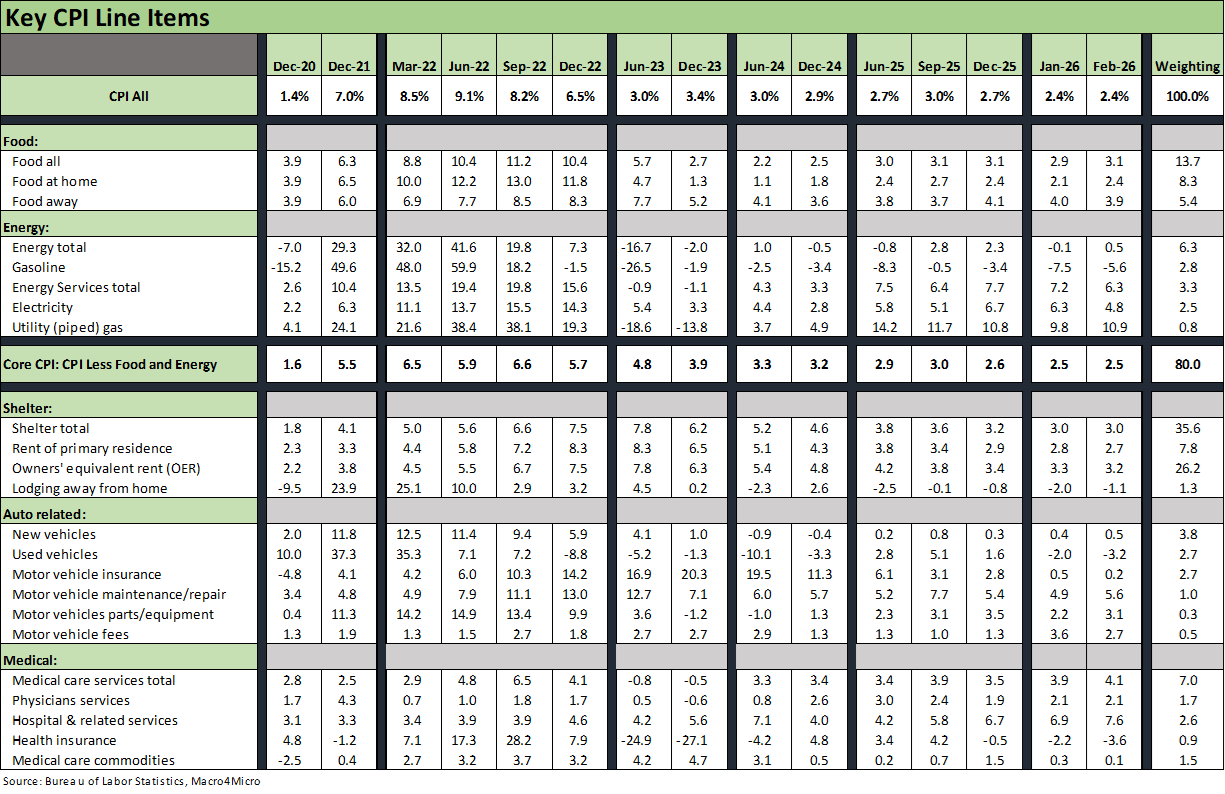
The above table details our Big 5 subsectors for CPI. These roll up to around 75% of the CPI index, so they are the main event. We already addressed energy and health insurance in the bullets above. Energy is already spiraling and swinging wildly the past week.
Medical care services at 4.1% includes “hospital and related services” at 7.6% with health insurance premiums soaring outside the BLS measurement. To the extent households drop off health insurance on affordability (notably ACA), they then must face that 7.6% CPI threat from hospital and related services.
We have put together a version of Automotive that is around 11% of the CPI index if we exclude gasoline, which we include in energy (see Automotive Inflation: More than Meets the Eye10-17-22). The discipline shown by OEMs in new vehicle pricing could be coming to an end in 2026 with small increases going a long way on big ticket items and funding costs seeing little relief so far.
The table above tells the story with “Food-all” at 3.1% or flat to Dec 2025. If we use “Food at home,” the 2.4% is also flat to Dec 2025. In other words, food inflation in general is not lower and not higher in Feb 2026 vs. Dec 2025. Both “Food at Home” and “Food Away from Home” are higher in Feb 2026 than in Dec 2024 (Biden’s last full month).
The story in the line items varies by product line. Meat CPI at 8.6% (Beef and Veal at 14.4%), Lettuce at 15.3%, Coffee at 18.4%, and Sweets at 9.0% are on the list of gripes for many, including me (I can live without the lettuce).
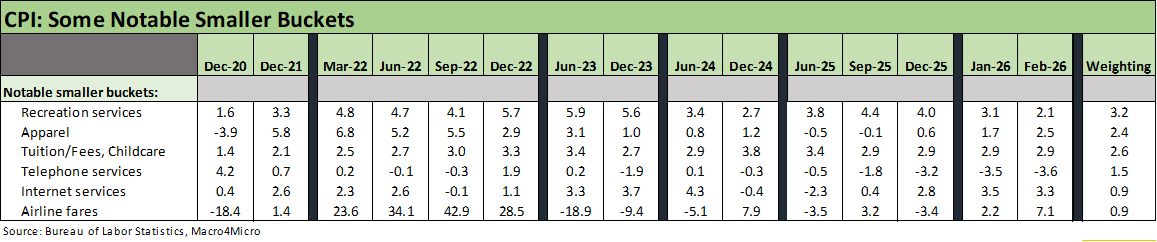
The above table highlights a few categories near and dear to many households. We see the lofty tariffs on the “labor arb” countries (notably in Asia) starting to show up in the Apparel line. Airline fares are tied to jet fuel prices, so that 7.1% line is just getting warmed up. How that will flow into vacation plans and business travel will be one to watch.
Some CPI Histories:
Inflation: The Grocery Price Thing vs. Energy 12-16-24
Inflation Timelines: Cyclical Histories, Key CPI Buckets11-20-23
Fed Funds – Inflation Differentials: Strange History 7-1-23
Fed Funds, CPI, and the Stairway to Where? 10-20-22
Automotive Inflation: More than Meets the Eye10-17-22
Inflation: Events ‘R’ Us Timeline 10-6-22
See also:
Existing Home Sales Feb 2026 3-10-26
Market Commentary: Asset Returns 3-8-26
Payrolls Feb 2026: Into the Weeds 3-8-26
Employment Situation Feb 2026: Payrolls Get Ugly 3-8-26
VIX: Market Still Not Getting the Vapors 3-6-26
Meanwhile…Back in Economics and Tariffs 3-2-26
PCE Income & Outlays Dec 2025: Inflation Reversal? 2-20-26
4Q25 GDP (Advance Est.): Less Distortion This Time 2-20-26
2025 trade Deficits: Reality vs. Rhetoric 2-19-26
Industrial Production Jan 2026: Capacity Utilization Trends 2-19-26
Home Starts Dec 2025: Wrapping a Weak 2025 2-18-26
Market Lookback 2-17-26
CPI Jan 2026: Reassuring Numbers, Missing Pieces 2-13-26
2025 Spread Walks and Multicycle Return Histories 1-5-26
Annual Return Differentials: HY vs. IG Across the Cycles 1-3-26