
Market Commentary: Asset Returns 4-19-26
We look at a wildly favorable event-driven swing this past week that could run into trouble this week as events continue to unfold or unravel.


In the cross-eyed eye of the beholder.
Geopolitical events and policy reaction fall into the “erratic is as erratic does” state of affairs. The Strait of Hormuz opened and closed again within 24 hours with a blockade of Iran continuing and the US military trying out its shoot-and-board operations on Sunday.
The military action against Iranian ports (a blockade is an act of war under international law) is a policy that is not yet showing enough room to maneuver if Trump’s goal is to declare victory and escape. The Houthis are on standby and the very strong desire to avoid boots-on-ground escalation is obvious even if a self-inflicted wound can never be ruled out with Team Trump.
Like many, we are not sure how much weight to give to logic on how this all plays out. Iran cannot be broken by threats and the willingness of religious zealots and the “bomb vest crowd” don’t fit into easy profiling strategies. Misjudging an opponent is easy to do when you think only about your advantages. The famous history book “The March of Folly” has a subtitle of “From Troy to Vietnam,” and that just sounds bad. The hope is that Team Trump will avoid writing its own chapter. There are plenty of small and large parallels in that book to Team Trump. That is a story for another day. The broad military purges did not help.
Despite the bad ending to the week after the close, the UST curve rallied and equities soared as we detail in the charts below. Some oil industry watchers were highlighting the threat to oil supply remains, and the rally to $83 on WTI futures (almost $11 of that on Friday) is extremely optimistic. As the markets opened up Sunday evening, WTI oil futures are heading higher by almost $7 as we go to print and equities are moving lower. This will be a busy week for US-Iran back and forth.
The major financials weighed in this past week, and the numbers are solid and offer some support that volatility in the headline themes (“war is hell”) and the flow-through risks of oil prices into consumer health, cyclical trends and stagflation risk will need time to play out – but from a strong starting position. Higher inflation and a very weak 4Q25 GDP print (the advance 1Q26 GDP numbers are released April 30) are not inspiring but earnings season will be favorable. Despite all the private credit risk unknowns on quality of marks (obviously low quality), broader credit contraction is not a front burner risk.
Consumer credit bellwethers Capital One (COF) and Synchrony Financials (SYF) turned in strong stock performances on the week and for the trailing 1-month period, so that offers some comfort for markets along with the major bank color. More regionals and small banks earnings reports are ahead.
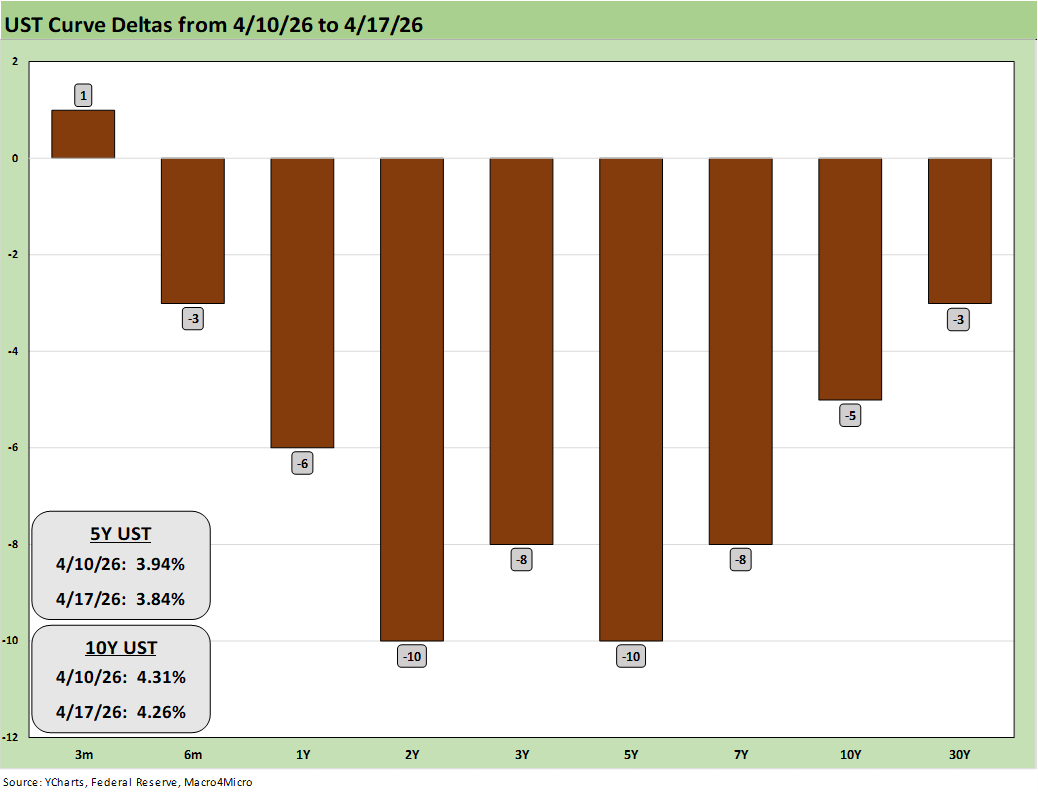
We look across asset class returns below, but we thought it worth highlighting the 1-week UST deltas above (Friday close). The above details the UST moves this past week with the deluge of news flow and wave of big bank earnings. Inflation fears eased and FOMC odds shifted.
We will see this week how oil reacts and flows into curve risk as negotiations resume and misinformation flows freely. The UST rally from 2Y to 10Y that we see above helped all the bond ETFs post positive returns this week. We see another FOMC meeting later this month, and that seems far away given the Iran backdrop.
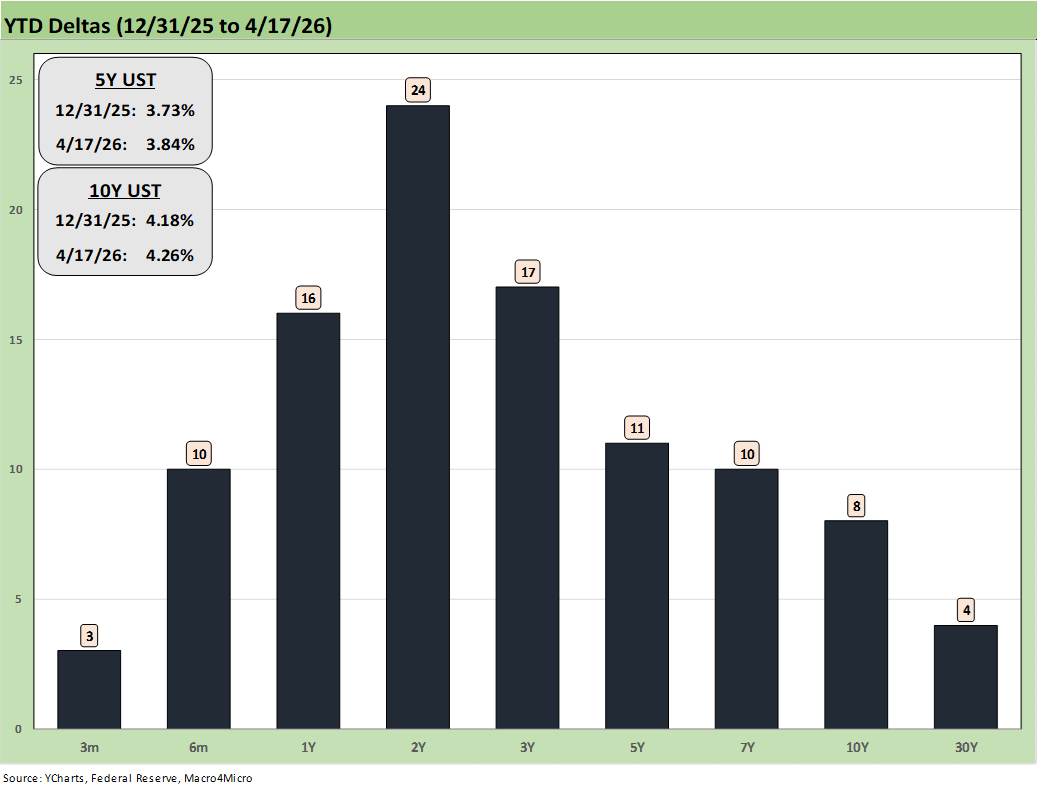
Above we update the UST deltas for the YTD period in what was an adverse move.
“I did it my way” could apply to a lot of bad actors across history…
The equity markets and bond asset class had tailwinds on the week as we detail below, but the challenge is pricing the risk on a forward basis despite some very unpredictable moving parts. Even as markets should be pricing for the next round of geopolitical news, the range of potential outcomes is just too wide.
The logic of the good scenarios are just as easy to frame as massive downside and escalation (Houthis weigh in, rockets and drones flying all over the Gulf, Iraq militia joins the party, too many US boots-on-ground, Israel gets busy again, etc.).
That set of military and oil risks would drive FOMC policy more than a new Fed chair with an axe to grind. Meanwhile, Trump is threatening to fire Powell while replaying Sinatra songs in a truth social post (“I did it my way”). That Sinatra classic was recorded in 1968 (the year when Trump dodged the draft and met the Vietnam challenge “his way”). Trump should have gone with “Luck be a lady tonight.” After all, gambling is more relevant to the decision (Guys and Dolls).
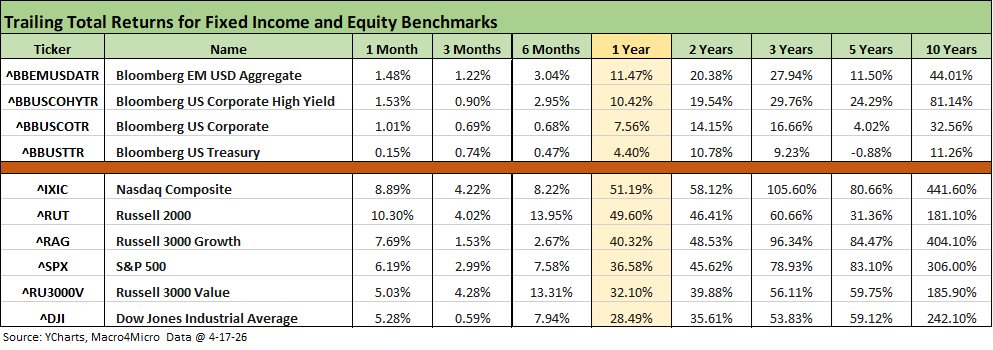
The above table updates the rolling time horizon returns for fixed income and equities. A couple of good weeks in April made all the difference with the 1-month and 3-month returns all in positive range for equities and debt. That was especially the case in equities after posting a very impressive rally following a grim March (see Market Commentary: Asset Returns 3-30-26). The above table has now flipped back from all negatives in debt and equities to end March in 1-month and 3-months into the current profile of all positive.
The rolling return visual
In the next section, we get into the details of the 32 ETFs and benchmarks for a mix of trailing periods. Below we offer a condensed 4-chart view for an easy visual on how the mix of positive vs. negative returns shape up. We see it as a useful exercise in looking for signals across industry groups and asset classes.
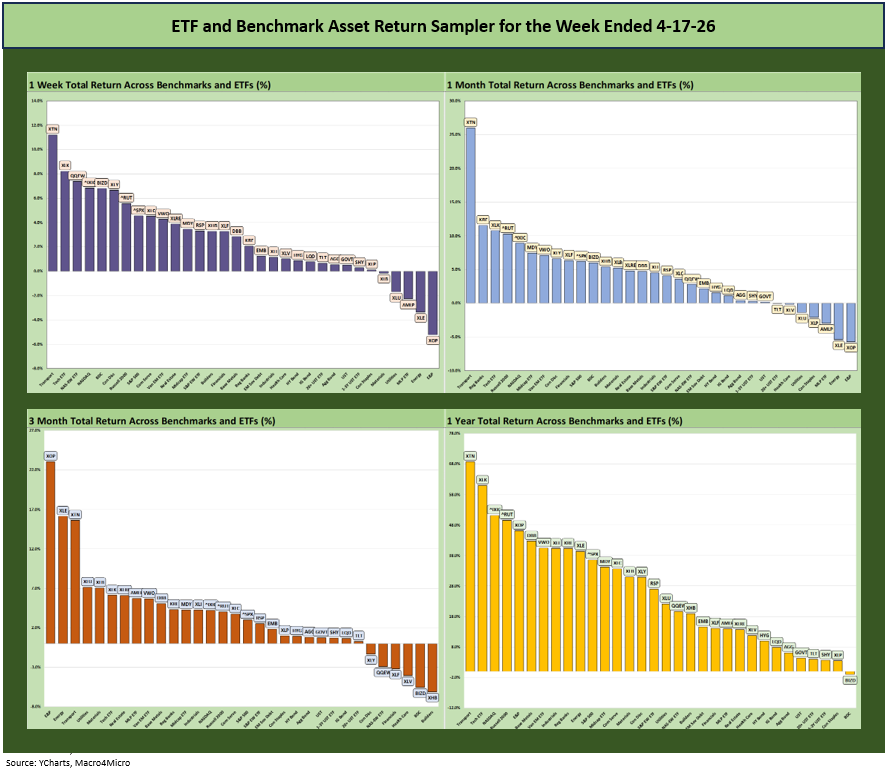
The symmetry of returns clearly shifted into April as peace threatened to break out. For now, that peace is highly uncertain in the Gulf with the policy strategy more a matter of what markets might speculate will unfold rather than what is a more rational outcome across irrational parties.
The Iranian game plan is intrinsically overlapping with religion while the US toggles between a focus purely on national security (nukes that had been billed as “obliterated” not long ago) and an uncertain mix of religion and brinkmanship from Hegseth, who spends far too much time attacking the media in his updates and openly brings his evangelical extremism into briefings.
Add Team Trump’s public dispute with the Pope, and it safe to say the White House and Defense leaders have not delivered FDR-style pep talks.
Hegseth really went off the rails in an Iran update this week, calling the media “Pharisees” and quoting Mark 3:1-6, which implies Trump is Jesus. That did not get much follow-up coverage from the mainstream media who are semi-cowed these days. Hegseth’s routine was flat out bizarre.
The following took too much of Hegseth’s briefing:
From the Book of Mark 3:1-6 (KJV)
1 And he entered again into the synagogue; and there was a man there which had a withered hand.
2 And they watched him, whether he would heal him on the sabbath day; that they might accuse him.
3 And he saith unto the man which had the withered hand, Stand forth.
4 And he saith unto them, Is it lawful to do good on the sabbath days, or to do evil? to save life, or to kill? But they held their peace.
5 And when he had looked round about on them with anger, being grieved for the hardness of their hearts, he saith unto the man, Stretch forth thine hand. And he stretched it out: and his hand was restored whole as the other.
6 And the Pharisees went forth, and straightway took counsel with the Herodians against him, how they might destroy him.
A former Fox news personality lecturing the media on honesty and facts is not without its intrinsic humor, but the religious extremism closes the gap on common style points with the Iranians on the other side.
Attacking the media at length and then citing the above passage was just flat out strange. The use of the Mark language by Hegseth basically says, “Trump is Jesus, the media are evil pharisees, and they are plotting to destroy him.” It is hard to read any other way even if they deny the intent.
I had 4 priests and a nun in the family, so no disrespect to the religious among us. Some of my great uncles were redemptorist missionaries during their time (primarily serving Latin America) and served when fundamentalist evangelicals raged against Irish and Italian Catholics and immigrants. Anti-Catholicism, racism, and xenophobia were rampant, and they griped about the Pope in those days also (Papists, etc.). We have come so far.
The impulse to politicize the military while invoking prayer and scripture in such extremist fashion further inflames the sense of domestic political risk linked to the authoritarian ambitions of the leadership team (see The US as an Aspiring Emerging Market: Fiscal SNAFU, Political FUBAR 4-6-26).
The Magnificent 7 heavy ETFs…
Some of the benchmarks and industry ETFs we include have issuer concentration elements that leave them wagged by a few names. When looking across some of the bellwether industry and subsector ETFs in the rankings, it is good to keep in mind which narrow ETFs (vs. broad market benchmarks) get wagged more by the “Magnificent 7” including Consumer Discretionary (XLY) with Amazon and Tesla, Tech (XLK) with Microsoft, Apple, and NVIDIA, and Communications Services (XLC) with Alphabet and Meta.
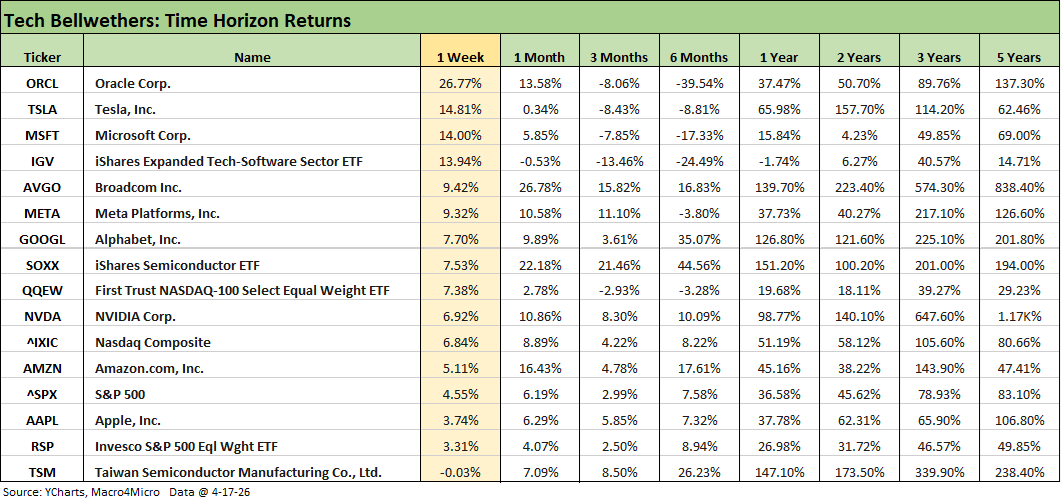
The above table updates the returns for the tech bellwethers and various benchmarks and ETFs. The tech rebound was impressive to say the least with the volatile Oracle (ORCL) rebounding sharply but still negative over 3 months and 6 months. Taiwan Semi (TSM) was the only name slightly in the red, but TSM has been a winner YTD in the top quartile group.
We see 6 of the Mag 7 ahead of the S&P 500 and 5 of the Mag 7 ahead of the NASDAQ. The Software ETF (IGV) made a major comeback this past week but is still negative for 1 month, 3 months, 6 months and 1 year. The Semiconductor ETF (SOXX) has been the big winner vs. the IGV across 1-month and back across the other time horizons.
The commentary below is mostly a cut-and-paste from an earlier post on LinkedIn on Saturday with some additional input:
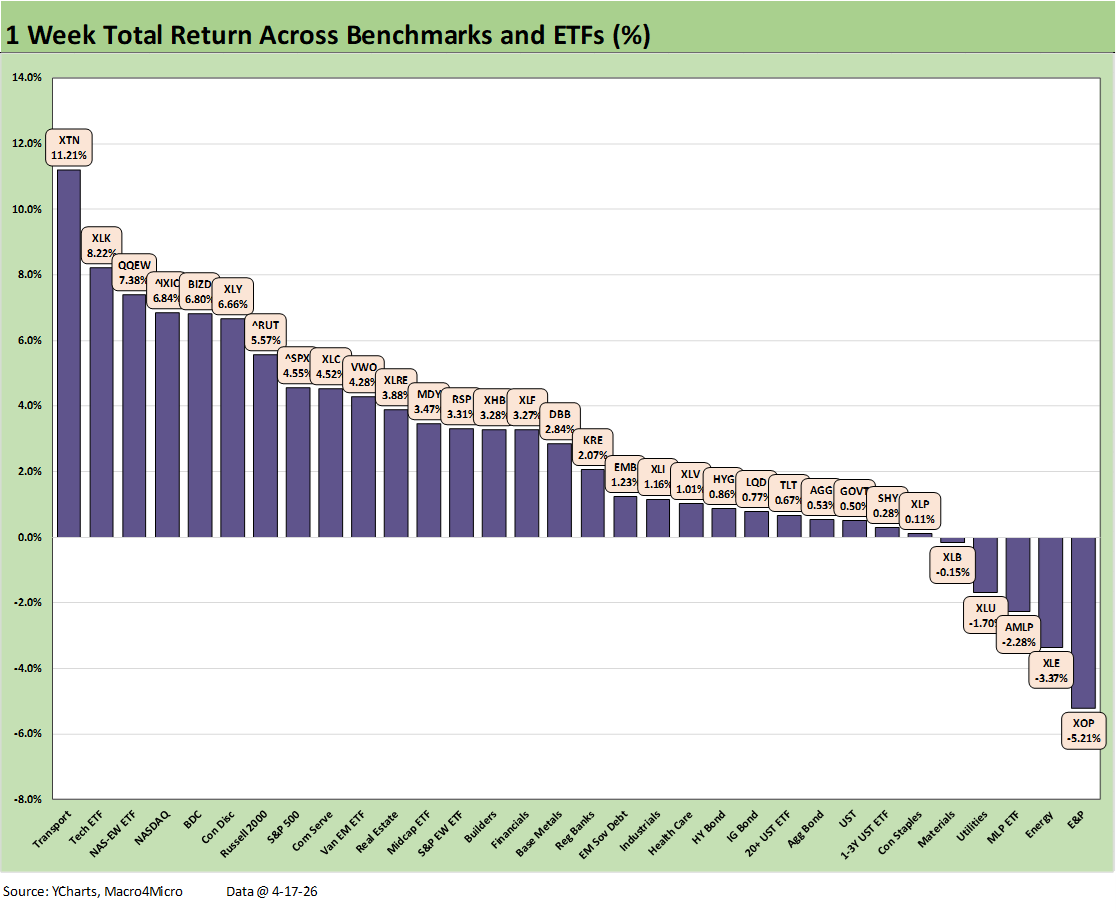
We update the 1-week total returns on the 32 benchmarks and ETFs we track. The scale and breadth of the rally was impressive as the market closed confident that the Strait of Hormuz was open and that the two sides (Trump vs. Iran) could climb down from the brink with stagflation threats easing.
After the market closed, the headlines turned sour. The Strait is no longer open as we go to print after Iran had closed it again (and fired on a tanker). Trump was active on the screen Saturday with extreme optimism, but that is a day ending in Y. He was making heavy threats again by Sunday and a vessel was fired upon and boarded by the US military.
The market needs to handicap outcomes facing the recurring problem that the representations of Trump and Iran are seldom on the same “fact” page – let alone how to interpret the “facts.” On one side, we have Trump, who changes his set of facts and opinions when the wind blows. It does not help that he seems to have a few loose bolts of late. On the other side, we have religious fanatics that hate America.
One person can see Trump as a game theory guru and brilliant negotiator while another person sees a serial liar whose faculties are on a shaky fault line. The world economy is in the grip of these negotiations. China is holding back on the situation so far with Iran a massive oil supplier. The potential boarding of a Chinese bound vessel could escalate tensions.
The idea that Iran would agree to all Trump’s demands was strange enough. A logical sequence would be that the Houthis would perk up and Iran’s response to Trump would be “You want ‘the dust’? Come and take it.” It all gets very subjective quickly.
The moving parts present a wide range of potential outcomes. That can make for herd investing and momentum chasing by investors with a range of time horizons that start “by lunchtime” and extend from there. More than a few are hanging on insider leaks and the disinformation circuit.
The 27-5 score above reflected the discounting of major progress peaking with the “Strait is open” news. The energy ETFs (XOP, XLE, AMLP) are in the bottom 5 joined by Utilities (XLU) and the chemicals-heavy Materials ETF (XLB).
The Tech ETF (XLK), Equal Weight NASDAQ 100 ETF (QQEW), and NASDAQ benchmarks were in the Top 5. We look at tech bellwethers in a separate weekly “Tech Check.”
The Transports ETF (XTN) ranked #1 as airlines soared on Iran expectations and related fuel optimism that might bring moderation in upward fare pressures that to this point have not put a dent in volume guidance – yet. The AAL M&A speculation helped during the week, but AAL rejected that overture by the weekend. Freight and logistics providers rallied impressively on a range of factors from Iran and diesel to an easing of AI jitters threatening business models (e.g. freight brokerage). BDCs (BIZD) posted their best week in a while and made the top quartile. The private credit drama will stay hot and heavy with 1Q26 earnings season.
The commentary below is mostly a cut-and-paste from an earlier post on LinkedIn on Saturday with some additional input:
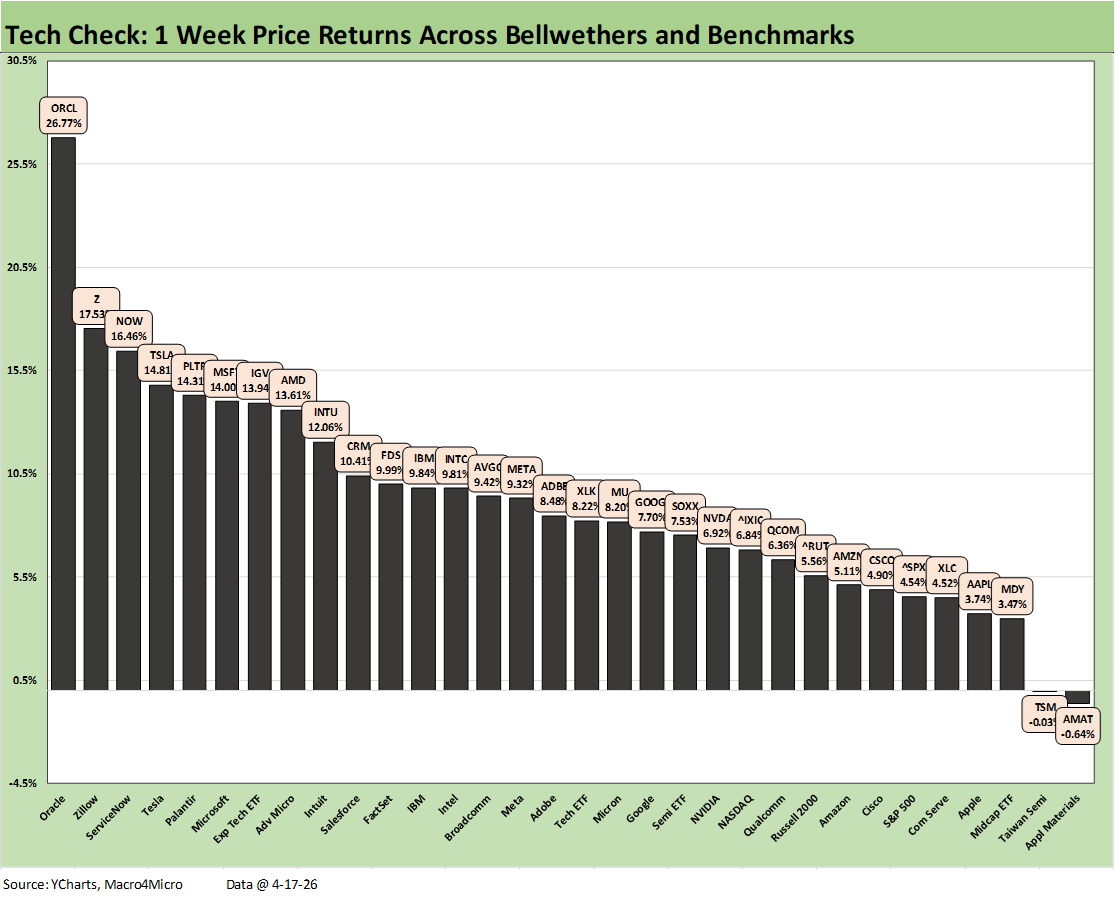
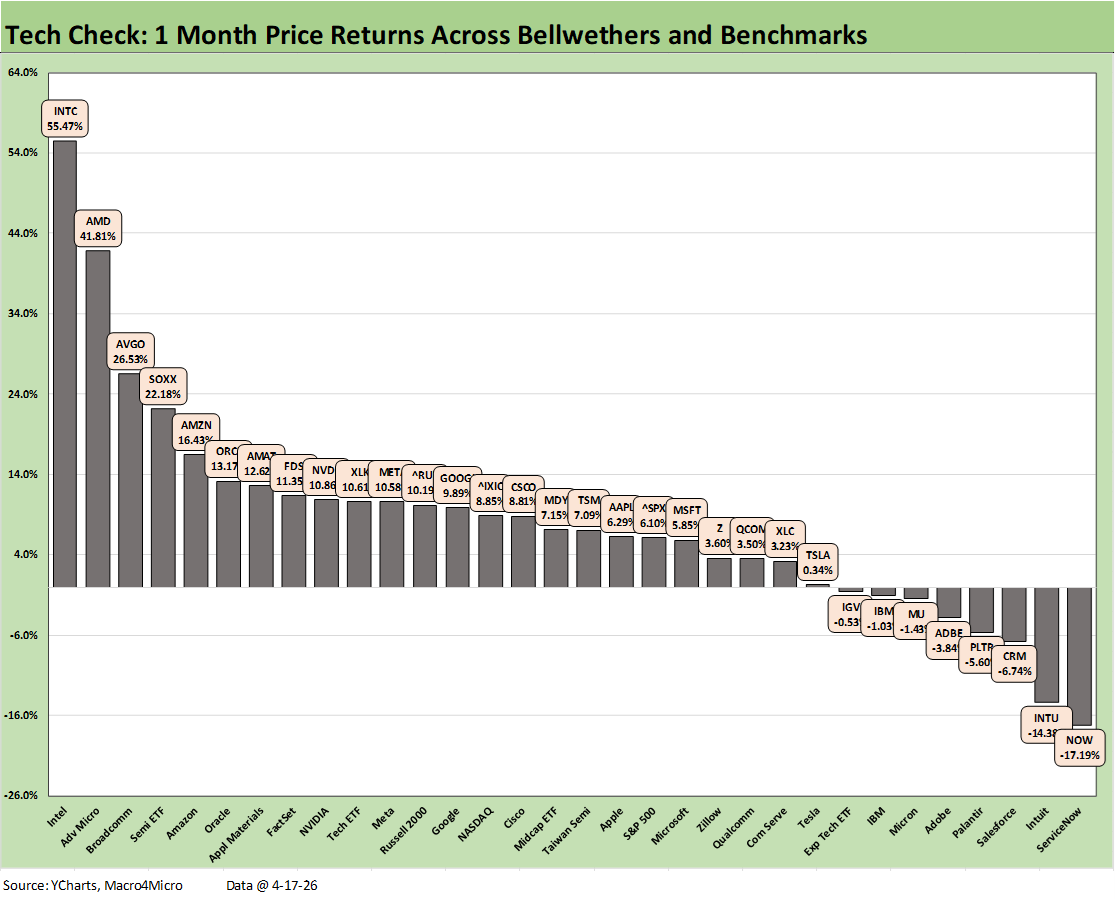
The weekly Tech Check price return chart shows a wild rally for a wide range of the tech subsectors after some recent punishment of SaaS-centric services and software asset lines. The Iran chaos has been a problem for cyclical fears and valuation metrics setbacks that combined with anxiety around tech sector business model threats from AI.
The past week rode the Iran relief and some calming around the tech industry post-AI scenarios for some SaaS services names to post a 30-2 positive to negative score. Only Applied Materials (AMAT) and Taiwan Semi (TSM) were in the red but with very slightly negative returns. It is worth noting that AMAT and TSM are in the top quartile for returns in this mix on a YTD basis.
For the suffering holders of recent underperforming tech stocks, we see some good news with the SaaS-centric names in the top quartile and upper end of the second quartile. We see Zillow (Z) and ServiceNow (NOW) in the top 3 with the Software ETF (IGV) and Adobe (ADBE) also in the top tier. Just across the line we see Intuit (INTU), Salesforce (CRM), and FactSet (FDS) in the upper end of the second quartile. Those equities – INTU, NOW, Z, CRM, and ADBE – are the bottom 5 on a YTD basis with negative returns from -30% handles to -40% handles.
The winners on the week include Oracle (ORCL) at #1 (+26.8%) after a rough stretch that still shows ORCL at -10% YTD. The Mag 7 were spread across the quartiles with TSLA and MSFT in the top tier for this week but still being in negative range YTD with TSLA at -10.9% and MSFT at -12.5%. The bottom tier included Apple (AAPL) and Amazon (AMZN). Across the Mag 7+3, ORCL was leading the pack at #1 with Taiwan Semi at #31.
For the 32 benchmarks, ETFs, and bellwethers above, the median price return for the week was over +8.3%. Meanwhile, the median price return for this same mix on a YTD basis is only around +4.2% with a positive vs. negative score of 18-14.
The Hi-Lo return differential between #1 Intel and #32 Intuit is a lofty 126 price return points. If we throw out the Hi-Lo names, we see Micron at #2 vs. ServiceNow at #31 with a return differential of over 96 points YTD. We look at the broader time horizon mix in a separate asset return piece.
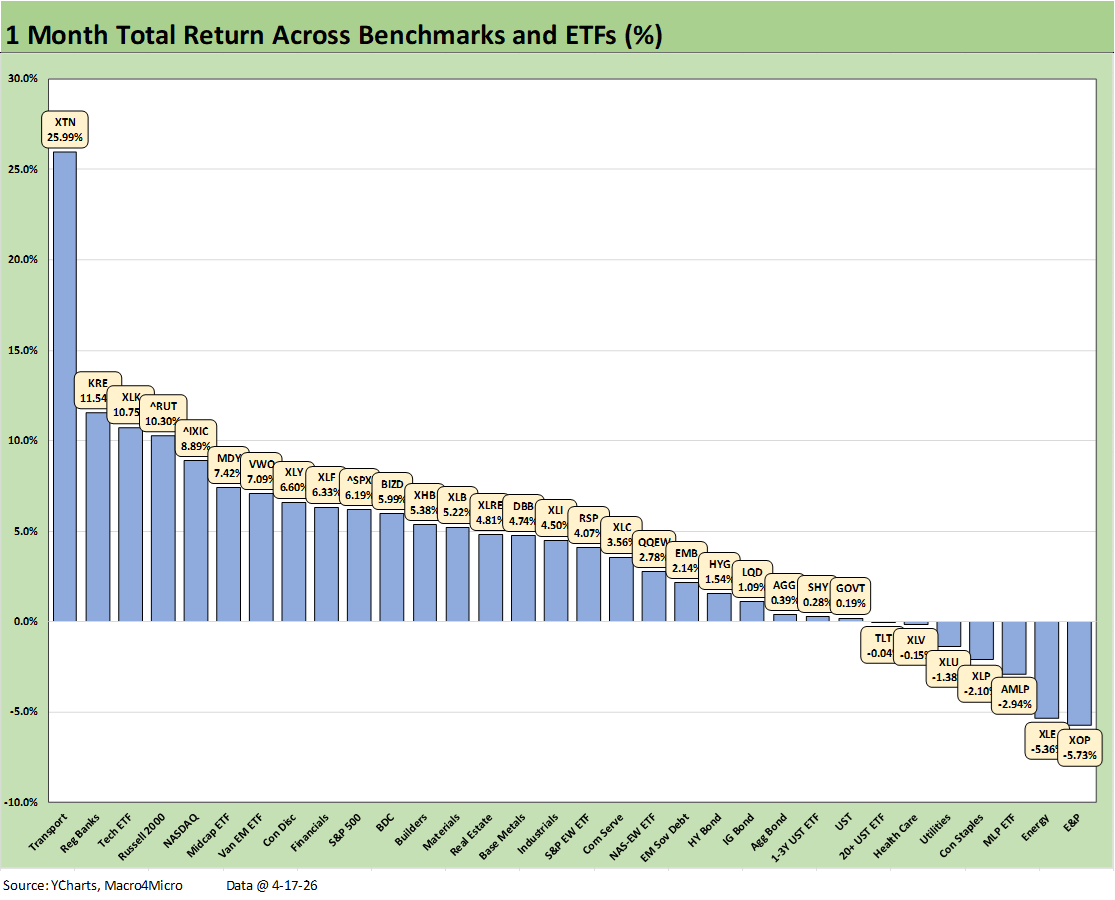
The 1-month returns in the 32 benchmarks and ETFs show 3 of the 4 major benchmarks in the top quartile with the small cap Russell 2000 at #4 just ahead of the NASDAQ at #5 and Midcaps at #6 with the S&P 500 in the upper end of the second quartile.
We see Transport ETF (XTN) getting a big boost this past week (see the 1-week numbers) as relief on jet fuel and fare pressure supported a rally for airlines. Meanwhile, less cyclical fears and relief on diesel help boost freight and logistic operators. The “AI panic” on business models has also eased a bit for data-centric freight brokerage operators.
The Tech ETF (XLK) at #3 is just behind Regional Banks (KRE) at #2. The Financials ETF (XLF) is just across the line the top of the 2nd quartile.
Overall, that is a cyclically diverse mix in the top quartile. We even see the BDC ETF (BIZD) mounting a small comeback for this period with Homebuilders (XHB) climbing back after sitting in last place for 3 months.
In terms of bond ETFs, we see 6 of 7 in positive range. The long duration UST ETF (TLT) fell just below zero at -0.04%.
The 1-month “Tech Check” shows the divergence between semiconductors and software and the pain inflicted on the SaaS-centric services operators. The bottom 3 names include ServiceNow (NOW), Intuit (INTU), and Salesforce (CRM). Adobe (ADBE) has been another software name taking a beating along with Palantir (PLTR) as one of the bigger holdings in recent periods in the IGV ETF.
The gap between the Semiconductor ETF (SOXX) at +22.2% in the top quartile and the Software ETF (IGV) at -0.5% in the bottom quartile sizes up the recent trends. Some of the SaaS names have been swinging around in dramatic fashion such as Zillow (Z) and FactSet (FDS). Those two names were in positive range for the month but still deeply negative YTD as we cover in the next chart.
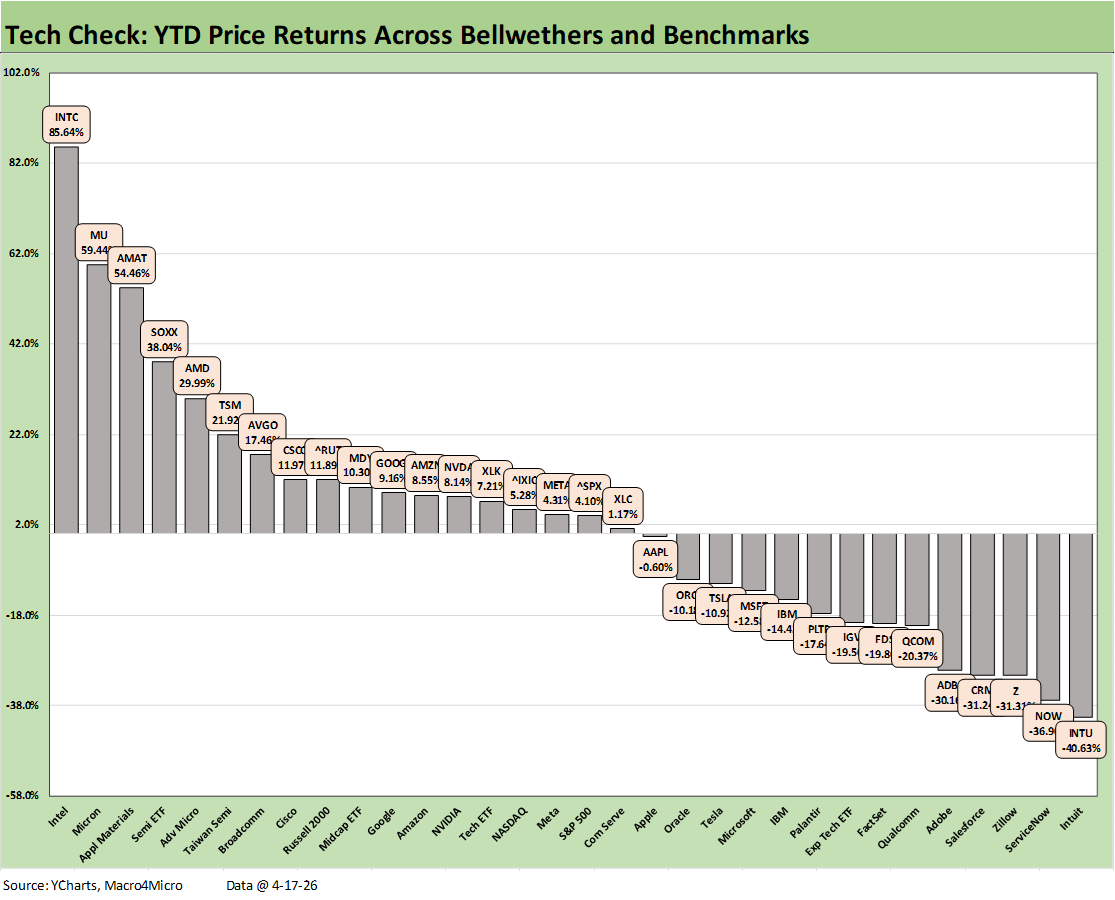
The YTD return profile for the Tech Check list of 32 is grim in broader market context at 18-14. If we exclude the 4 broad market benchmarks (S&P 500, NASDAQ, Midcap 400, Russell 2000) the score is14-14 in a market where the NASDAQ and S&P 500 have hit records.
The depth of the negative returns on the right side of the chart makes a statement with the bottom quartile running from -19.5% for the Software ETF (IGV) down to -40.6% for Intuit (INTU) in last place. The YTD price returns post a Hi-Lo range of 126 points. The AI panic around the sustainability of SaaS business models has been addressed constantly in recent weeks and the numbers are ugly YTD.
We see some old school legacy names on top with Intel (INTC) at #1 at over 85% followed by Micron (MU) at +59.4%, capex sensitive Applied Materials (AMAT) at +54.5%, and the Semiconductor ETF (SOXX) at #4 with 38.0%. As noted earlier, the return on SOXX blows away the Software ETF (IGV).
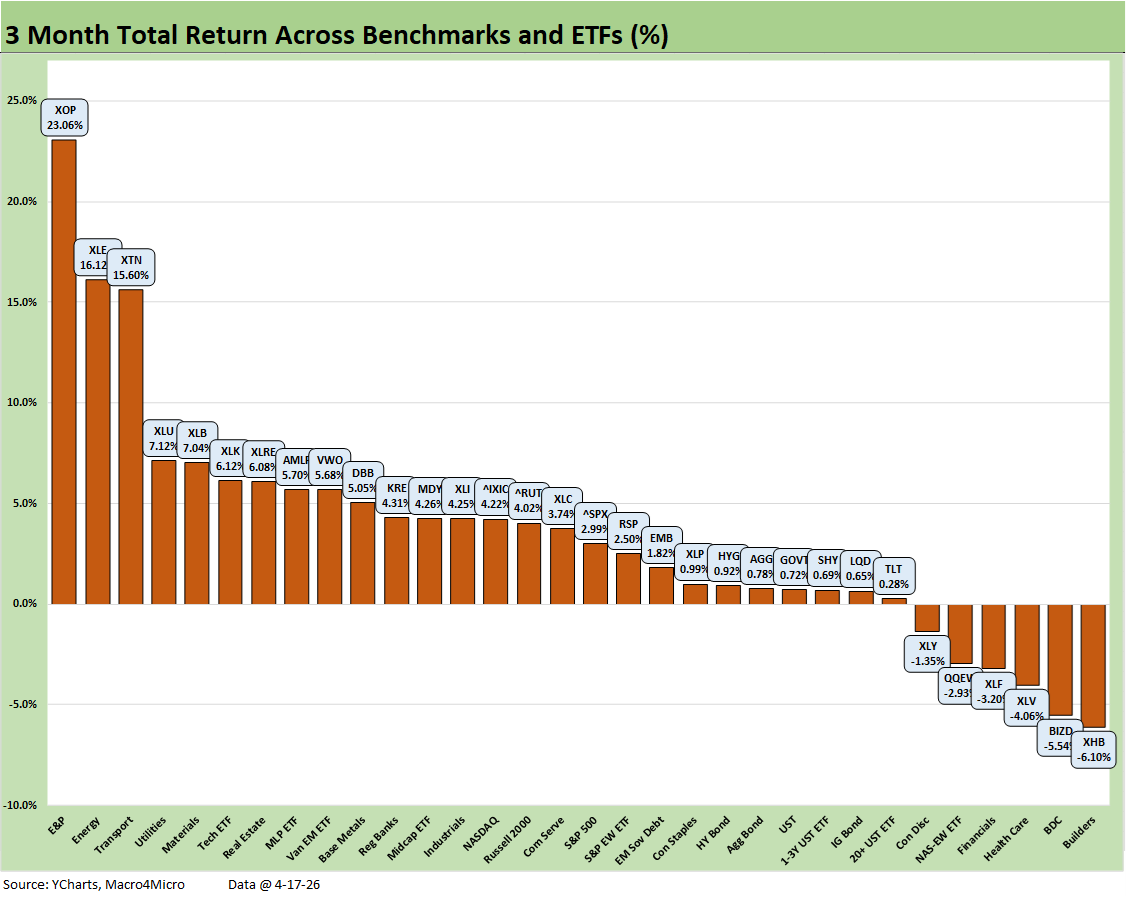
The score for 3 months for the 32 benchmarks and ETFs weighed in at 26-6. We see 3 energy ETFs in the top quartile with E&P (XOP), diversified Energy (XLE), and Midstream (AMLP). The Utilities ETF (XLU) is also in the top 5 with the chemicals-heavy and cyclically exposed Materials ETF (XLB). The Tech ETF (XLK) is the only tech-centric asset line in the top quartile, and we also see EM Equities (VWO) with the interest rate sensitive Real Estate ETF (XLRE).
As we discussed in the weekly and 1-month charts, we see Transports (XTN) rallying back impressively on what seemed to be a reasonable solution to the Strait of Hormuz problem before it immediately blew up.
Trump overplayed his hand by not easing the Iran blockade if his goal was to declare victory and avoid committing thousands of troops. If Iran was the GOP senate, he would be fine since they would all fold. Trump’s ignorance of Iran and the culture now put him in a very challenging situation that makes it harder for his ego risk. This in turn provides worse risk symmetry in the next steps.
The 6 negative returns in the mix are a diverse lot with Homebuilders (XHB) about more than mortgage rates as the outlook for housing has dimmed with consumer confidence tanking and fears of payroll setbacks and weaker real wage growth. The higher mortgage rates initially seen after Iran were joined by other headwinds for housing.
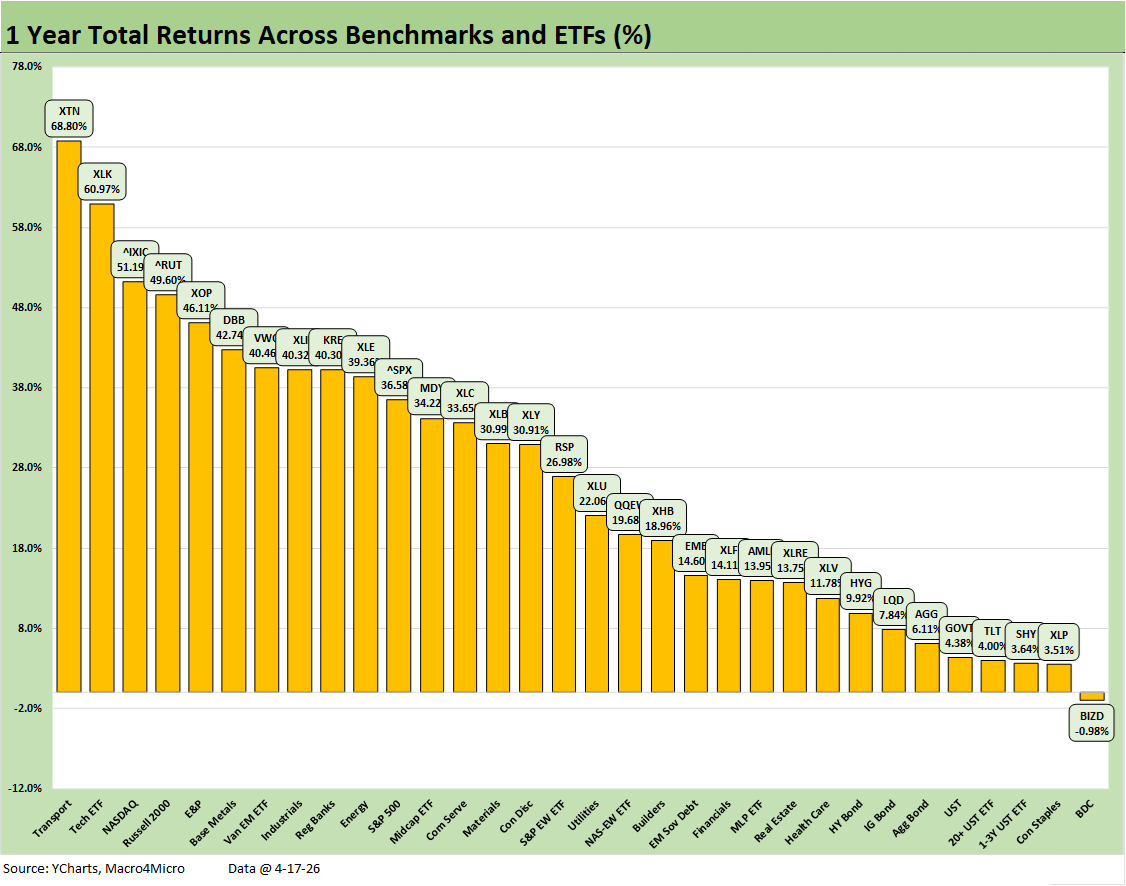
The trailing 1-year mix of returns is still riding a good 2025 with a mixed 2026 by sector. The 31-1 score just shows the BDC ETF (BIZD) at a modest negative. All the bond ETFs are positive with the 2025 UST shifts a bigger factor (Total Return Quilt Across Asset Classes 2008-2025 1-2-26). As noted earlier in the piece, the yield curve story in 2026 has been a tough one and remains highly uncertain around inflation and oil.
See also:
Industrial Production March 2026: Mixed Picture, Big Questions Ahead 4-16-26
Existing Home Sales March 2026: New Beginnings or New Ends? 4-15-26
Producer Price Index March 2026: Heater or Curve Ball? 4-14-26
Market Commentary: Asset Returns 4-12-26
CPI March 2026: The CPI Cycle Could Prove Maddening 4-12-26
4Q25 GDP: More Adverse Revisions in the Golden Year 4-9-26
The US as an Aspiring Emerging Market: Fiscal SNAFU, Political FUBAR 4-6-26
Employment Situation March 2026 4-4-26
Payroll Focus: ADP Highlights March 2026 4-1-26
JOLTS Feb 2026: Openings Down, Hires Down, Layoffs Up 3-31-26
Market Commentary: Asset Returns 3-30-26
UST Deltas: Elevation Realities 3-29-26
Market Commentary: Asset Returns 3-23-26
Market Lookback: Confusion Reigns, Dislocation Pours 3-22-26
New Homes Sales Jan 2026: The Nays Carry 3-19-26
Market Lookback: The Gulf of Cause and Effect 3-15-26
Housing Starts Jan 2026: Total Starts Up, Completions Up, Permits Down 3-12-26