
Market Commentary: Asset Returns 4-12-26
The word “volatility” in US-Iran risk seems more like “binary risk” lately as Islamabad failed and a US naval blockade is threatened.


It is only a small naval blockade…
The world just got a lot crazier with the failure of the Islamabad negotiations as Trump threatened a naval blockade of all traffic. That might not last the day once someone explains to him that is a de facto declaration of economic war on China, who can retaliate on a small scale (strategic metals, etc.) or large scale (Taiwan). Absolute control over the Taiwan economy would make the US captive overnight in semiconductors and electronics (see US-Taiwan Trade: Risks Behind the Curtain 2-1-26).
The latest round of asset return updates includes bullish views on the US-Iran war ceasefire working out, in turn leading oil to plunge with the Strait of Hormuz settled. If that was the case, the probabilities of supplier chain disruptions would be easier to handicap. The weekend just changed all that with Islamabad failing and now Trump threatening the counterintuitive action of reducing supply disruptions by dramatically increasing supply disruption.
In the meantime, trade issues are back in the headline with Trump threatening fertilizer producers on price gouging after his actions already sent fertilizer supplies into Gulf-based dislocations. The upcoming USMCA review includes Canada as one of the largest suppliers of fertilizer.
Under “bad allies for a thousand, Alex,” the active campaigning actions of Trump and Vance in favor of Orban might have flowed into US-EU relations (including trade) if Jan 6 style issues unfolded. However, as we go to print, we see that Orban has conceded defeat. Trump’s active support of Orban and the AfD in Germany already signal the authoritarian and pro-Russian flavor of Trump’s support. It seems more obvious across time that Trump desires to see the EU break up. Orban does not go into Trump’s win column.
The UST curve handicapping could go back into paroxysms following the Islamabad failure and the new threat of a full naval blockade. The world can hope for a TACO move there but it is uncertain. Behavioral odds-making is a very inexact science.
This week starts the financial sector earnings wave, and we will also get the PPI release on the heels of the commodity and materials cost pressures of March. Existing home sales will signal how the mortgage rate pressures of March weighed on volumes, and we get a fresh read on Industrial Production.
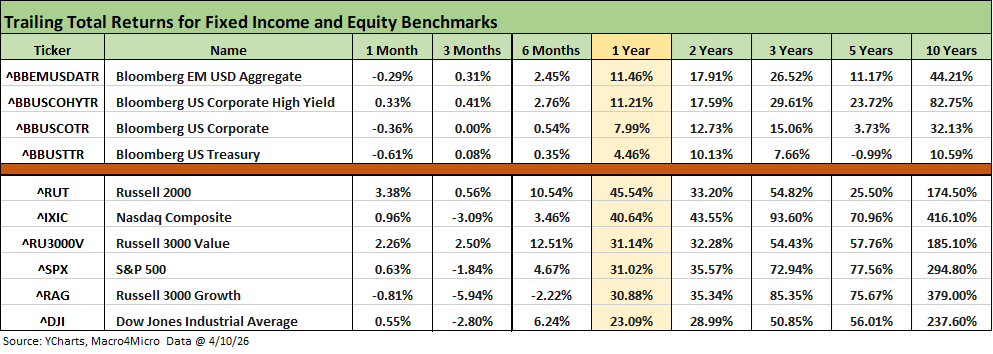
Even after a banner week in equities and some easing of UST curve pressures on bonds as detailed below, the trailing 1-month returns are a mixed bag with 3 of 4 bond benchmarks posting negative returns. Only US HY posted positive returns with a minimal +0.33%.
Equities have had tech challenges on multiple fronts with the fixation on AI threats to software worsened by the UST and inflation anxiety as discussed in commentaries along the way and broken out in the “Tech Check” charts further below. Looking back 3 months, we see NASDAQ and Russell 3000 Growth in the negative return range. The S&P 500 and the Dow were both in the red for 3 months.
Small caps have been the big winner looking back over 1 year and beat the NASDAQ and S&P 500. Small caps and Value stocks were the leaders over 6 months as the sector-rotation themes were playing out for value vs. growth and tech.
The rolling return visual
In the next section, we get into the details of the 32 ETFs and benchmarks for a mix of trailing periods. Below we offer a condensed 4-chart view for an easy visual on how the mix of positive vs. negative returns shape up. We see it as a useful exercise in looking for signals across industry groups and asset classes.
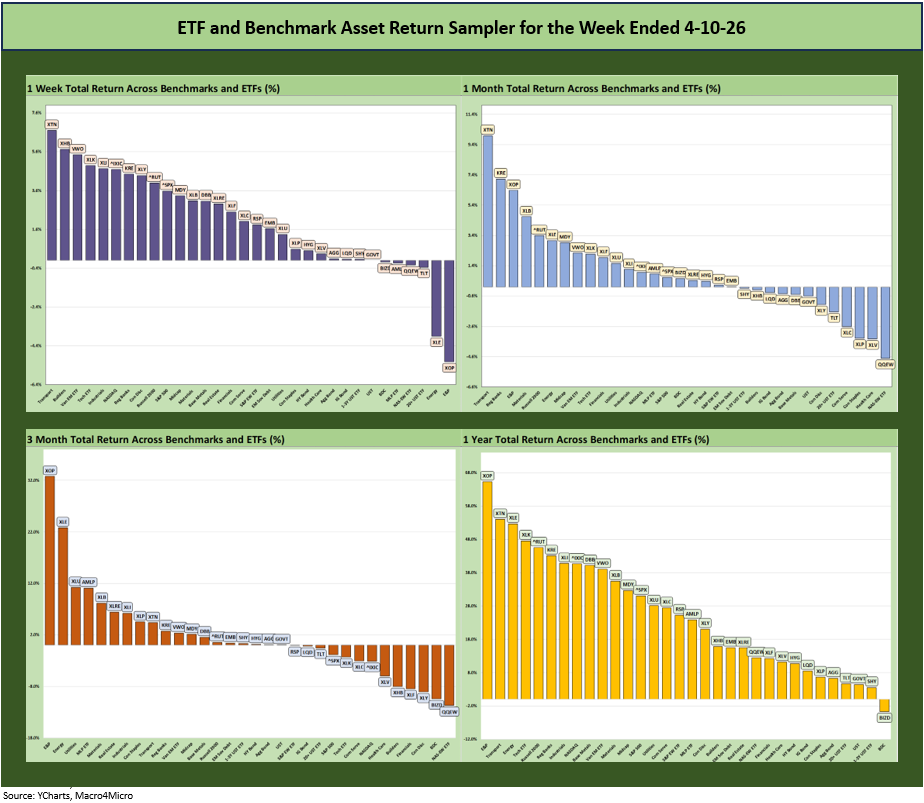
The 1-week and 1-month symmetry flipped back to positive with the ceasefire and hopes for a deal. That initial attempt at a deal just failed this weekend with the handicapping game a fresh new challenge for the markets. The 3-month symmetry is slightly positive at 19-13 while the 1 year timeline is still riding the rally at 31-1 with only the BDC ETF (BIZD) in the red.
The Magnificent 7 heavy ETFs…
Some of the benchmarks and industry ETFs we include have issuer concentration elements that leave them wagged by a few names. When looking across some of the bellwether industry and subsector ETFs in the rankings, it is good to keep in mind which narrow ETFs (vs. broad market benchmarks) get wagged more by the “Magnificent 7” including Consumer Discretionary (XLY) with Amazon and Tesla, Tech (XLK) with Microsoft, Apple, and NVIDIA, and Communications Services (XLC) with Alphabet and Meta.
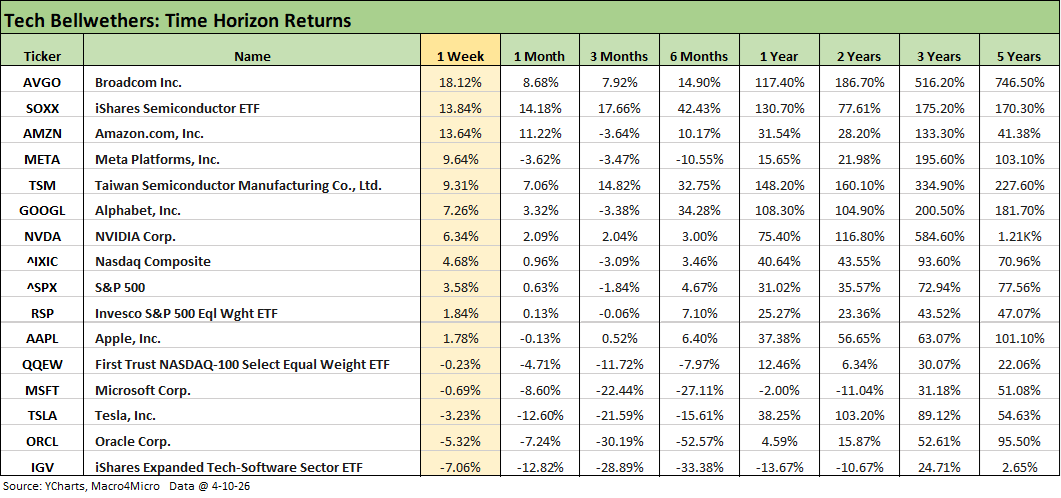
The tech bellwethers were mixed for the week but with some key names having a very strong week as detailed further below in the “Tech Check” breakouts. The temporary relief on the US-Iran ceasefire will give way to turmoil in the markets later tonight and tomorrow as the global markets cast their votes not only on the failure to strike a deal in Islamabad but also on the threat of a full naval blockade that will make the supply shock that much worse.
For the week, software was again in the tank with the Software ETF (IGV) in last place at -7.06% for 1 week, -28.9% over 3 months, and -33.4% over 6 months. In contrast, the Semiconductor ETF (SOXX) was +13.8% for the week and +42.4% for 6 months. The stock picking challenge in the tech sector across 4Q25 and into 2026 is a major differentiator.
The setbacks since Friday have a very wide range of potential outcomes. If they can’t get back on track, the regions that will see the worst damage will be Asia and the EU given the consumption of Gulf product flows. Some US players can ride the global supply stress and pricing/cost impacts to their benefit as we have already seen (energy, petrochemicals, aluminum, fertilizer). Notable rallies were seen with Valero, CF Industries, Lyondell, and Alcoa.
The very detailed commentaries hitting the headlines in recent weeks around supplier chains (helium, fertilizer, aluminum, etc.) even beyond the oil-to-refined-products chain will get revisited on the customer fallout.
We assume someone will explain (very slowly) to Trump that a naval blockade will be worse by an order of magnitude than the current extortion by Iran. No supplies vs overpriced supplies could bring more production chains to a halt rather than just inflate the expenses in some cases.
The UST forecasts and inflation anxiety will go into a fresh round of handicapping while the FOMC will have an even worse set of circumstances to ponder later this month if we see any combination of boots on the ground or a full naval blockade. The full blockade plan and going after those that pay the fee to pass will be quickly adjusted since it is so self-destructive and damaging to global economies. It appears unworkable (boarding parties? Then what?). The explanation might have to come from a non-cabinet billionaire. The White House sycophants might not dare.
The commentary below is mostly a cut-and-paste from an earlier post on LinkedIn on Saturday with some additional input:
The chart updates the weekly total returns on the 32 benchmarks and ETFs we track. The Iran War has dulled the senses a bit through Friday with the end game getting worked on in Islamabad. With the complexity of the Israel-Lebanon War and its overlap with the US-Israel tag team on Iran, sorting out the pieces is no small challenge. As we know now, the Islamabad deal failed.
The complications are exacerbated by the fact that Team Trump and Iran have starkly different versions of what was agreed to the first time. The market last week was betting on a solution with a very strong week in equities.
With headlines flagging the “best week of the year in equities,” the NASDAQ came roaring back with all 4 major benchmarks (including Russell 2000, Midcaps and S&P 500) posting solid rallies. The market saw 10 of 11 S&P 500 sectors positive with only Energy negative. We saw 5% handles on the week for Communications Services and Tech in the S&P 500 sector mix with 4% handles on Real Estate, Industrials, and Consumer Discretionary. The Russell 2000 and Midcaps are still beating the large caps YTD.
Last week’s equity market performance was a bounce with breadth in a week when Trump started off with profane Easter rantings as he had threatened to annihilate a civilization and discussed moving on to the “next conquest.” The week saw Trump state that a “whole civilization will die tonight” if conditions were not met.
Such language – along with the hyped “Donroe Doctrine”– is not exactly a deterrent to China (Taiwan) or Russia (Ukraine, Baltics). In fact, it encourages a global carve-up. The potential domino effects of continuing down this path could pull in aggressive responses from China while Russia cashes in.
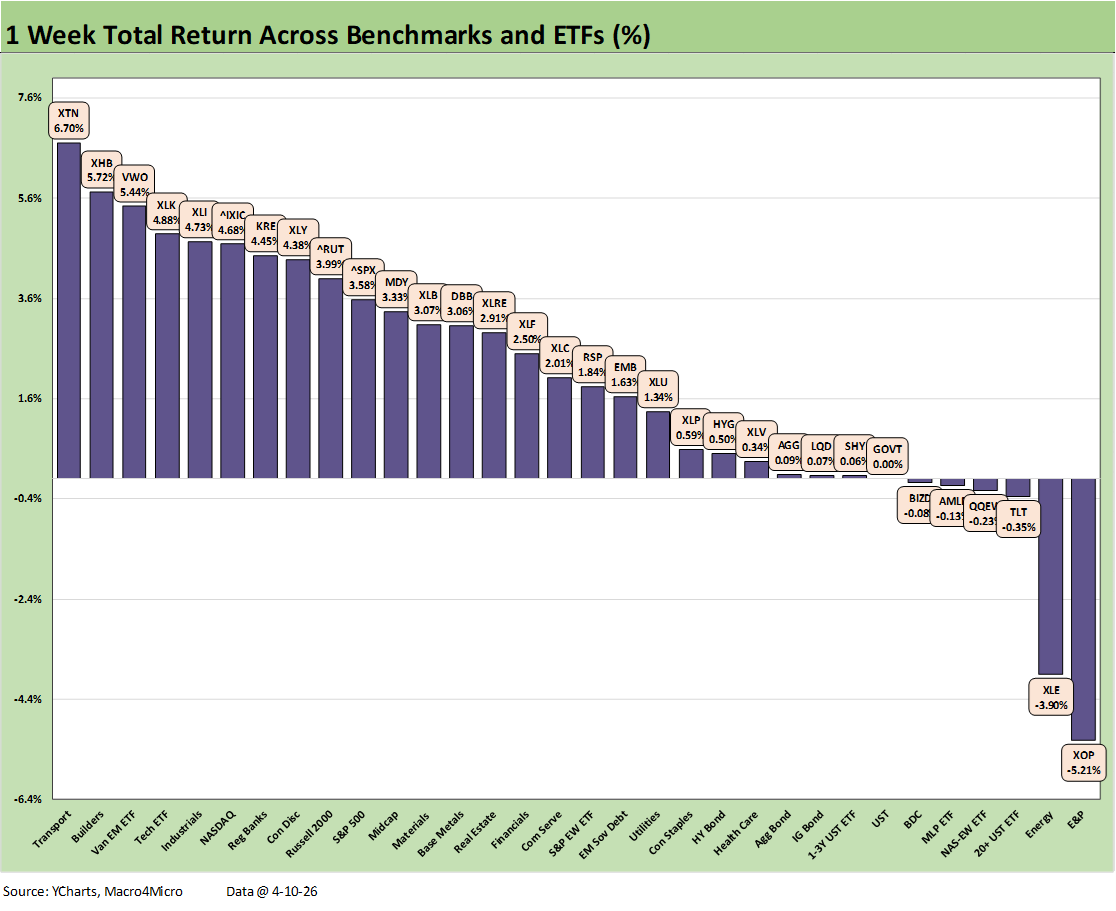
The scoresheet above is clear enough on what a solid performance the week saw in equities with a positive to negative score of 26-6. The 6 in negative return range include the 3 energy ETFs across the E&P ETF (XOP), the diversified Energy ETF (XLE), and Midstream ETF (AMLP). Those 3 are joined in the red by the BDC ETF (BIZD), the Equal Weight NASDAQ 100 (QQEW), and the long duration UST ETF (TLT) with a very slight negative.
The winners for the week cut across cyclically diverse subsectors including Transports (XTN), Homebuilders (XHB), EM Equities (VWO), Tech (XLK), Industrials (XLI), Regional Banks (KRE), and Consumer Discretionary (XLY). That breadth of rallies in the top quartile underscores how wide the damage from the Iran War was expected to be from inflation to FOMC policy to the consumer sector and the broader macro cycle. This coming week could see a quick reversal if damage control does not start right away.
Mortgage rates have declined from recent highs, and the FOMC easing odds have risen again off the recent plunge. The risk of tightening shifted lower as we covered in our separate CPI commentary (see CPI March 2026: The CPI Cycle Could Prove Maddening 4-12-26 ). Asset quality concerns remain a factor (private credit, pressure on consumer metrics). Those odds will once again get jumbled and gyrate again this week with the latest news.
The commentary below is mostly a cut-and-paste from an earlier post on LinkedIn on Saturday with some additional inputs:
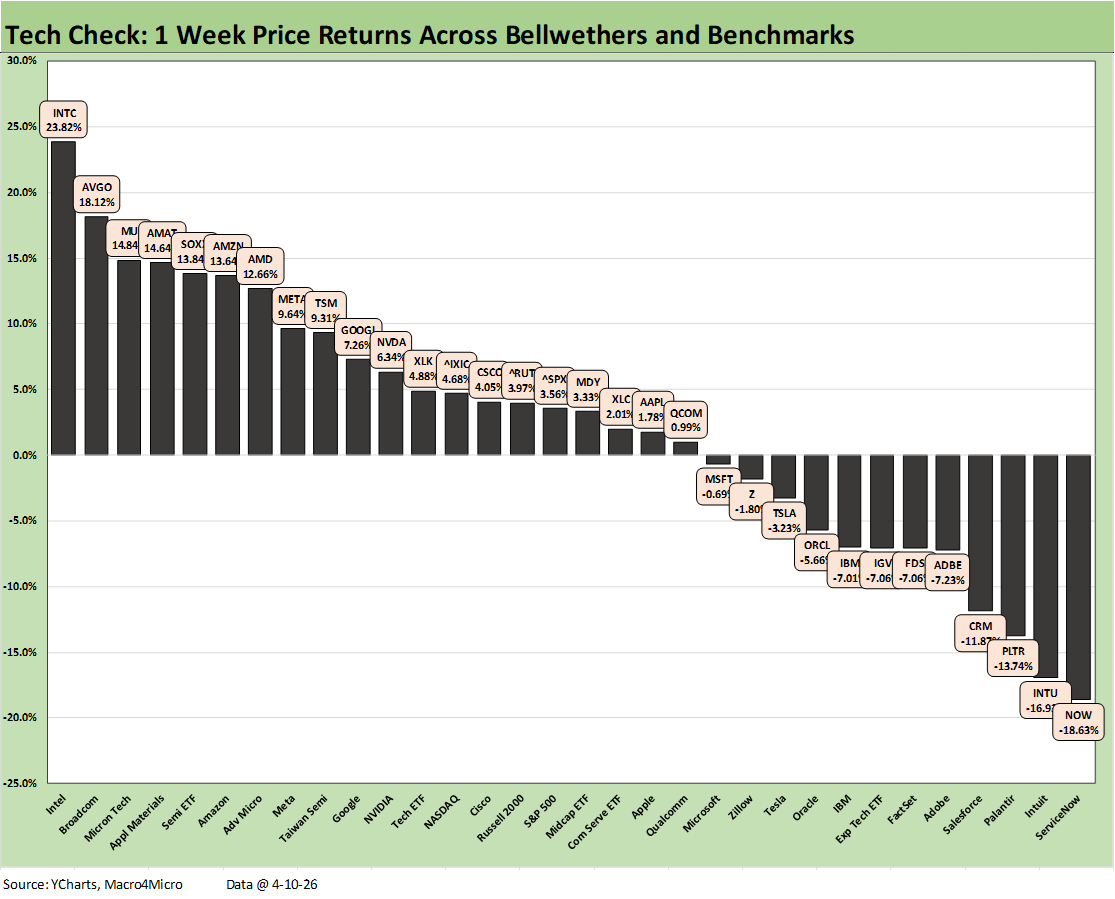
The above chart frames price returns for the 32 benchmarks and tech-centric ETFs we track each week. At a 20-12 positive vs. negative score, there are more winners and losers on the week, but we see some very big moves for the winners in the top tier and material weakness for those among the bottom tier performers. The Hi-Lo range of returns was over 42 return points. That includes +23.8% for INTC at #1 and -18.6% for NOW at #32.
We see a big rally in the semiconductor-related names with two Mag 7 names in the top quartile (AMZN, META) and 2 Mag 7 names in the upper end of the 2nd quartile (Alphabet, NVIDIA). The Semiconductor ETF (SOXX) made the top 5. We see AAPL, MSFT and TSLA in the third quartile with MSFT and TSLA in the red. The Mag 7 score was 5-2 while the “Mag 7+3” was 7 positive and 3 negatives. Broadcom was a strong #2 at +18.1% behind Intel at #1 and Micron at #3 with a +14.8% return.
The SaaS-centric services names took a fresh beating this week with ServiceNow (NOW) sitting on the bottom at -18.6%. Joining NOW in double-digit negative range again is Intuit (INTU), Palantir (PLTR), and Salesforce (CRM). FactSet (FDS) in the bottom quartile and Zillow (Z) were again in the red. The software names again underperformed with the Software ETF (IGV) and Adobe (ADBE) in negative return range in the bottom quartile.
From discount rates in “long duration” tech equity valuation to cyclical and consumer sector worries, the Iran War risks directly impact the tech sector. The AI panic around software and related private credit noise was bad enough without the Iran War scenario spinning.
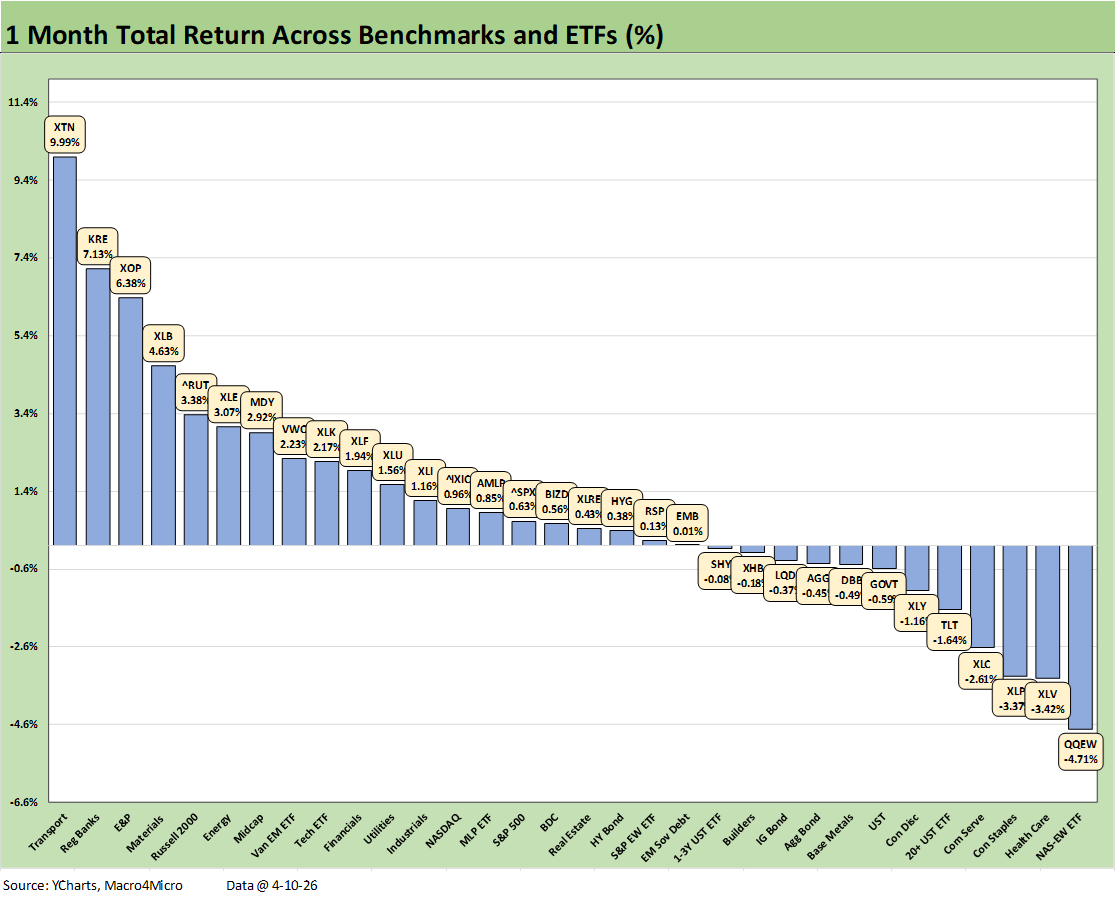
The 1-month score for the 32 benchmarks and ETFs was 20-12 as of Friday close. We see 5 of the 7 bond ETFs in negative zone on the UST curve spillover with HY bonds (HYG) and EM Sovereigns (EMB) slightly positive. The long duration 20+ UST ETF (TLT) is in negative range in the bottom quartile joined by the UST ETF (GOVT).
The top quartile was cyclically diverse but shows no tech. The top quartile included energy (XOP, XLE) but Transports (XTN) came out on top despite the airline damage from fuel. Regional Banks (KRE), the chemicals-heavy Materials ETF (XLB), and small caps (RUT) and Midcaps (MDY) were in the top tier.
The Tech Check group was a tie at 16 positive and 16 negative returns. We see a good story for semiconductors and ugliness for software and SaaS-based services operators. We have covered the tech noise and subsector setbacks in prior weekly comments and in the weekly returns above. The fear of AI giants causing “business model extinction” for SaaS-centric services operators has been impossible to fully offset so far.
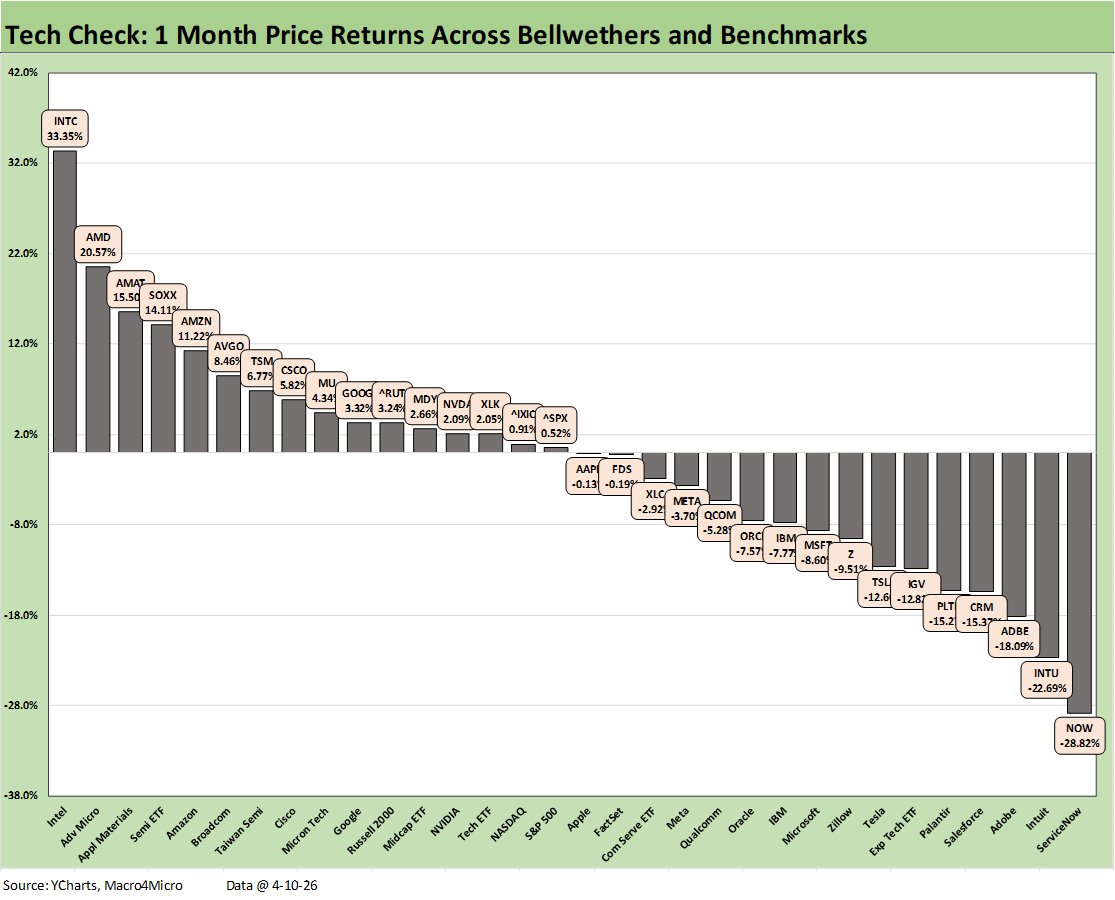
For the 1-month period, we see a Hi-Lo range over 62 points in the returns of #1 Intel (INTC) at 33.4% vs. #32 ServiceNow (NOW) at -28.8%. In the bottom quartile as noted, only Zillow avoided double-digit negative returns at -9.5%.
We see 4 of the Mag 7 in the red for the month with Amazon alone of the 7 in the top quartile with Alphabet and NVIDIA in the 2nd quartile.
The top quartile for the month was heavy on semis with Intel (INTC) at #1out in front followed by Advanced Micro (AMD) at #2, capex-sensitive Applied Materials at #3, and the Semiconductor ETF (SOXX) at #4. In contrast, the Software ETF (IGV) was down in the bottom quartile at -12.8%. Software has taken a beating from AI fears and private credit panic headlines.
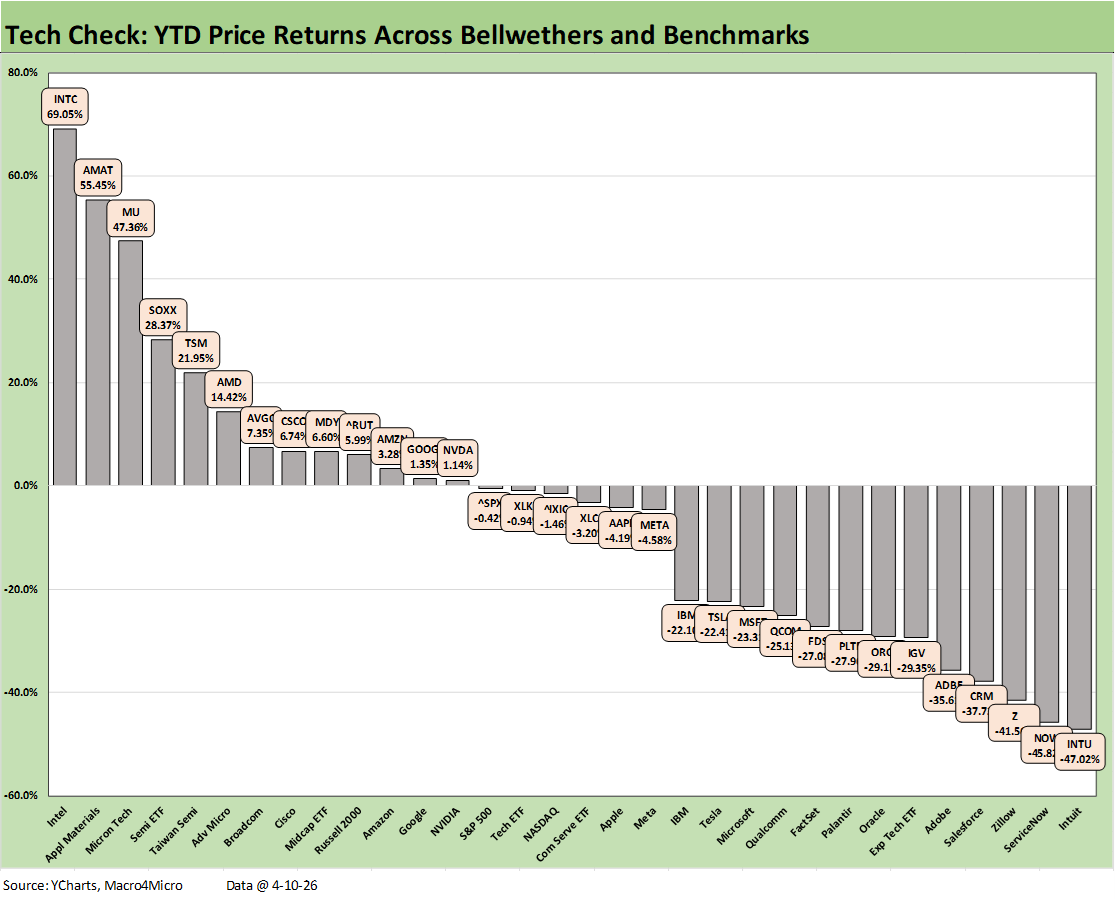
The YTD “Tech Check” score posted 13-19 positive vs. negative but with some dazzling winners (Intel, Applied Materials, Micron) and beastly losers (Intuit, ServiceNow, Zillow, Salesforce, Adobe).
The main theme is “semis vs. software” with semis winning and a range of software and SaaS-based names taking a beating. The Semiconductor ETF (SOXX) posted +28.4% and ranked #4 while the Software ETF (IGV) posted a grim -29.4%. We see 13 lines well into double-digit negative returns with the 13th worst (IBM) posting -22.1%.
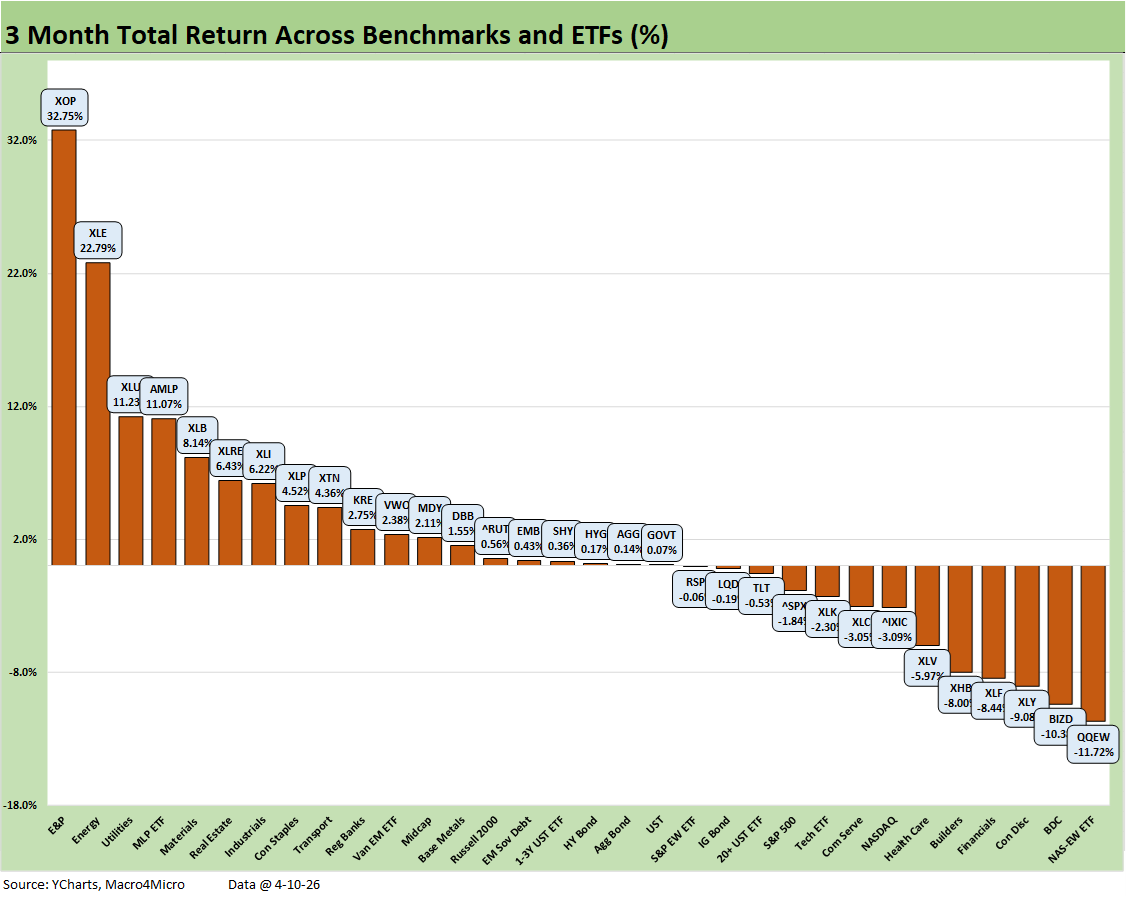
The above chart shifts back to our usual group of 32 benchmarks and ETFs for 3 months. The score of 19-13 shows no tech name in the top quartile with its 3 energy related ETFs (XOP, XLE, AMLP) joined by Utilities (XLU) and Materials (XLB) in the top 5. Real Estate (XLRE), Industrials (XLI) and Consumer Staples (XLP) round out the top quartile. That mix highlights the rotation trade that was unfolding in 2026 and some of the related fears that gripped software and SaaS services.
Sitting in the bottom tier we see the Equal Weight NASDAQ 100 (QQEW) in dead last with the BDC ETF (BIZD) one off the bottom. Financials (XLF) have been taking heat on the private credit noise and the concerns around the FOMC easing probabilities.
Homebuilders (XHB) felt a combination of cyclical pressure in housing but also the mortgage rate creep that came with the Iran War scenarios. Obviously that UST curve and steepening/shifting risk will come back into the dialogue with the ceasefire setbacks and Trump’s threats of a naval blockade. He already seems to be backpedaling as media flows, but that has to play out.
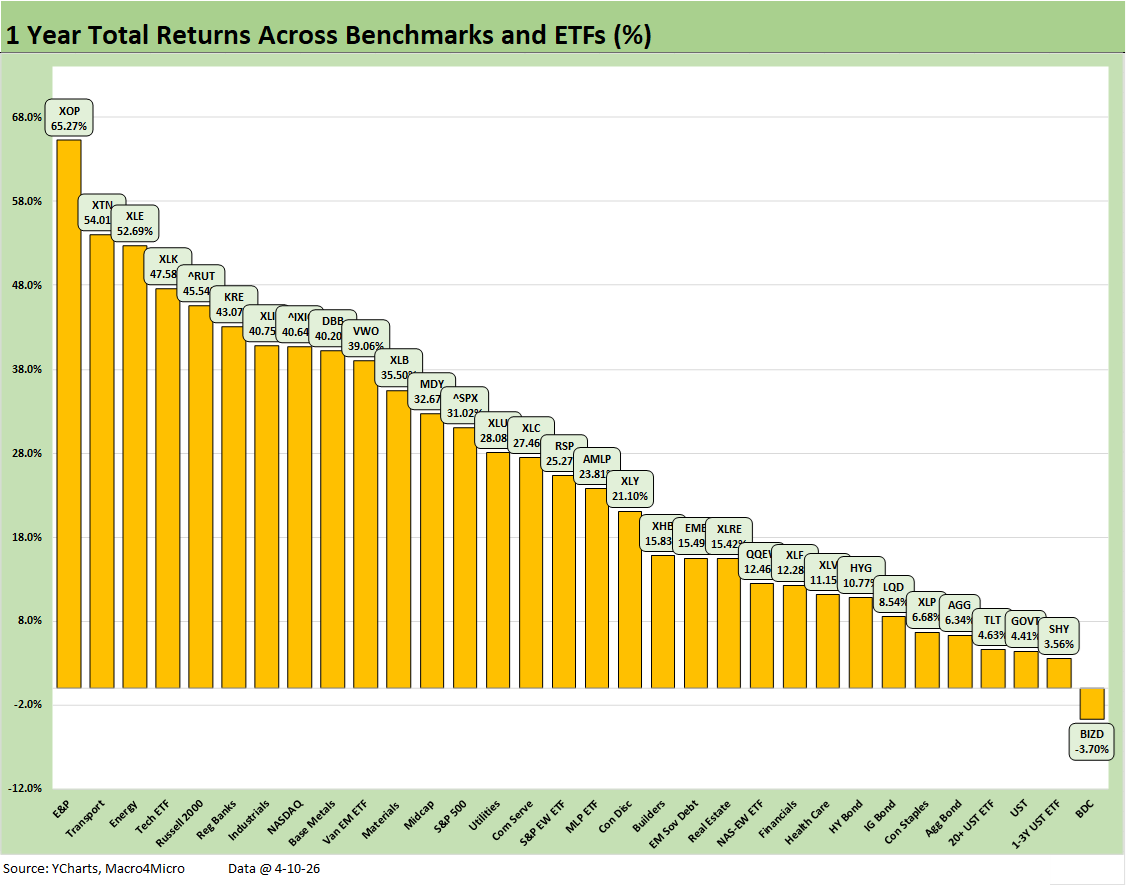
The 31-1 score looking back a year posts a median line-item return of over 24%. That median and range still makes for a very good rolling 1 year despite the weak start to 2026. The BDC ETF (BIZD) is down to -3.7% with 6 of the 7 bond ETFs sitting in the bottom quartile and only EM Sovereigns among bonds breaking into the 3rd quartile.
We see energy at #1 (XOP) and #3 (XLE) with Transports (XTN) at #2 and the Tech ETF (XLK) and Russell 2000 rounding out the top 5. It took 40.6% to make the top quartile, so that is a banner LTM run rate for equities.
See also:
CPI March 2026: The CPI Cycle Could Prove Maddening 4-12-26
4Q25 GDP: More Adverse Revisions in the Golden Year 4-9-26
The US as an Aspiring Emerging Market: Fiscal SNAFU, Political FUBAR 4-6-26
Employment Situation March 2026 4-4-26
Payroll Focus: ADP Highlights March 2026 4-1-26
JOLTS Feb 2026: Openings Down, Hires Down, Layoffs Up 3-31-26
Market Commentary: Asset Returns 3-30-26
UST Deltas: Elevation Realities 3-29-26
Market Commentary: Asset Returns 3-23-26
Market Lookback: Confusion Reigns, Dislocation Pours 3-22-26
New Homes Sales Jan 2026: The Nays Carry 3-19-26
Producer Price Index Feb 2026: Getting Warmer 3-18-26
Industrial Production Feb 2026: Capacity Utilization 3-16-26
Market Lookback: The Gulf of Cause and Effect 3-15-26
Housing Starts Jan 2026: Total Starts Up, Completions Up, Permits Down 3-12-26
Existing Home Sales Feb 2026 3-10-26
VIX: Market Still Not Getting the Vapors 3-6-26