
Savings Rates: Context Across the Cycles
We look at the savings rates across the cycles as we get down to the 3% range.


We give some context to what savings rates have looked like across the decades, the market highs and lows, the bubbles, the crises, and the cyclical turns.
The sharp decline in the savings rate detailed in the Sept 2023 PCE report is getting closer to the wacky days of the housing bubble years when 1% and 2% handles were seen too often around the peak of a very exuberant time for households.
The theories around post-pandemic savings depletion are often heard, and the rising costs of consumer credit generate plenty of disagreement on when the music will stop when employment and wages are still running along well enough.
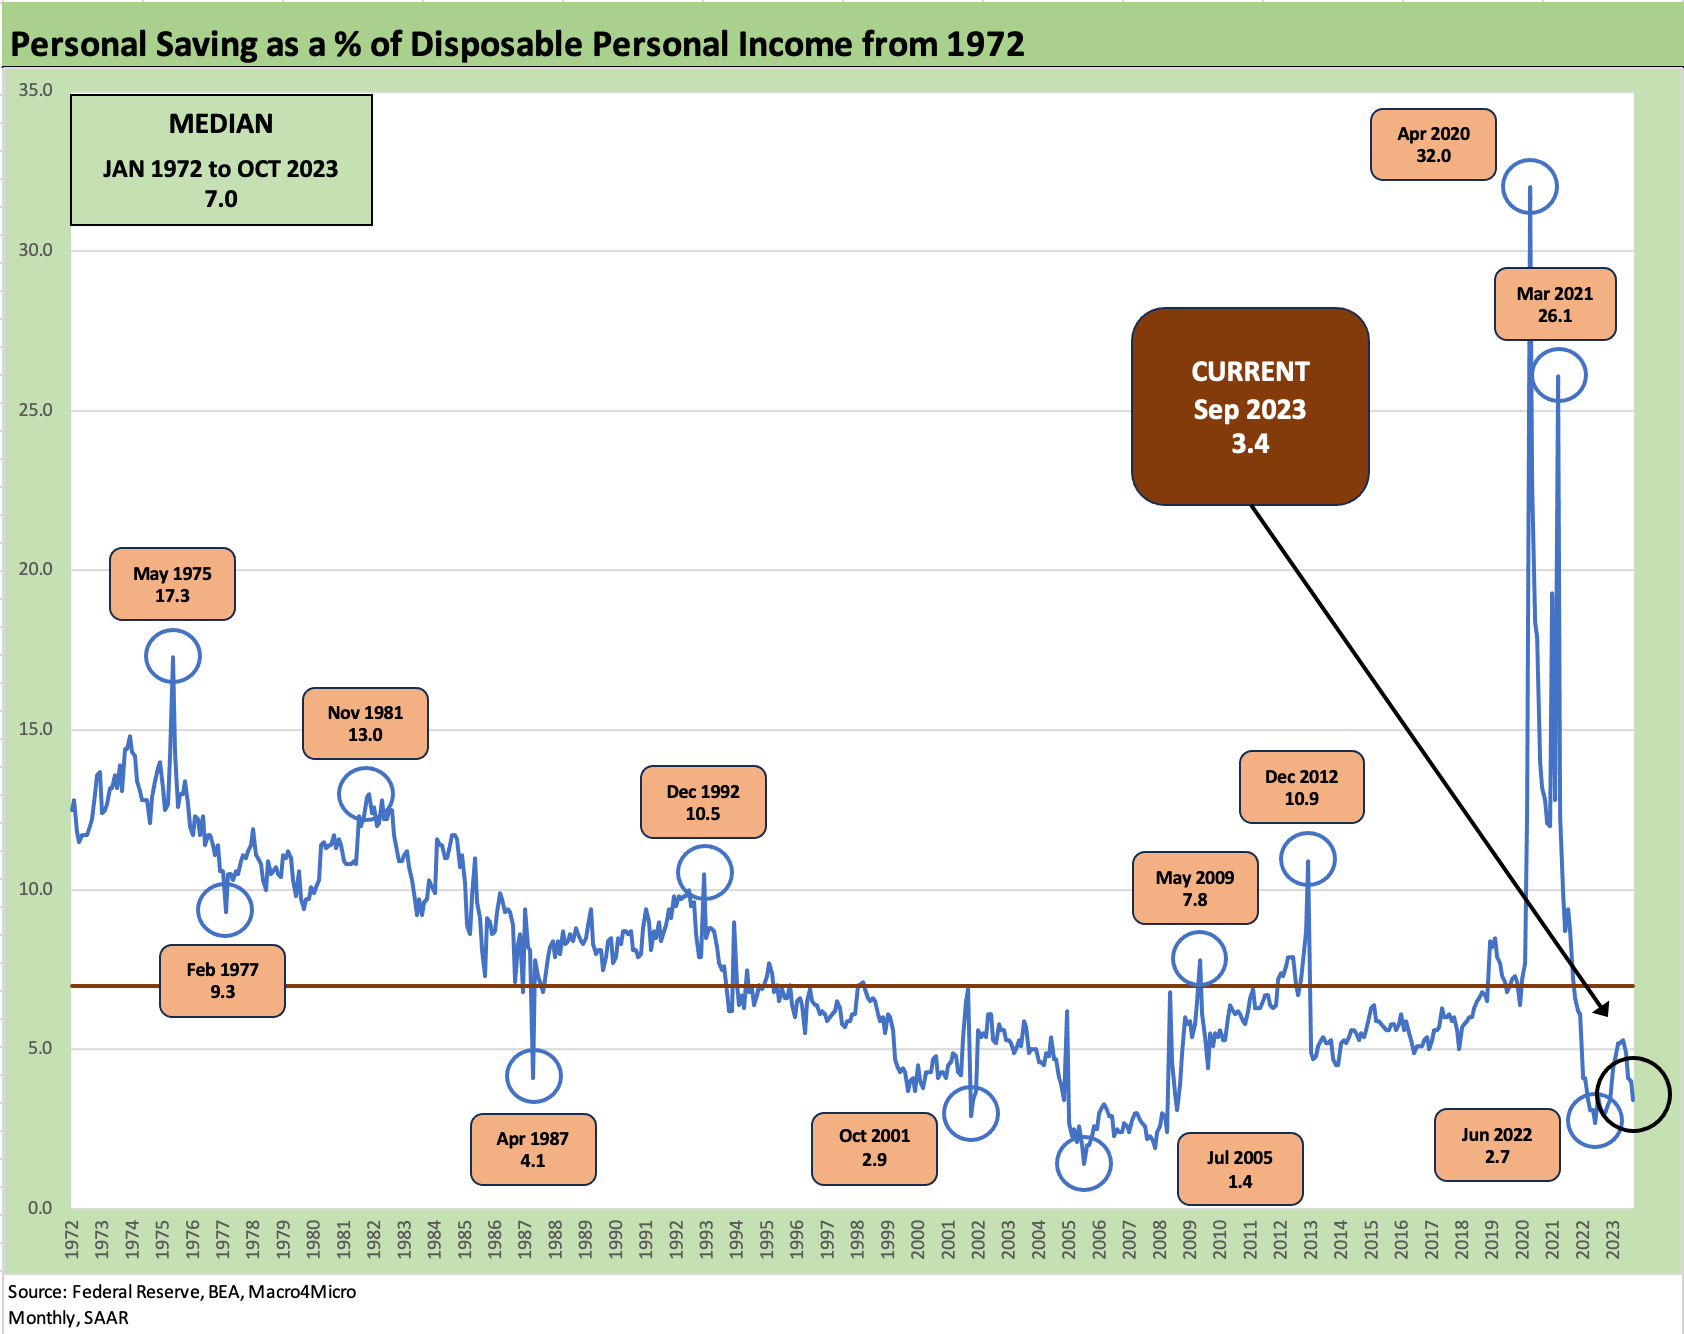
In this commentary, we present the historical context for the monthly personal savings rate data included in the Personal Income and Outlays release. The definition is “Personal Savings as a % of Disposable Personal Income” (Table 1, line 44). We plot the long-term timelines above with its distortion during the COVID crisis. Today’s release rang the bell with a decline to 3.4%. That is a savings rate that is creeping back into some of the frothier timelines of past cycles of excess such as the 2004-2007 time zone.
The timeline above includes the full scale of the COVID spike in savings rates. Whether that was a function of fear or simply closed stores and nowhere to shop, the reasons varied. The risk aversion tied to waves of unemployment/furloughs was a big part of the problem. In other words, spending was “not a thing” for a while. Vacations were off the table (as were many flights and grounded aircraft), and goods producers were often shut down. That changed with stimulus packages and vaccines.
Those earlier periods of 2005-2006 when 2% savings rates were common (2005 had 11 months of 2% handle savings rates and a single 1% month at the cyclical low) were the days of 125% LTVs on mortgages when borrowers were mainlining credit risk and lenders right alongside them. We are not in a period like that now, but the consumer is spending in a manner that has some hints of resemblance.
Depletion vs. leverage excess…
The declining savings rate is less the topic of discussion than the depleting cash hoard or the willingness of the consumer to keep on spending rather than saving or to keep on borrowing to keep up the current household basket (or more).
The next question could be around how tardy those payments on debt service might prove to be and whether the cumulative effects of consumer debt will translate into problems in financial asset quality for lenders or funding structures.
The consumer is well into recovery mode in this cycle with record high payrolls and spending habits in search of normal equilibrium that the market is also struggling to get its arms around. Companies are struggling as much as economists in trying to frame trailing metrics that they can use in a forward plan.
Pent-up demand in autos and supplier chains were good for light vehicle volumes in 2023 while the “summer of travel” leaves airlines struggling to frame capacity planning for next year. That flows into revenue management systems that are based on history with capacity needs for next year’s seasonal travel hard to gauge.
The bubble years of 2004 to 2007 and into the crisis…
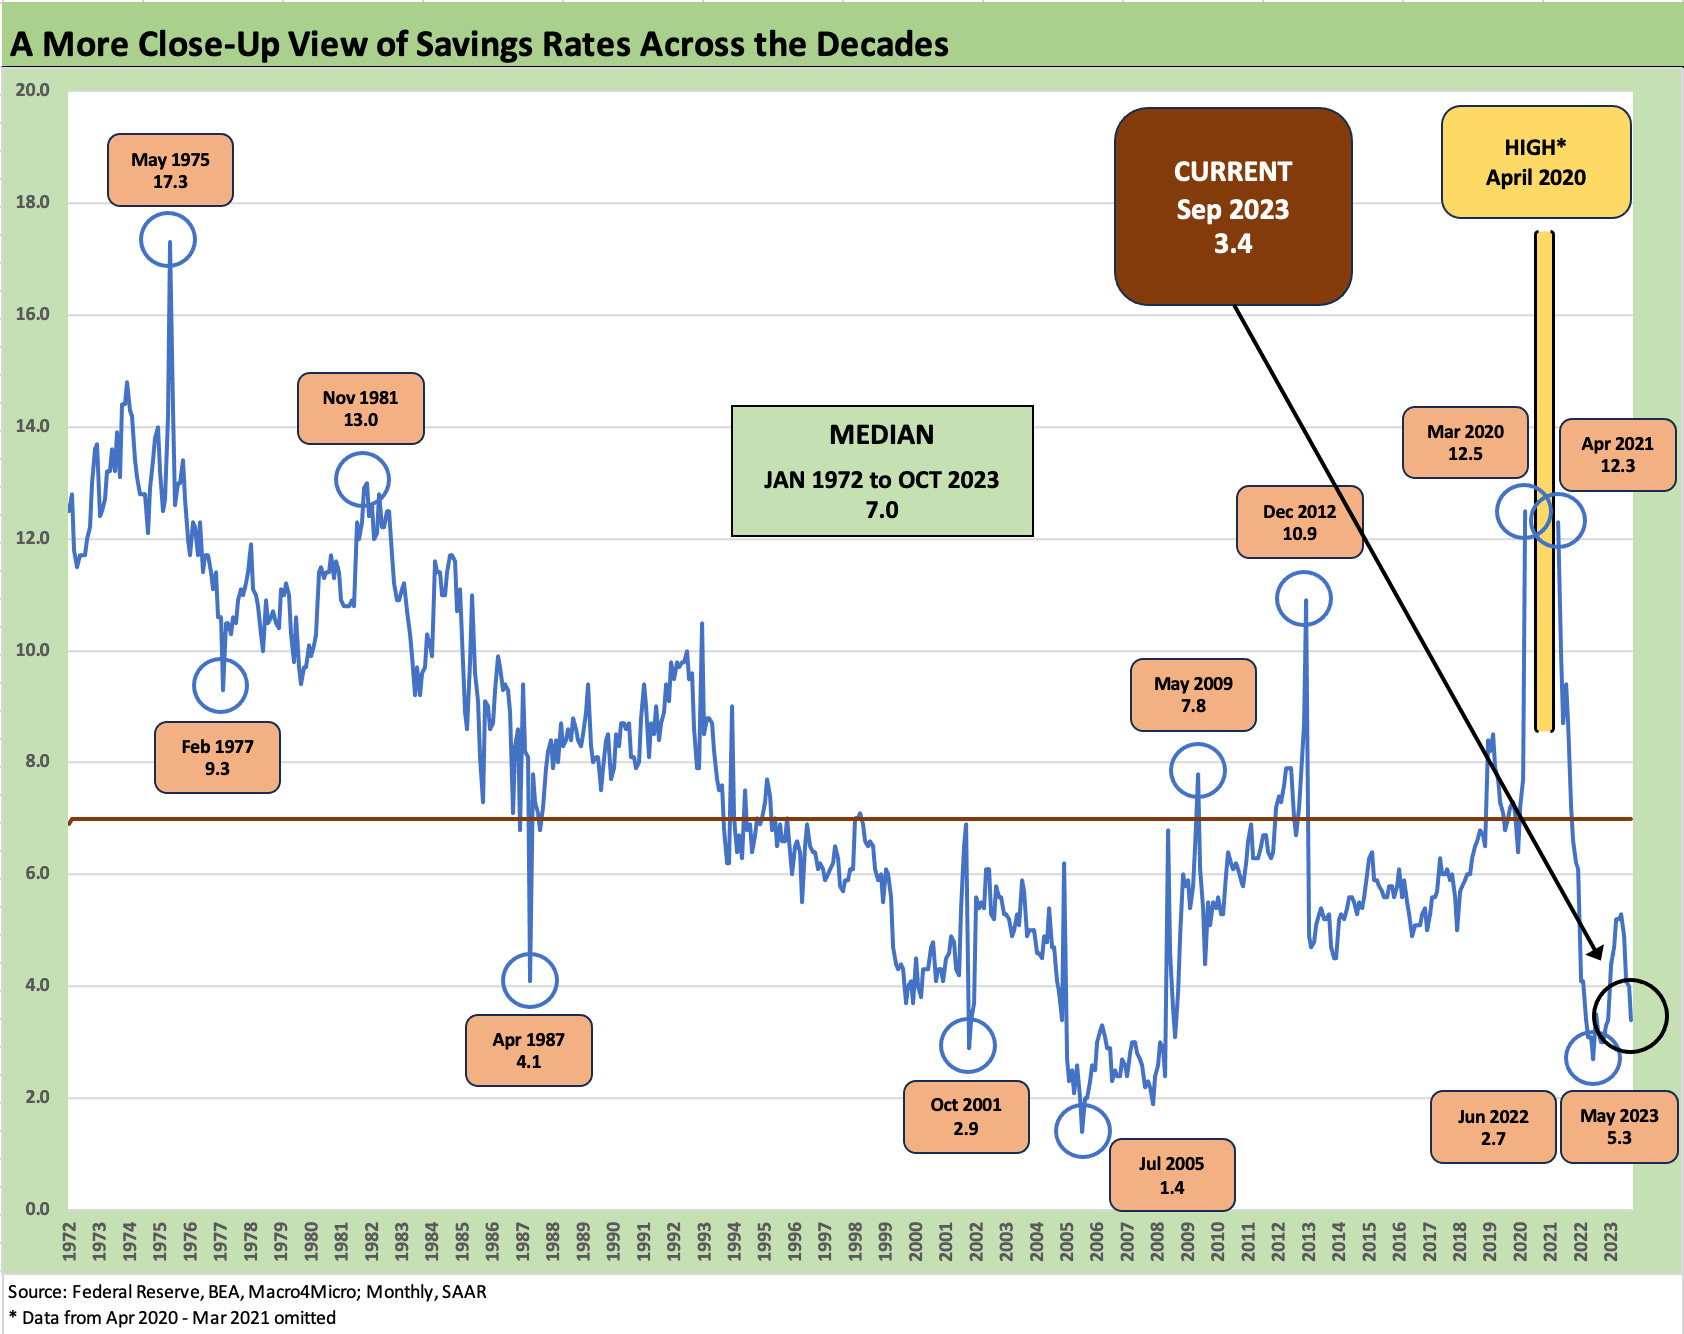
The second chart of this collection above improves the scale for visual review by trimming the COVID savings spike and zeroing in more on the other peaks and valleys. As we look back across time, the highs and lows are clear enough across the cycles and wild times we discuss throughout our various commentaries (see Inflation: Events ‘R’ Us Timeline 10-6-22).
The pain of 1975, 1981, 1992, 2009 and the housing swoon which lasted into 2012 do not need much highlighting. On the low saving rate side, we see some massive auto incentives program periods (Oct 2001, July 2005).
Patterns of excess spending and belt-tightening are very much in evidence across the cycles with the 2004 to 2008 timeline serving as one for the ages in terms of excess. We saw 1% and 2% handles in 2005-2006 after being heavier on 4% handles in 2004. We saw mostly 2% and 3% handles in 2006-2007. Volatility was showing up in 2008 with a few months as high as 6% range but still some 2% earlier in the year. 2009 saw the 5% range ruling with a move to 6% and 7% around the trough.
After that housing bubble and sector downturn was fully realized, the more logical and rational savings rates prevailed again for a while. We are now heading back to a zone that is “not sustainable” (a phrase that keeps popping up on the screen and in a lot of research).
A big difference now vs. 2005-2006 is the sheer scale of asset bubble risk then. The current market is not like the housing insanity of 2005-2006 when people were borrowing against inflated theoretical home equity (including on HELOCs and credit cards) that were very much out of touch with reality. Reality then set in by 2009.
Our takeaway from the balance of factors that live behind the recent macro data and the 3.4% savings rate is that the consumer spending growth can slow, but there is not a sense that the consumer will be in major asset quality straits or material retrenchment unless jobs deteriorate violently near term. That falls under the heading of “No sh@t Sherlock” unless we add that we do not see that as a major risk ahead on the balance of macro factors.
The hard landing themes always lurk, but we don’t see it emanating from manufacturing, health care (around 18%-19% of GDP), the construction markets, aerospace/defense, or energy. Over in financial services, there will continue to be a case of nerves around regional banks as long as asset quality has a cloud over it and the deposit run is a recent memory.