
New Home Sales March 2024: Seasonal Tides Favorable
With the #3 and #4 homebuilders (PHM, NVR) reporting strong numbers today after the #1 builder (DHI) did last week, we see more solid total numbers from the Census.


Builders are busy…
With the latest round of homebuilder earnings reports underway, the favorable trend line continues with the Census also reporting new residential sales at +8.8% sequentially and +8.3% YoY with median home prices at $430.7K, the highest since Aug 2023.
The homebuilders offer the benefit of rolling fiscal years for near constant updates on “actual” activity on the ground, and today saw Pulte at +11% in closings for 1Q24 and NVR at +10% in “settlements” following D.R. Horton’s +15% YoY closings last week.
The biggest YoY gains reported by the Census were in the West (+18.8%) and Midwest (+23.4%), but the critical South region as by far the largest market sustained sequential (+7.7%) and YoY (+4.5%) growth as well.
“Homes for sale” are at an LTM high in total and across “completed,” “under construction,” and “not started,” so the builders are expecting sustained strong demand in the peak spring and summer season even if they have to react with more incentives in the event mortgage rates do not cooperate after the Freddie Mac 30Y benchmark crossed the 7.0% line last week for the first time in 2024.

The above chart updates the long-term running time series for new single family home sales. The latest print of 693K SAAR for March 2024 is the highest since Sept 2023. The March level is still above the long-term median of 630K as detailed in the chart. March 2024 is just above the 1980s/1990s cyclical boom periods and well above the post-crisis median. The post-2001 housing sector bubble period through the June 2009 trough is the only median higher – and materially so – at 989K for the wildest housing cycle captured in the chart.
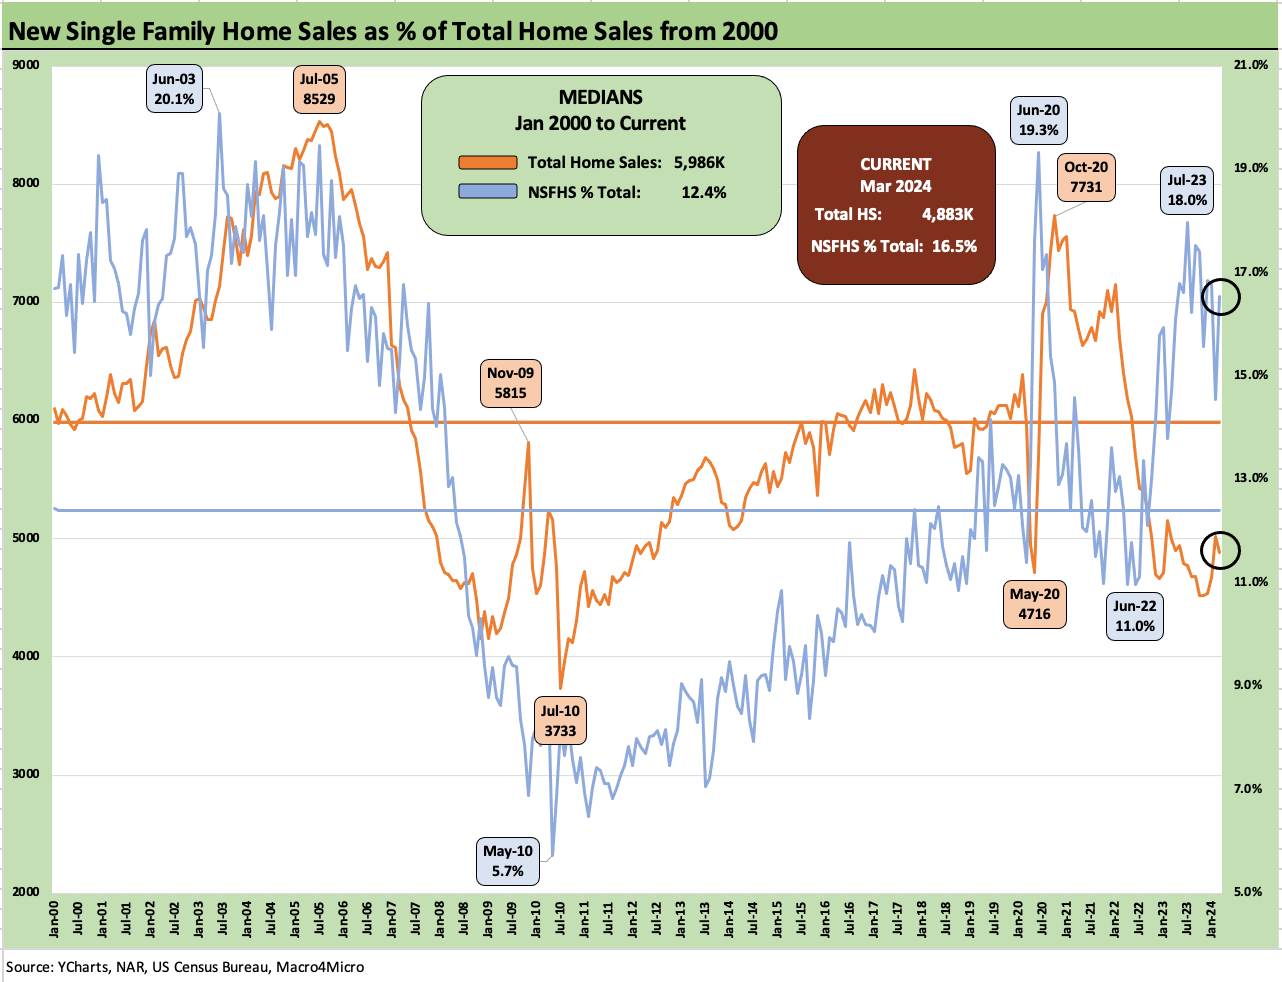
The above chart updates the running share of “total home sales” (new + existing) captured by new homes in this cycle. The long-term share held by the homebuilders is 12.4% vs. the current level of 16.5%. The increase underscores how the mortgage rate shock since 2022 and golden handcuff effects on existing home sales has impacted inventory levels in a way that allows homebuilders and their creative use of incentives to capture a higher share of the incremental homebuyer.
We have discussed this topic at length in prior commentaries. The ability to create your own inventory (builders) and design customer mortgage financing packages that work while leaning on your own mortgage operations has been a boon to builders that is reflected in their financial results and stock performance.

The above chart updates the median new home price history vs. sales volumes since the end of 2000. The current median price for March 2024 is $430.7K. The current volume of 693K is above the median since Jan 2001 of 636K across a period that included a boom and bust as evident in the dramatic differential in Hi-Lo range in volumes from 1.39 million in July 2005 to 270K in Feb 2011. The strength in pricing in recent periods after COVID tells a favorable story for the builders even if off the late 2022 peak.

The above chart offers another visual on median pricing history that underscores the one-two punch that high home prices and high mortgages have meant to affordability in the market. That has not stopped the builders from generating exceptionally strong financial results that have slowed into rock solid and liquid balance sheets, high stock buybacks, and material outperformance of homebuilder equities across the past year (see Footnotes & Flashbacks: Asset Returns 4-21-24).

The above chart updates the monthly median prices for new homes since Jan 2022 or just before the onset of the tightening cycle. The range is in the $400K handle zone, but such data always comes with an asterisk for regional mix within a stark Hi-Lo range whether the home is made by D.R. Horton with its $300K handle average sales price or by Toll Brothers at 7-digit prices.

The final two charts plot the volumes for the two largest regions (South, West) and the two smallest regions (Midwest, Northeast) in the next chart. As noted above, the South and West are running sequentially higher but remain well below prior peaks this cycle.
The South, with Texas and Florida among the massive housing markets, shows sales up by +7.7% sequentially and +4.5% YoY. The long-term median for the South is 308K vs. the March 2024 level of 391K. The West region at +177K is essentially flat to the long-term median despite being +18.8% YoY and +8.6% sequentially.

We wrap up with two smaller regional markets with the Midwest +23.4% YoY and +5.3% sequentially in sales volumes. The very small Northeast market was -13.2% YoY and +27.8% sequentially. Both of these regions are running below the long-term medians.
See also:
Systemic Corporate and Consumer Debt Metrics: Z.1 Update 4-22-24
Footnotes & Flashbacks: State of Yields 4-21-24
Footnotes & Flashbacks: Asset Returns 4-21-24
D.R. Horton: Ramping Up in 2024 Despite Mortgages 4-19-24
Existing Home Sales March 2024: Not Something Old, Something New 4-18-24
Housing Starts March 2024: The Slow Roll and Ratchet 4-16-24
Credit Markets Across the Decades 4-8-24
Credit Cycles: Historical Lightning Round 4-8-24
New Home Sales Feb 2024: Hope Springs Eternal, but Demand Seasonally 3-25-24