
Market Commentary: Asset Returns 3-15-26
The weeks can always get stranger in the US-Iran policy dynamics and guiding strategy, but that “strange” bar has been set high.


The real enemy is the media (and the Constitution). Not Salidin.
Equities and debt have both been mired in the red zone as the UST curve faces pressure, the FOMC handicapping keeps pushing the odds of easing into late fall, and credit spreads are starting to feel widening. At +328 bps to end last week, HY OAS has moved well wide to the June 2007 levels (sub-300 bps) where it had been hovering but still is in the area of where low spread levels were seen in June 2014 and Oct 2018.
The effects of the oil crisis (consumer threat in the US?) and natural gas dislocation (notably LNG for the EU and Asia) have been picked over daily with the past week ending with WTI at $98.71 and Brent at $103.14. Over a 1-month period through 3-14-26, national retail gasoline prices are up by 25% to $3.67 (CA at $5.48, AZ at $4.30) and diesel up by 35% to $4.94 as we go to print. That diesel cost will run right through the buyers of goods and services in some form including direct surcharges from food to merchandise.
It is always a strange week when Pentagon updates begin with attacks on the media from a former Fox show host (Fox as an arbiter of facts?) whose anti-media rants were sandwiched between prayers this week. The Hegseth Templar posing (matches his tattoo) and misinformation is getting old, but the strategic confusion and apparently poor grasp of the Hormuz risks have shocked many. The potential for open-ended escalation lurks, and we now see Trump demands for more European and Asian allies to get involved on the Naval side (from “coalition of the willing” in 2003 Iraq to “coalition of the intimidated”?). This is where allies matter since many can in theory cut deals with Iran. In a twisted irony, Russia is getting rewards on sanction relief even as Ukraine trains the US on drone combat. Meanwhile, China faces material risk on oil supply. At this point, all we need is an Archduke to shoot.
For the best objective and granular color on risks and capabilities of the parties (on the ground and at sea level), we recommend Black Man Spy - Malcolm Nance | Substack. He has been literally on the ground and sea (military and intelligence) and in that game in the Middle East since the 1980s in the risky end of the business. He cuts through the Hegseth chanting and hand waving.
The moving parts of the Iran War and policy game plan have turned into a hyperactive, ADHD-impaired changeling. The themes have run from a containment policy to saturation bombing with geopolitical positioning teed up by religious fanatics (on both sides) talking about death and destruction like a video game. Now the Marines are on the way, and they don’t mess around. No wonder the oil markets are confused with Kharg Island now the next level in the Warfare Strike video game. Destruction of Kharg would only further damage the global supply and demand imbalances and set off more intra-Gulf violence and infrastructure damage. US would get some benefit on oil and LNG exports dollars.
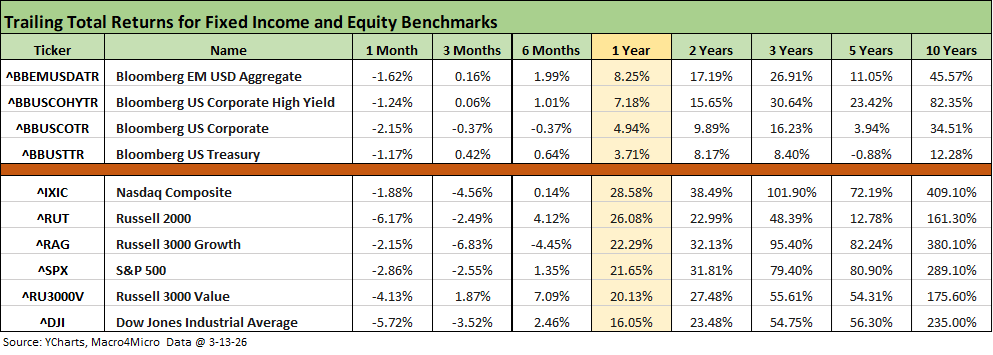
The above chart hammers home that the path to springtime has been a painful one with a lot of uncertainty ahead. The chart details returns across a number of our debt and equity asset class benchmarks. We see all of them negative for 1-month in debt and equities. Debt is mixed over 3 months with duration the victim of the UST curve with IG Corporates negative. As we cover in a separate commentary, IG and HY spreads are both wider over the past week and month. IG OAS is +16 bps wider for 1-month and HY OAS by +44 bps. IG was +9 bps for the week and HY +15 bps.
The equities story has been mixed with concerns around excessive AI valuations rolling into a sector rotation theme with the latter now flowing into the energy crisis and how that will undermine cyclical trends for transports and industrials and the consumer sector. Looking back 3 months, the only positive line was Russell 3000 value. As we cover in the chart collection below, the 3-month period saw Materials (XLB), Consumer Staples (XLP) and Industrials (XLI) make the top quartile joined by 3 energy ETFs (XOP, XLE, AMLP) and the Utilities ETF (XLU). Base Metals (DBB) made the top quartile as tech-centric ETFs were shut out of the top tier for 3 months detailed further below.
The rolling return visual
In the next section, we get into the details of the 32 ETFs and benchmarks for a mix of trailing periods. Below we offer a condensed 4-chart view for an easy visual on how the mix of positive vs. negative returns shape up. We see it as a useful exercise in looking for signals across industry groups and asset classes.
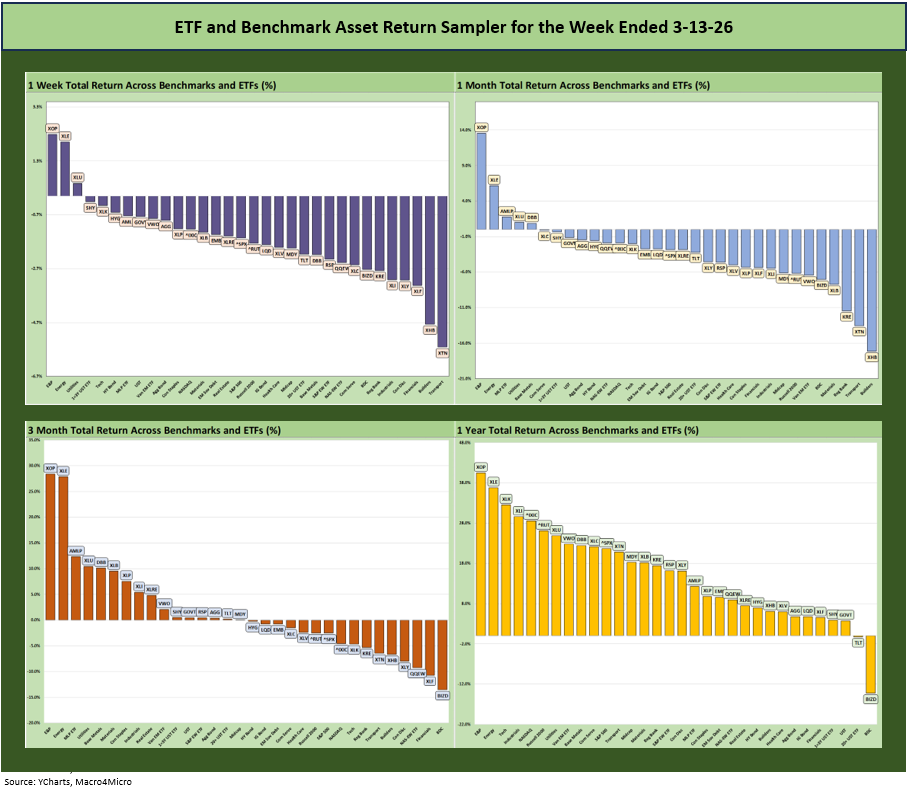
The 1-week and 1-month story is clear enough in the symmetry. It has been a very rough ride as a mild tech panic on AI displacement and disruption theories gave way to an unfolding energy crisis and a major Middle East war. Iran War effects are reverberating across the region and now the world. The damage to EU and Asia from the supply-demand imbalance and price shock is real and immediate.
The strategic reactions, corporate level adjustments, and macro and geopolitical decisions will take time. Where and when suicide speedboats, drones, and missiles will see higher rates of deployment is not an exact science. Neither is the long tail of asymmetric terror threats and how nations will respond.
The Magnificent 7 heavy ETFs…
Some of the benchmarks and industry ETFs we include have issuer concentration elements that leave them wagged by a few names. When looking across some of the bellwether industry and subsector ETFs in the rankings, it is good to keep in mind which narrow ETFs (vs. broad market benchmarks) get wagged more by the “Magnificent 7” including Consumer Discretionary (XLY) with Amazon and Tesla, Tech (XLK) with Microsoft, Apple, and NVIDIA, and Communications Services (XLC) with Alphabet and Meta.
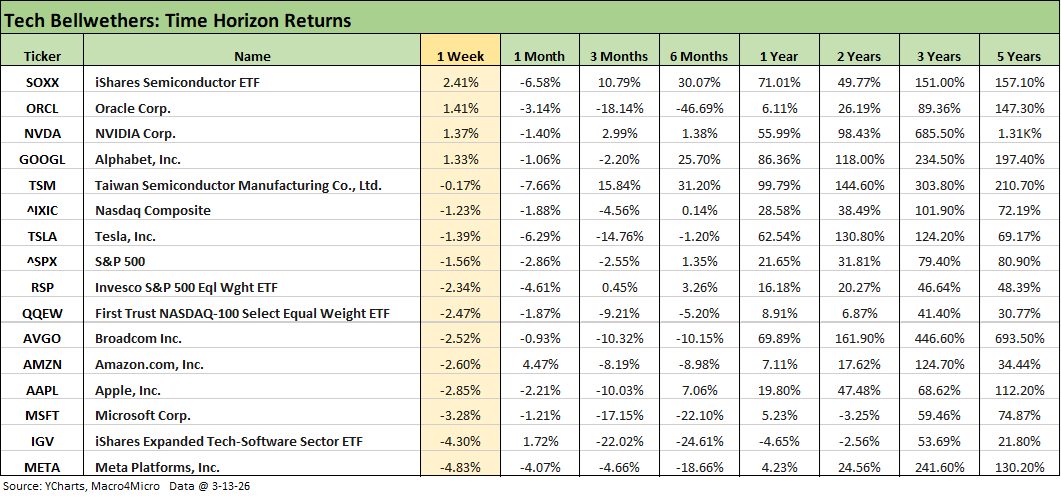
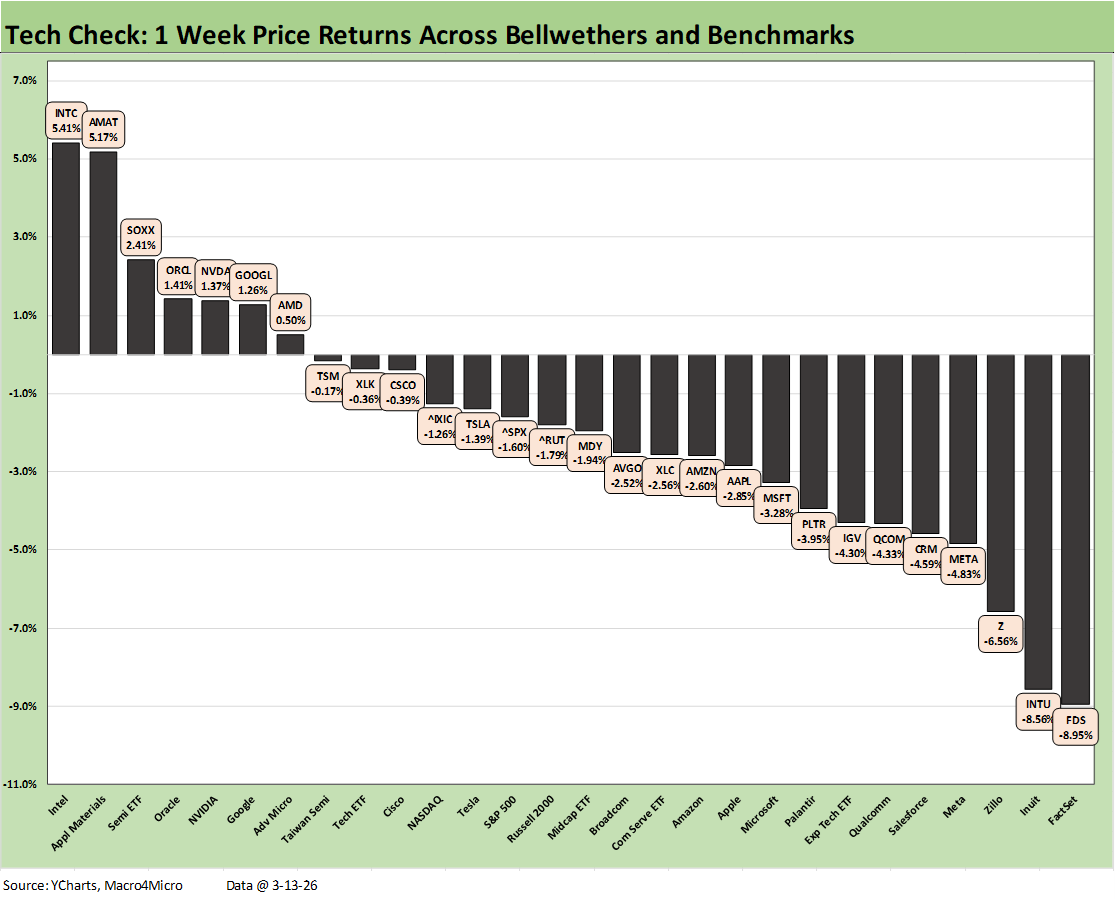
The tech bellwether returns across a range of timelines is broken out above. We see only 4 lines in positive return range for 1 week across the 16 lines. The Semi ETF (SOXX) is on top ahead of Oracle (ORCL), NVIDIA (NVDA), and Alphabet (GOOGL). We see 4 Mag 7 names in the bottom 5 returns for the week joined by the Software ETF (IGV).
Looking back 3 months, we only see Taiwan Semi, NVIDIA, the Semi ETF (SOXX) in positive range in the tech equity mix with only the Equal Weight S&P 500 ETF (RSP) barely positive. We also see some double-digit negative returns in that 3-month horizon such as IGV, ORCL, MSFT, AAPL, AVGO, and TSLA.
We also recently added a “Tech Check” bar chart with 28 asset lines from benchmarks to ETFs to single name stocks. We include 1-week and 1-month versions further below.
The commentary below is mostly a cut-and-paste from an earlier post on LinkedIn Saturday with some additional inputs:
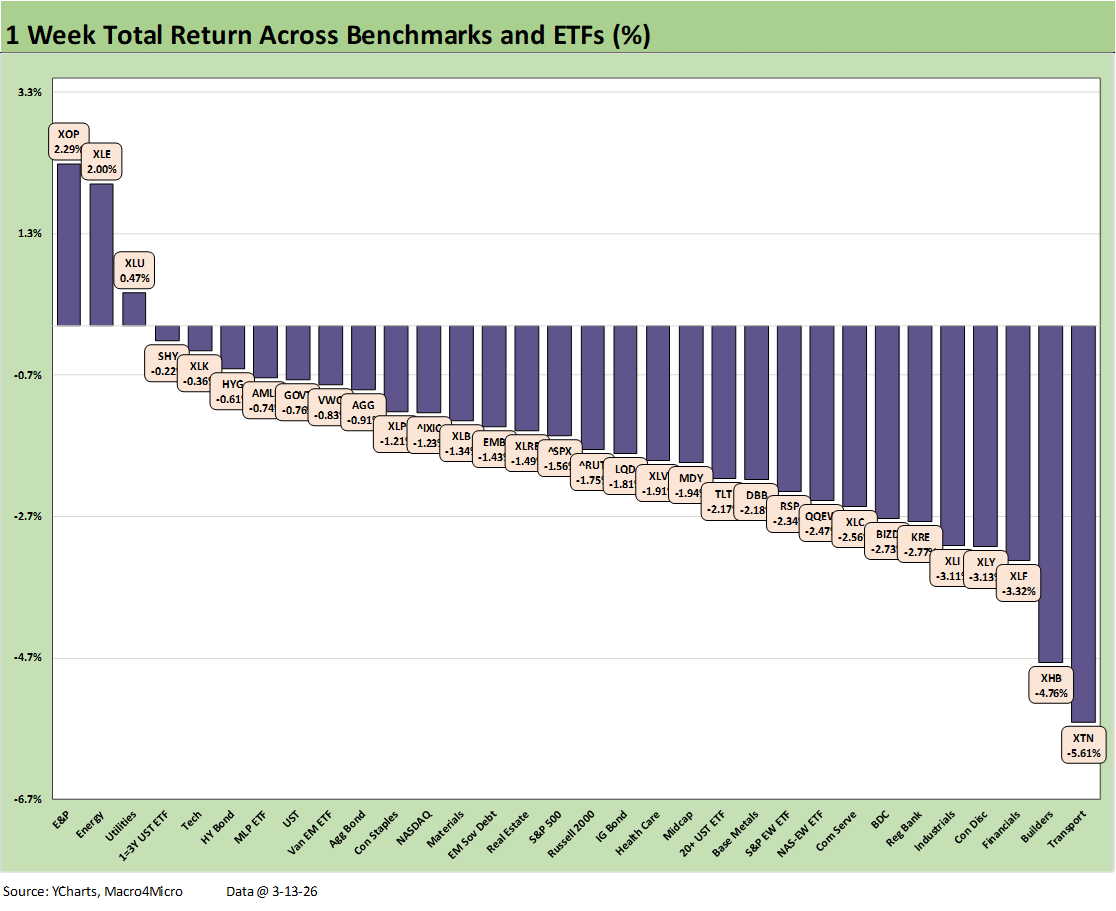
The equity benchmarks around the world moved into negative return range for this past week and joined the US. The US broad market benchmarks were in the red from large caps (Dow, S&P 500, NASDAQ) down to Midcaps and the Russell 2000. The S&P 500 saw 9 of the 11 sectors in negative return range after 10 of 11 were in the red last week. This week, Utilities joined Energy in positive range in the S&P sector mix.
The chart updates weekly returns for the 32 benchmarks and ETFs we watch, and the concerns around the direct and indirect impact of the Iran War are evident and justified. Those of us in the work force during the 1980-1982 stagflationary double dip (or filling up Mom’s car with gas after the oil embargo triggered the late 1973 to early 1975 recession) can remember that the words “multiplier effects” is about more than a lesson-of-the-day in intro economics.
The multiplier effects include food pricing and how consumer goods got hit by delivery costs. Demand was undermined on weaker household budgets after the zero-sum effects of gasoline and home heating bills played out. There was severe damage done to the manufacturing sector back in those earlier crisis periods and notably in 1980-1982.
Oil price headlines do not need revisiting, but the week ended with WTI at $98.71 as retail gasoline and diesel immediately spiked. The concept of lower discretionary household cash flow and consumer fallout does not need a lot of debate. The adverse direction of the 4Q25 GDP update this week hit the headlines while the challenge of disposable income vs. PCE was seen in the PCE Income & Outlays report (see PCE Inflation Jan 2026: Personal Income & Outlays 3-13-26, GDP 4Q25 Second Estimate: Sharp Move Lower 3-13-26). The spike in retail gasoline and diesel will bring headwinds to go with recurring payroll worries.
The positive vs. negative score in the chart posted 3-29, so there is little left to the imagination on the left side of the mix. It is easy enough to click on the holdings of any of these subsector ETFs and see the company connections to Iran War fallout.
US Energy is doing well as Trump emphasized this past week, but he forgot to mention the old rule of “one person’s revenues are another person’s expenses.” The hydrocarbon chain flows into quite a bit of the economy from direct costs to inputs along the materials chain (petrochemicals and downstream derivatives).
Transports (XTN) were in last place with ground transport, air freight, and airlines feeling pressure. Airlines will see jet fuel soaring and pressure on volumes. Elasticity of demand will kick in with leisure and business travel budgets gut-checked. For “Cargo Ground,” the cost pressures from gasoline to diesel and potential volume risk will get reassessed in equity valuation.
The UST curve is seeing pressure from Iran fallout with bond ETFs negative. The Homebuilder ETF (XHB) was 2nd to last with mortgages ticking higher by Friday to 6.41% (Mortgage News Daily). The mortgage move was sharp from the low 6% range to wind down the week with Freddie Mac at 6.11% (set on Thursday). A quick search showed how mortgages were all over the lender map (refi rates are typically higher than purchase mortgages).
We see Financials (XLF) and Regional Banks (KRE) sitting in the bottom quartile as credit risk fears were elevated again on cyclical worries as well as the deterioration in private credit color with some lenders to the BDC entities reportedly haircutting the loan values in their lending assessments. FOMC-based funding cost relief for deposits is also under a cloud as the FedWatch odds of easing signal no action at least until late fall.
There certainly are a lot of direct, indirect, primary, secondary, and tertiary effects to ponder. The challenges in a highly partisan environment is that the policy makers and economists will simply fall in behind the President out of fear, loyalty, or cowardice. For example, it took months for anyone on Team Trump to admit who “writes the check” for a tariff. Trump was angry with his Trump 1.0 team (e.g. Cohn, Mnuchin) for telling the truth, so he found a more conceptually and factually “flexible” team for Trump 2.0
The commentary below is mostly a cut-and-paste from an earlier post on LinkedIn on Saturday with some additional inputs:
We started the “Tech Check” list of ETFs and issuers around 6 weeks back, and the swings have been dramatic across the YTD period with running returns heavily weighted to the downside. We include major benchmarks as well in the mix (S&P 500, NASDAQ, Midcaps, Russell 2000), and those were all negative for the week.
Of the 28 detailed, we see 7 positive and 21 with negative returns. We see 5 of the Mag 7 in negative range with NVIDIA and Alphabet in the top quartile in positive range. Among the Mag 7, META ranked at the bottom.
Tech services have been getting some very recent relief in the SaaS-heavy names as discussed in recent commentaries, but this past week saw them holding 4 of the bottom 5 returns with those all in the negative return zone. The four we had chosen to track after the AI-driven mini-panic included Salesforce (CRM), Intuit (INTU), FactSet (FDS) and Zillow (Z). All 4 were deeply negative this week. The best of the 4 in terms of YTD price performance is Salesforce (CRM) at -27.2% with the worst being Zillow (Z) at -37.1%. That has not been pretty in “SaaS land.”
The sell-off has been tied to fear of AI displacement for company services, but the Iran fallout can also bring fear of adjustments to customer planning and IT budgets. The cycle cannot help but loom as a factor given uncertainty around expense management and capex decisions. The other theory is higher UST rates tied to energy market pressure will intrinsically take the edge off long term valuation math and the discount rates of choice. That hits the (misnamed) “long-duration equities.”
The question of how much risk tomorrow’s AI customers will be willing to take in reshaping their business models to prepare for AI growth is a subjective variable. For some, the opportunity to shed payroll as offsets will be an attraction. For others, the need to overhaul systems and disrupt established vendor relationships might sound more reasonable on the “tech heads” whiteboard than to those who actually approve diving into the process with its disruptions and the operating risks that comes along with it. AI fans will have a few million counters to every concern that customers might raise.
Oracle (in the chart) and Adobe (not shown in the chart) both released earnings this past week with ORCL posting good numbers with a solid week for the stock during a bad YTD period (-20.4%). Adobe posted a bad week during a bad YTD period (-28.8% price return). The software ETF (IGV) has both those names among its top holdings with the IGV ETF still landing in the upper end of the bottom quartile this week. In contrast, the Semiconductor ETF (SOXX) was in the top quartile at #3.
Two tech legacy leaders in the form of Intel (INTC) and Applied Materials (AMAT) held down the top two slots. INTC is +24.0% YTD price return with AMAT’s YTD return at 32.9%. In other words, some old school names are winning this year including Taiwan Semi at +11.3% YTD.
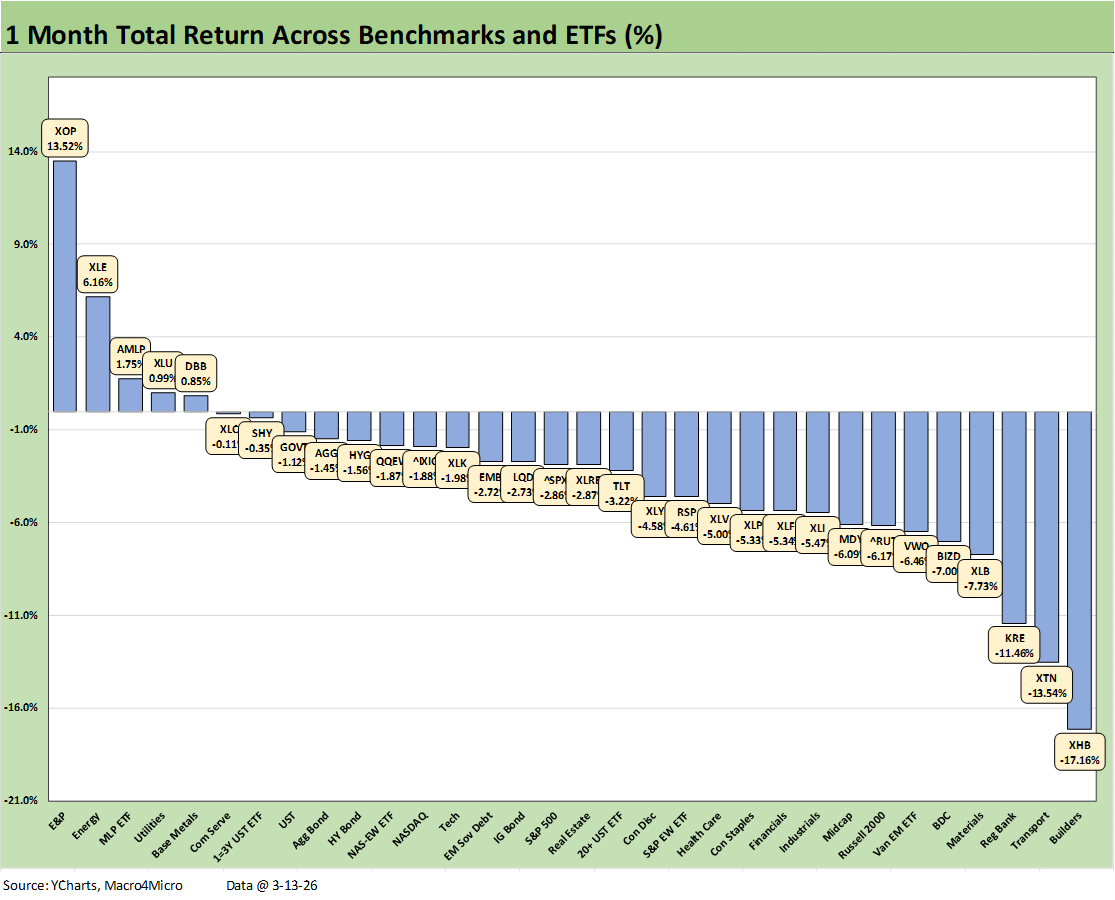
The chart frames the returns on our 32 benchmarks and ETFs across a challenging 1-month span that included tech subsector turmoil but more importantly a war with Iran that is creating havoc in energy markets and across the Gulf with oil and LNG spiking. The score of 5-27 tells the story.
Iran will remain the main event in coming days. Confidence is low in the coherence and prudence of the strategy given the myriad and sometimes conflicting rationales provided and the inconsistency with past declarative statements (“obliteration” of nukes, etc.). The criticism of whoever is in power when wars happen in the Middle East is not new (George HW Bush, George W Bush, Obama, Biden, and now Trump), but the political toxicity makes this time more threatening with the FCC threats this week continuing the backdrop of constitutional abuse.
The White House reaction and free speech attacks is more like Wilson in a declared war than Vietnam in an undeclared war. Cronkite in 1968 at CBS after Tet would have been threatened by FCC head Carr if that happened in 2026. It is a sign of troubled times.
Carr’s warning this week will not reduce political risk and policy turmoil:
“Broadcasters that are running hoaxes and news distortions — also known as the fake news — have a chance now to correct course before their license renewals come up,” Carr wrote in a post on X. “The law is clear. Broadcasters must operate in the public interest, and they will lose their licenses if they do not.”
With Trump 0 for 3 on popular vote majorities, we are not clear how Carr defines
“public interest.” Apparently, public interest is a cabinet meeting or a room of 2.
The market has seen wild oil and LNG swings as recently as 2022, so this is not new. What is new is the fact that Iran has now officially been bombed to the point of desperation, and that takes constraints off that would deter the worst sort of asymmetric threats (routine, open, state sponsored terror on the US). If there ever were any controls or checks on the radical leadership of Iran, it was the fear of being bombed into the stone age. That “check” on such rampant behavior is now gone.
Anyone in a logical terrorist target area who does not see that risk has increased is missing something (I lived across the street from the twin towers for almost 3 decades). While we will all go about our business, the reaction from the US if bad events unfold will be more bombing and more retaliation against the Gulf states by Iran. There is a lot of energy infrastructure in the Gulf for Iran to aim at. That means this war zone backdrop could be around for a while even if Trump declares victory and exits.
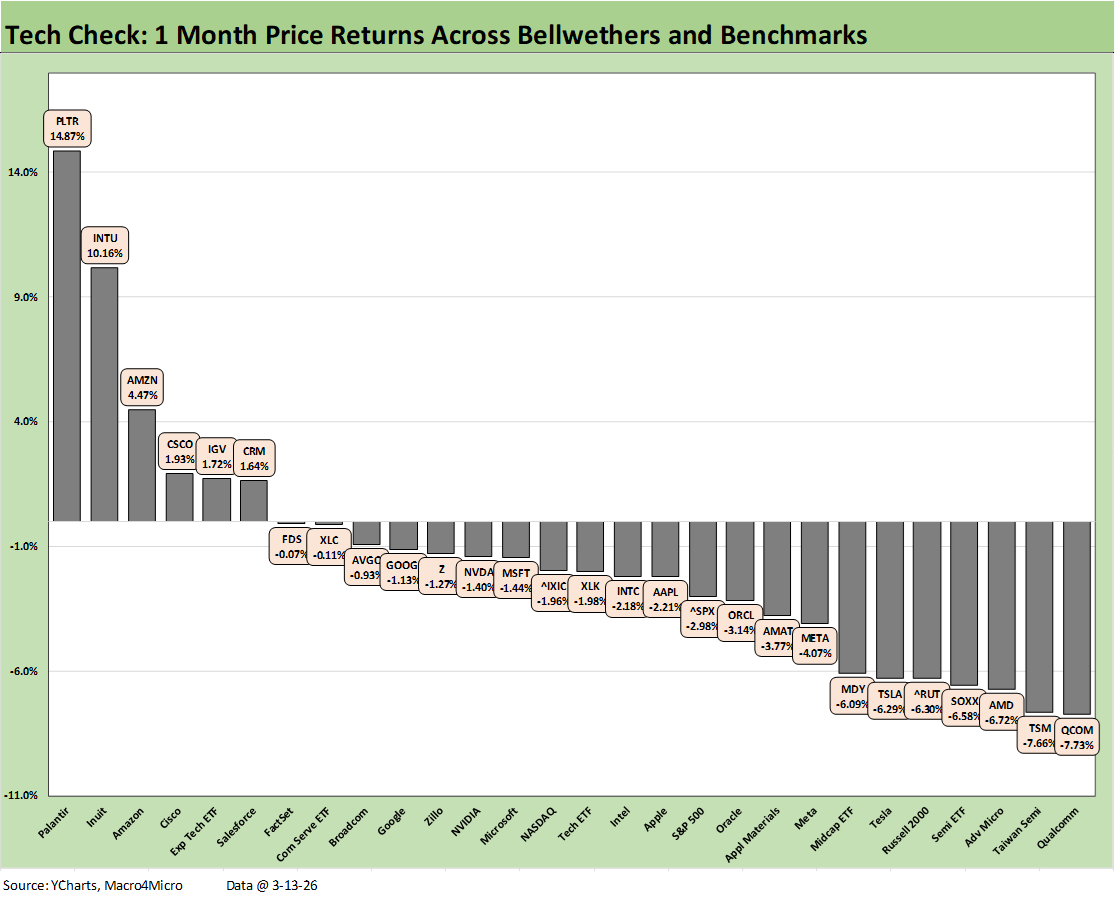
The 1-month Tech Check has a very distinct story from Iran on the core drivers of overall risk as markets get dominated by the Iran War. We see a score of 6-22. The rebound of some key software lines were the main winners. We see 1 Mag 7 name in positive range with Amazon. The remainder of the Mag 7 were spread across the other 3 quartiles.
Tech valuations will by definition be influenced by the UST curve and cyclical trends. That said, AI and secular changes tied to AI and business models are the main events for tech equities as we have addressed in other commentaries.
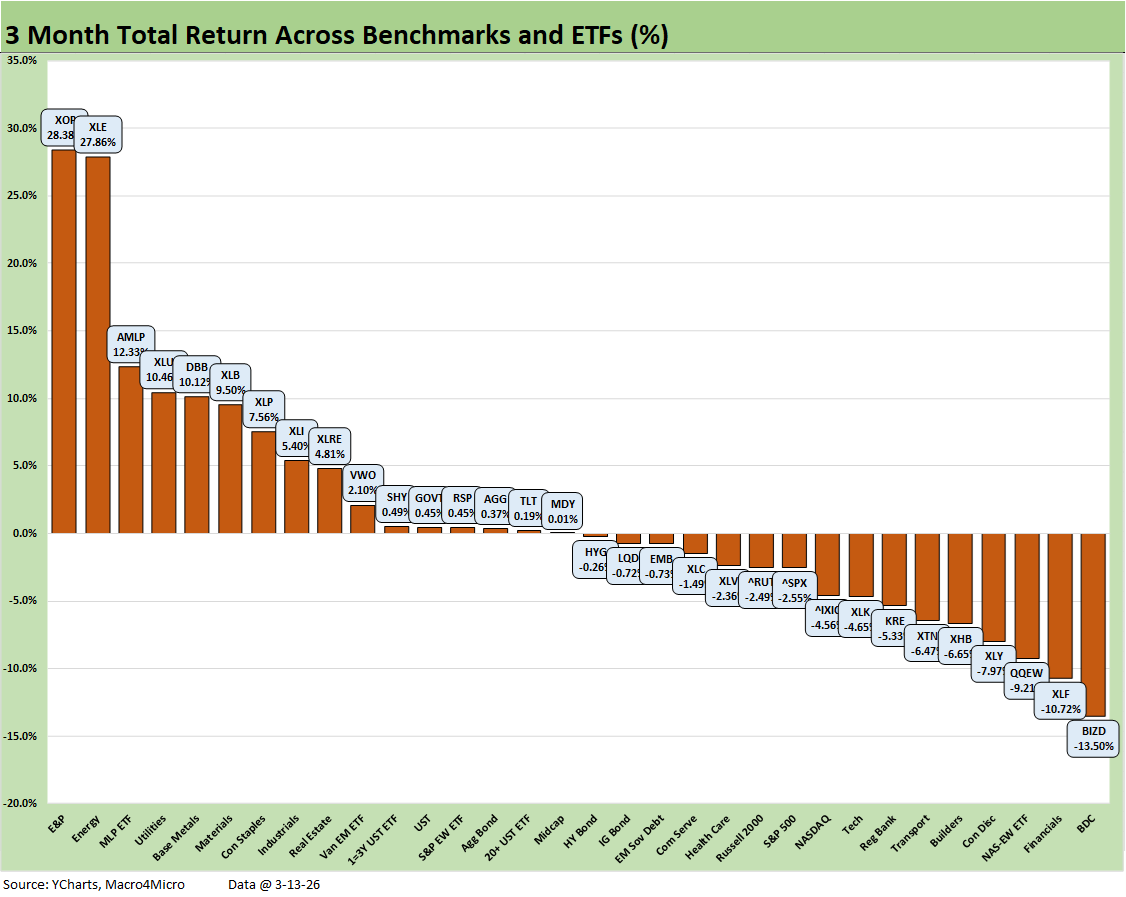
The 3-month timeline is split at 16-16 with the big winner naturally being energy with XOP #1 and XLE #2 with Midstream (AMLP) a distant #3. Utilities (XLU) and Base Metals (DBB) round out the top 5 with the rotation theme in evidence with Materials (XLB), Consumer Staples (XLP), and Industrials (XLI) also in the top quartile. For bond ETFs, we see 4 positive and 3 negative with HYG, LQD, and EMB negative.
The big losers for the rolling 3 months with double-digit negative returns include the BDC ETF (BIZD) and Financials (XLF). Private credit is mired in redemption headlines that raise fears of more challenging mark-to-market risks with liquidity needs to fund outflows. The worry is around how that will flow into the broader carrying value debate beyond the private non-public funds and extending into valuation questions in the public BDCs.
The credit rating firms that were involved will face some regulatory pressure in a flashback to the RMBS days of 2009-2010 when the SEC and Congress got involved. The banks will also see some regulators (notably the Fed and OCC) sampling how banks treat their “loans to the private lenders” and what that means for reserving needs.
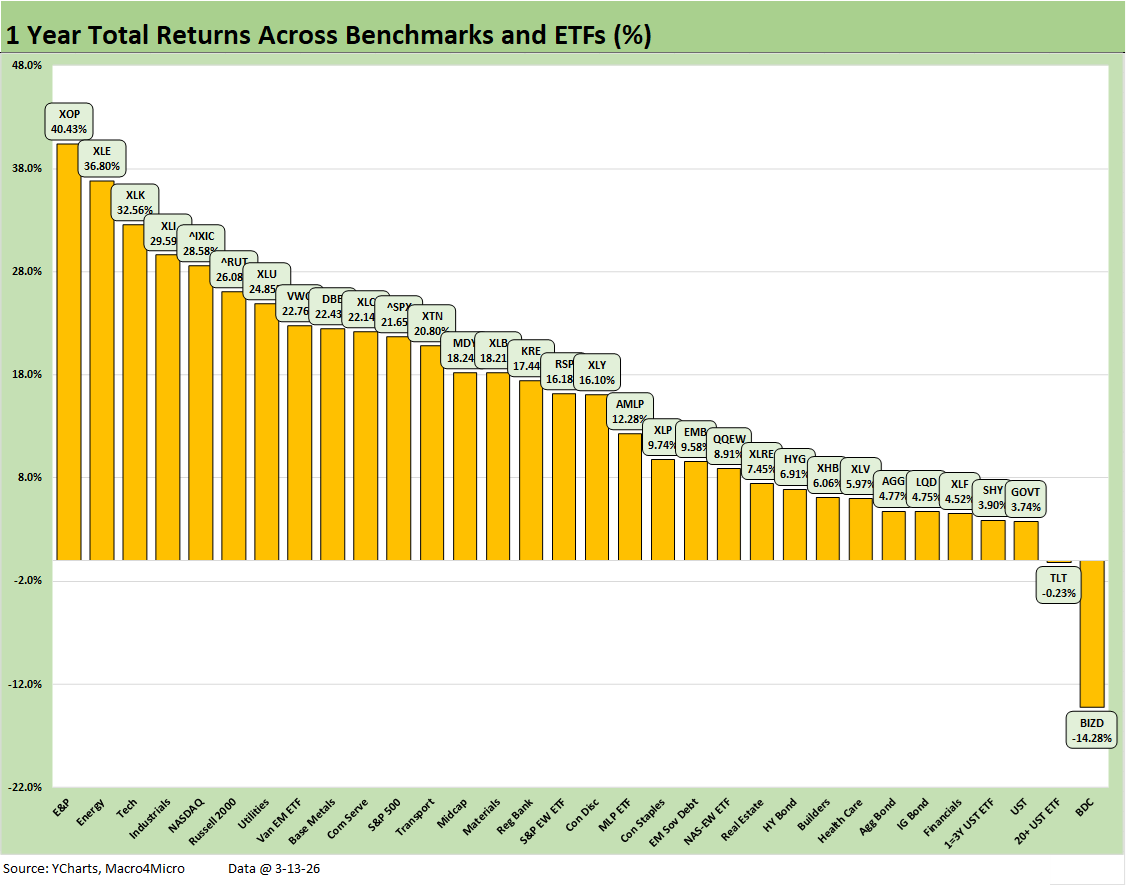
The LTM return chart is looking more like nostalgia these days at 30-2. The BDC ETF is in dead last at -14.3% and we see a slight negative for the long duration UST ETF (TLT) at -0.23%. TLT is coming off a -2.2% week as the UST curve is facing some setbacks with Iran and inflation fears.
See also:
PCE Inflation Jan 2026: Personal Income & Outlays 3-13-26
GDP 4Q25 Second Estimate: Sharp Move Lower 3-13-26
Housing Starts Jan 2026: Total Starts Up, Completions Up, Permits Down 3-12-26
CPI Feb 2026: It’s Making You Wait… 3-12-26
Existing Home Sales Feb 2026 3-10-26
Market Commentary: Asset Returns 3-8-26
Payrolls Feb 2026: Into the Weeds 3-8-26
Employment Situation Feb 2026: Payrolls Get Ugly 3-8-26
VIX: Market Still Not Getting the Vapors 3-6-26
Meanwhile…Back in Economics and Tariffs 3-2-26
PCE Income & Outlays Dec 2025: Inflation Reversal? 2-20-26
4Q25 GDP (Advance Est.): Less Distortion This Time 2-20-26
2025 trade Deficits: Reality vs. Rhetoric 2-19-26
Industrial Production Jan 2026: Capacity Utilization Trends 2-19-26
Home Starts Dec 2025: Wrapping a Weak 2025 2-18-26
Market Lookback 2-17-26
2025 Spread Walks and Multicycle Return Histories 1-5-26
Annual Return Differentials: HY vs. IG Across the Cycles 1-3-26