
Footnotes & Flashbacks: State of Yields 3-10-24
The favorable move in UST offered bonds some return support while spreads tightened slightly with CPI and PPI waiting in the wings.


The market saw a modestly positive move in the UST curve for duration, a slight tick lower in mortgages, and a small dose of spread tightening as the market now braces for another round of inflation data this week along with consumer signals from Retail Sales and an update on Industrial Production.
The job numbers (payroll, JOLTS) told a story of solid labor demand and paycheck count, but the ranks of the unemployed outpaced new payroll count and the unemployment rate ticked up to just under the 4% line, which is still quite low but moving the wrong way.
We look at the 3M to 5Y UST slope this month as the inversion grows again with cash still a viable asset allocation for the defensive, patient, or confused.

The above chart updates the shifts in the UST curve from the period of the peak 10Y UST (10-19-23) down through last Friday. We then see the partial retracement of the UST higher YTD. The big rally from the 3rd week of Oct 2023 has given way to an adverse UST shift YTD 3-8-24, and that has been a check on bond performance.
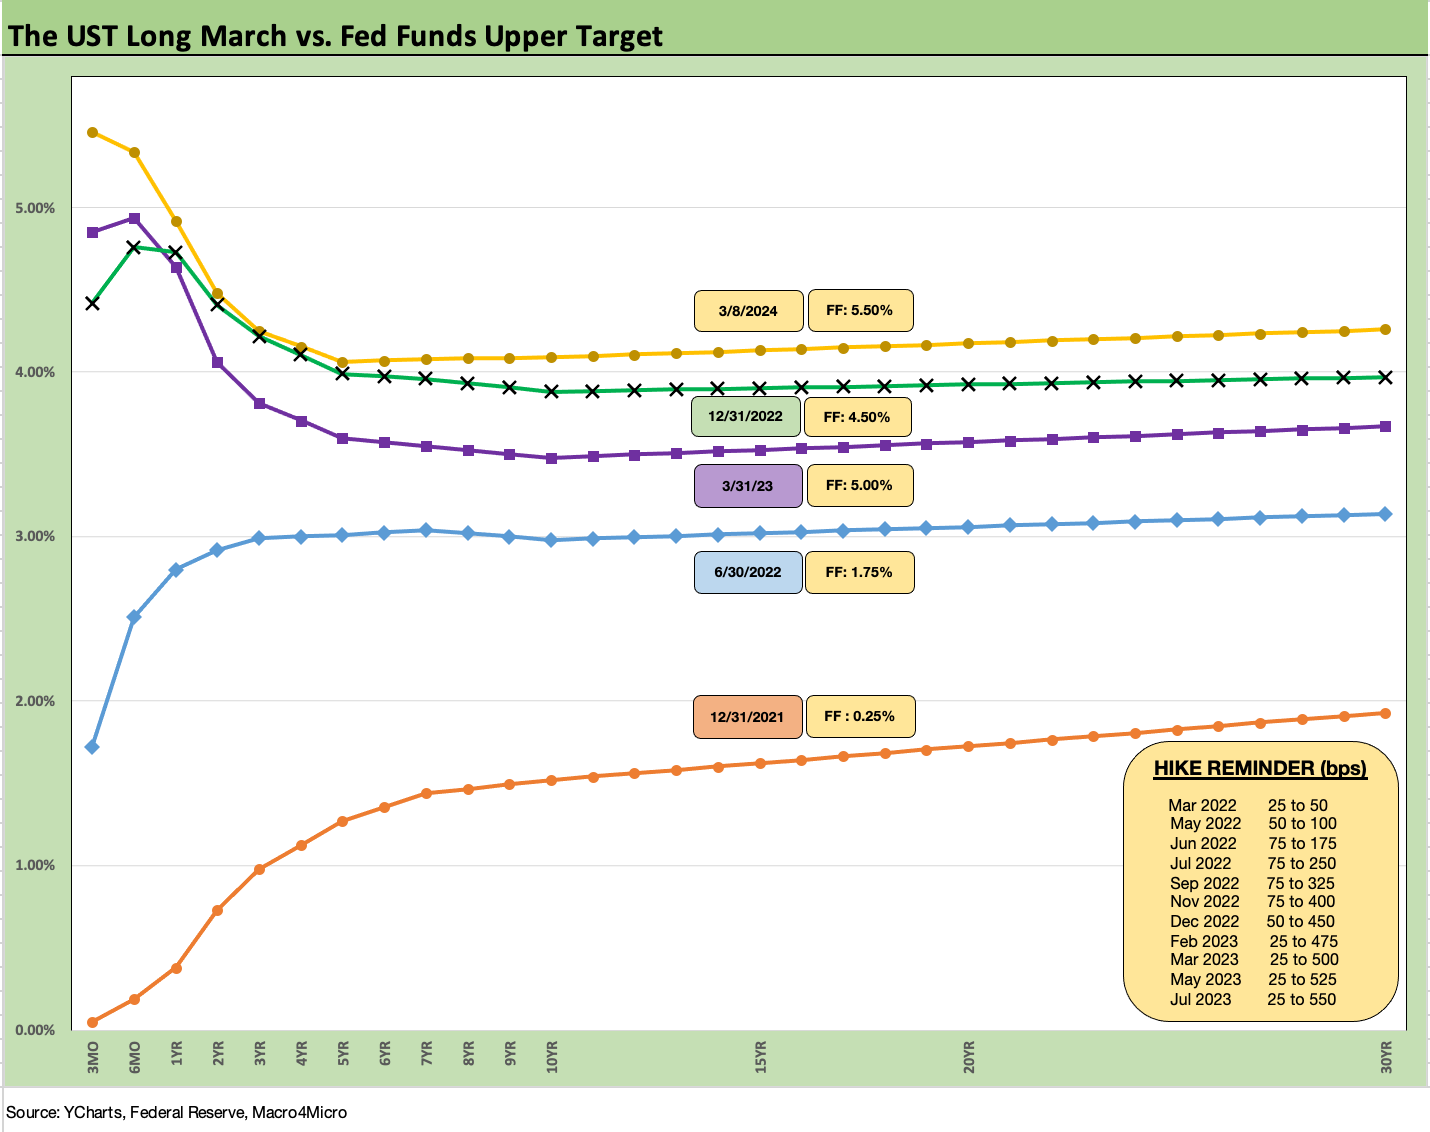
The above chart details how the crow flies for UST from year end 2021 across some key dates to the 10-19-23 peak and up to the past week close. We show some key interim dates on the migration from upward sloping into a bear flattening and the morphing bear inversion from the short end.
We also include a memory box in the chart on the timing and magnitude of the Fed hikes.

The above chart posts the weekly UST deltas. We see a mild bull inversion trend with the 5Y to 10Y moving a bit more than the 30Y and the short end moving slightly higher through Friday.

The above UST delta chart updates the downward move in the UST curve from the date of the 10Y UST peak. The UST support for bond returns has been positive in late 2023 but the YTD period has taken back some of the good news for bonds that rolled in with the big UST rally of Nov-Dec 2023.

The above chart posts the YTD UST deltas as bonds have struggled to date in 2024 with a combination of good economic news and mixed monthly (MoM) inflation numbers even if YoY has been moving the right way to 2% handle Headline PCE and Core PCE. Consumption (PCE) has remained solid also. Employment has been strong and services inflation sticky as we detail in the links at the bottom.

The above chart breaks out the mortgage rates using the Freddie Mac 30Y as that ticked slightly lower from last week. We also plot the UST curve and 30Y mortgage rates from the end of the homebuilding peak year (2005) and mid-2006 when the RMBS and mortgage originators were getting more scrutiny on dubious origination practices and loan quality.
The much lower UST rates in the 10Y area this past week vs. 2005-2006 and higher mortgage rates today tell a story of high mortgage spreads now relative to 2005-2006 and the housing bubble reality of too many mortgages getting chased to be bundled up, sold off, and risks laid off. We know how that ended.
We have been covering the dynamics of the housing sector across our macro and micro level coverage down to the single name level, and the performance of builders (XHB ETF) has been dazzling with the ability of the builders to use creative incentive packages to capture a higher share of total home sales so far in this cycle (see New Home Sales Jan 2024: Sales Steady, Prices Resilient but Softening 2-26-24).
The peak spring and summer season is dead ahead and the recent flirtation with 7% mortgages before modest declines this week will keep builders in the working capital discipline mode of balancing starts with deliveries (see Housing Starts Jan 2024; Slow…Curve Ahead? 2-16-24).
The strain on affordability and existing home sales is still a tough story, but this past month has seen the market slowly adapting to 6% handle mortgage rates (see Existing Home Sales Jan 2024: High End Climbing, Low End Stagnant 2-22-24).

The above chart updates the running all-in index yields of HY vs. IG since 1997. The most relevant comp for forward-looking purposes is the pre-crisis median of 9.3% for HY and 6.1% for IG. If we include all those ZIRP and QE years, then the median drops to 8.1% for HY and 4.6% for IG. The recent yield for IG of 5.29% and 7.71% for HY are less compelling in pre-crisis context but are looking good to asset allocation planners who have been starving for yield since 2008.

The above chart uses 1997 and 2007 as frames of reference for credit cycle peaks for IG, and we also plot the UST curve from those periods to compare vs. the current backdrop. IG spreads tightened slightly over the past week by -2 bps (ICE) to +99 bps but have been within a narrow range.
As frames of reference, these IG levels are near those seen at the end of June 2007 but are slightly wide to the +93 bps average of 1H04 to 1H07. The 1H07 period averaged +86 bps.
The all-time low for IG was +53 bps in Oct 1997 before reaching +70 bps at the end of 1997 and averaging +95 bps for 1997-1998.

The above chart does the same exercise for HY that we did for IG. We use June 2007 and the end of 1997 as credit peak periods. The yields to end last week for US HY are lower than 1997 and 2007 on a materially lower UST curve but with spreads wider today than the sub-250 bps lows of June 2007 and Oct 1997.
The -6 bps OAS tightening last week to +326 bps is below the June 2014 low of +335 bps (6-23-14) but slightly above the Oct 2018 low of +316 bps (10-3-18). For a read on the sustainability of low spreads, consider the +270 bps average of 2H97 and +298 bps in 1H98. We do a more detailed review of HY spread histories in the 2023 recap (see Footnotes & Flashbacks: State of Yields 1-1-24) and in the links below covering quality spread histories.
HY issuers have been afforded the luxury of solid fundamentals, a higher quality overall ratings mix, and a downward bias in rates if inflation cooperates and the Fed starts to move. The timeline will keep shortening to potentially trigger more of the inevitable refi-and-extension priorities in an asset class where refinancing “early and often” is usually critical ahead of potential threats to the cycle. The extended recovery has bought liability managers some time.
At some point, the “pull-to-par” effect from redemption schedules will get stronger for the healthier names but the coupons (par weighted 6.1% for the HY index) are below market right now for a HY index priced at 93. That sometimes encourages a stall rather than rolling into new higher coupons.

The above chart updates the 3M to 5Y UST slope across the years since 1984. The inversion is currently at -140 bps vs. the peak inversion of -197 bps in May 2023. The inversion steepened by -25 bps this past week. The long-term median since 1984 is upward sloping at +112 bps.
We look at more of the UST segment slopes we like to watch and detail them in the box within the chart. Long term medians are all upward sloping (materially so), and only the 5Y to 30Y is currently upward sloping.
As term premiums go, the wrong side of extension would get ugly if inflation heads north again and we see a UST “steepener toward a flattener” kicking into gear again as we briefly saw in 2023. The market would have to be dramatically wrong for a major steepening with some material move in inflation setting off an exogenous event. The supply-demand balance of UST could not do it alone, but a clash with major UST holder China would not help.

The above chart plots a shorter-term 3M to 5Y UST slope time series from the start of 2021. We see a median of +38 bps and upward sloping across that shorter timeline with a peak slope in May 2022 of +221 bps before a steep inversion arrived with a vengeance on the tightening cycle.

We wrap with our usual final chart where we update running UST deltas from March 1, 2022 through the past week close. We detail the deltas in the box. As frames of reference, we add the 12-31-20 UST curve and the 10-19-23 UST curve when the 10Y UST peaked. The journey was a long, drawn-out bear inversion with the front end set more by fed funds and waiting for a Fed move.
We will see what the CPI holds this week and whether Retail Sales will make the market nervous as we saw in the early fall (see Retail Sales Jan 2024: Balancing Act Continues 2-15-24, ).
Industrial Production and Capacity Utilization (see Industrial Production: Capacity Utilization Limps Along 2-15-24) have been waffling along unimpressively to keep manufacturing off the UST bear list. The state of manufacturing sees a lot of divided opinions across economists, data watchers, and stock analysts.
Despite the protracted ISM signals for contraction, recession signals have not been coming out of earnings season and guidance. Durable goods have been in deflation mode also, so some good news in run rates should not set off alarms (see Inflation Gut Check Jan 2024: PCE Prices, Income, and Outlays Help the Story 2-29-24, Durable Goods: Forced Landing 2-27-24).
See also:
Footnotes & Flashbacks: Asset Returns 3-10-24
Employment: Real Numbers vs. Fictitious Dystopian Hellscapes 3-9-24
Payroll Feb 2024: Record, Revisions, Reality 3-8-24
JOLTS Jan 2024: Holding at “High” Even if Well Down from the Peak 3-6-34
Inflation Gut Check Jan 2024: PCE Prices, Income, and Outlays Help the Story 2-29-24
4Q23 GDP: Second Estimate, Moving Parts 2-28-24
Durable Goods: Forced Landing 2-27-24
New Home Sales Jan 2024: Sales Steady, Prices Resilient but Softening 2-26-24
Existing Home Sales Jan 2024: High End Climbing, Low End Stagnant 2-22-24
BB vs. CCC: Quality Spread Differentials, Yield Relationships, Relative Returns 2-20-24
Housing Starts Jan 2024; Slow…Curve Ahead? 2-16-24
Industrial Production: Capacity Utilization Limps Along 2-15-24
Retail Sales Jan 2024: Balancing Act Continues 2-15-24
Jan 2024 CPI: The Big 5, Add-ons, and Favorite “CPI-ex” Indexes 2-13-24
Trade Flows 2023: Trade Partners, Imports/Exports, and Deficits in a Troubled World 2-10-24
Fed Funds vs. PCE Inflation: Peaks and Valleys Across Time 2-7-23
HY vs. IG: Quality Spread Differentials and Comparative Returns 2-6-24
BBB vs. BB: Revisiting the Speculative Grade Divide Differentials 2-5-24
Productivity: Takes the Edge off the 4% Handle YoY ECI 2-1-24