
New Home Sales Jan 2024: Sales Steady, Prices Resilient but Softening
Supply discipline and prudent working capital management brings a steady-as-she-goes profile to new home sales despite ugly mortgage rates.


The Jan 2024 new home sales held steady with low single digit growth with median sale prices higher sequentially but running below 2023 and 2022 annual numbers.
The Hi-Lo monthly band on sales prices across the tightening cycle are within a reasonably tight range considering the magnitude of the UST curve moves but that always comes with the asterisk of regional variations and price tier shifts.
The South region is the largest region by far but is seeing some sequential and YoY weakness in volume while the West is moving materially higher.
The monthly release shows a healthy pipeline of homes under construction for sale at the end of the period as well as completed homes for sale in a sign of sustained confidence on the part of builders.
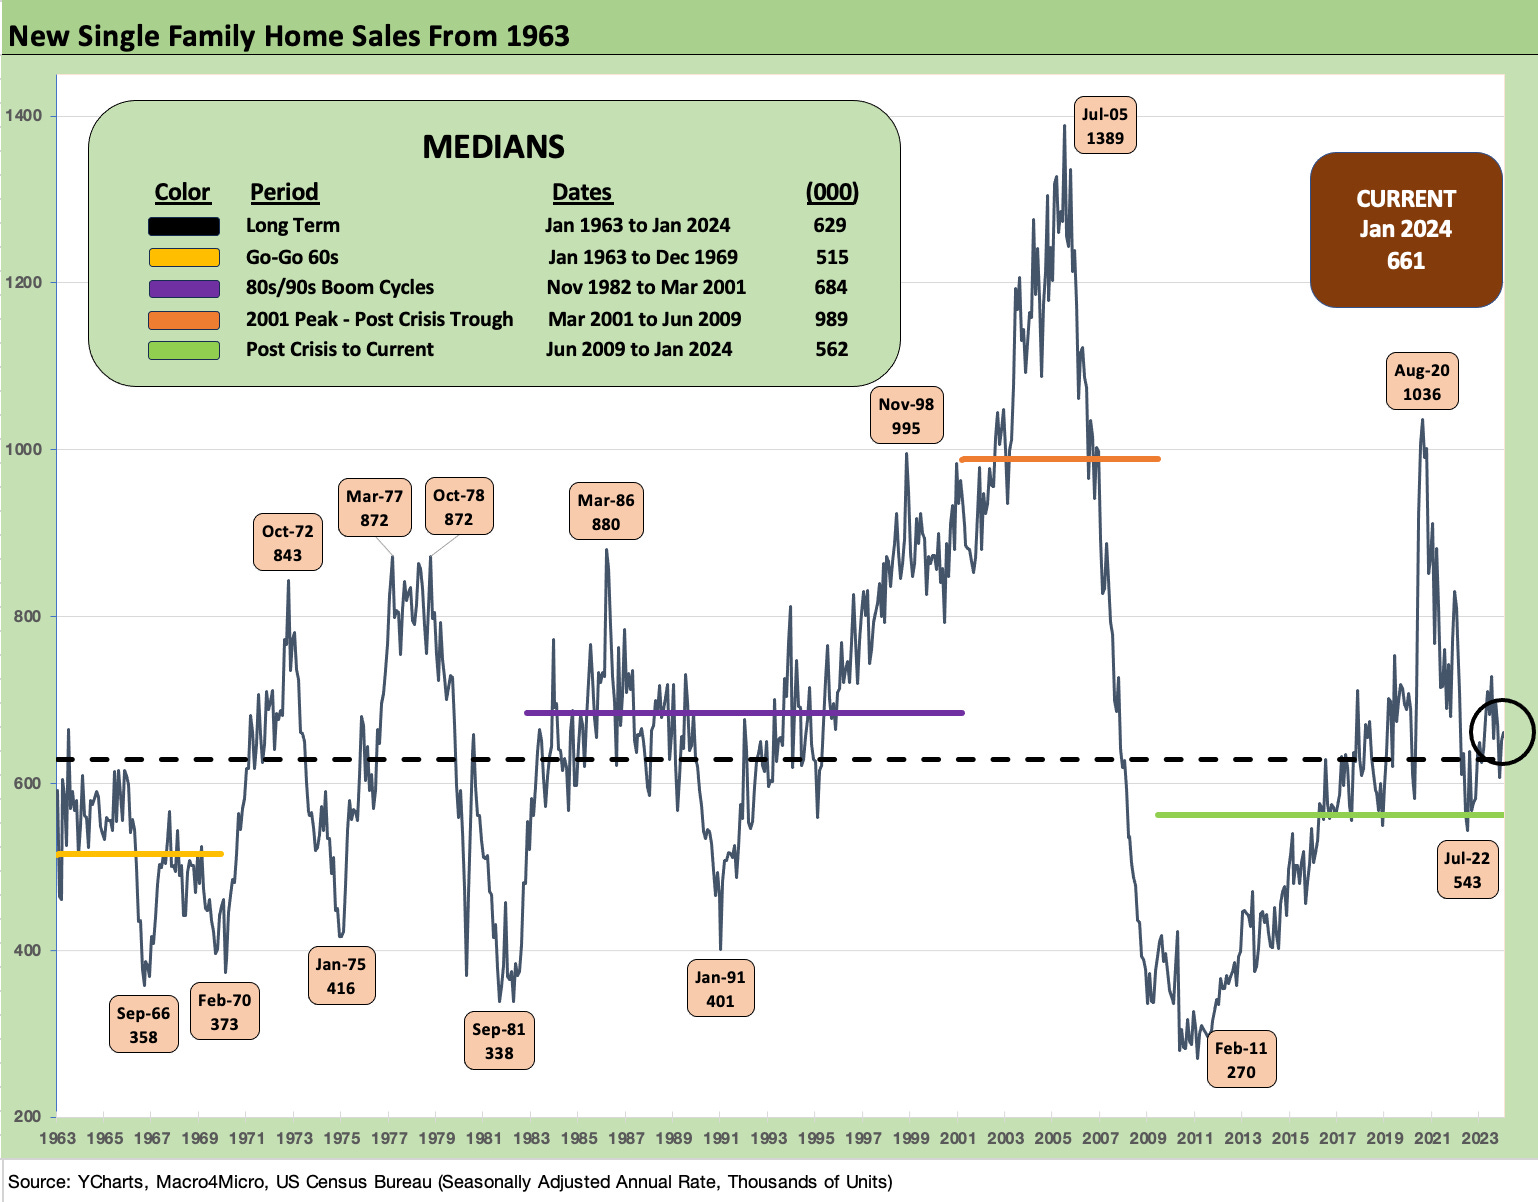
The above chart plots the time series for single family new homes across the decades and hammers home how intrinsically cyclical new home sales can be. New home sales is a sibling of housing starts and a first cousin of existing home sales, and we track all three each month in our research (see links at bottom). The dramatic swings of the housing bubble years (peak building year was 2005) and the spike during the 2020 COVID panic stand out in the timeline.
As broken out in the chart above, the current new homes sales run rates are above long-term medians but below the 1980s/1990s boom cycle and dramatically below the craziness of the housing bubble years. The Feb 2011 lows of 270K make a statement after a 1.4 million record peak in July 2005.
Jan 2024 posted a +1.5% increase in units sold during the period for the US sequentially and +1.8% YoY for the month. One interesting twist was that the South region was off substantially (-13.5% YoY, -15.6% MoM) and the West up impressively (+57%) YoY, +38.7% MoM). The smaller Midwest (-4.1% YoY, +7.7% MoM) and very small Northeast (+4.9% YoY, +72% MoM) were dwarfed by the action in the South and West. In terms of “for sale at end of period” on a not seasonally adjusted basis, the South is around 60% of the total and the West 24%.
The builders have been able to navigate this market in extraordinary fashion as we have covered each week in the asset return data with the exceptional equity return numbers generated by the Homebuilder ETF (XHB) in 2023 despite high mortgage rates (see Footnotes & Flashbacks: Asset Returns 1-1-24 ). We also look at a range of the major builders for more granular color (see links). In those notes, we offer some regional nuances and across price tiers at the builder level.
Sales volume trends by major region…
In the next two charts, we provide some history on the regional highs and lows as provided by the Census.
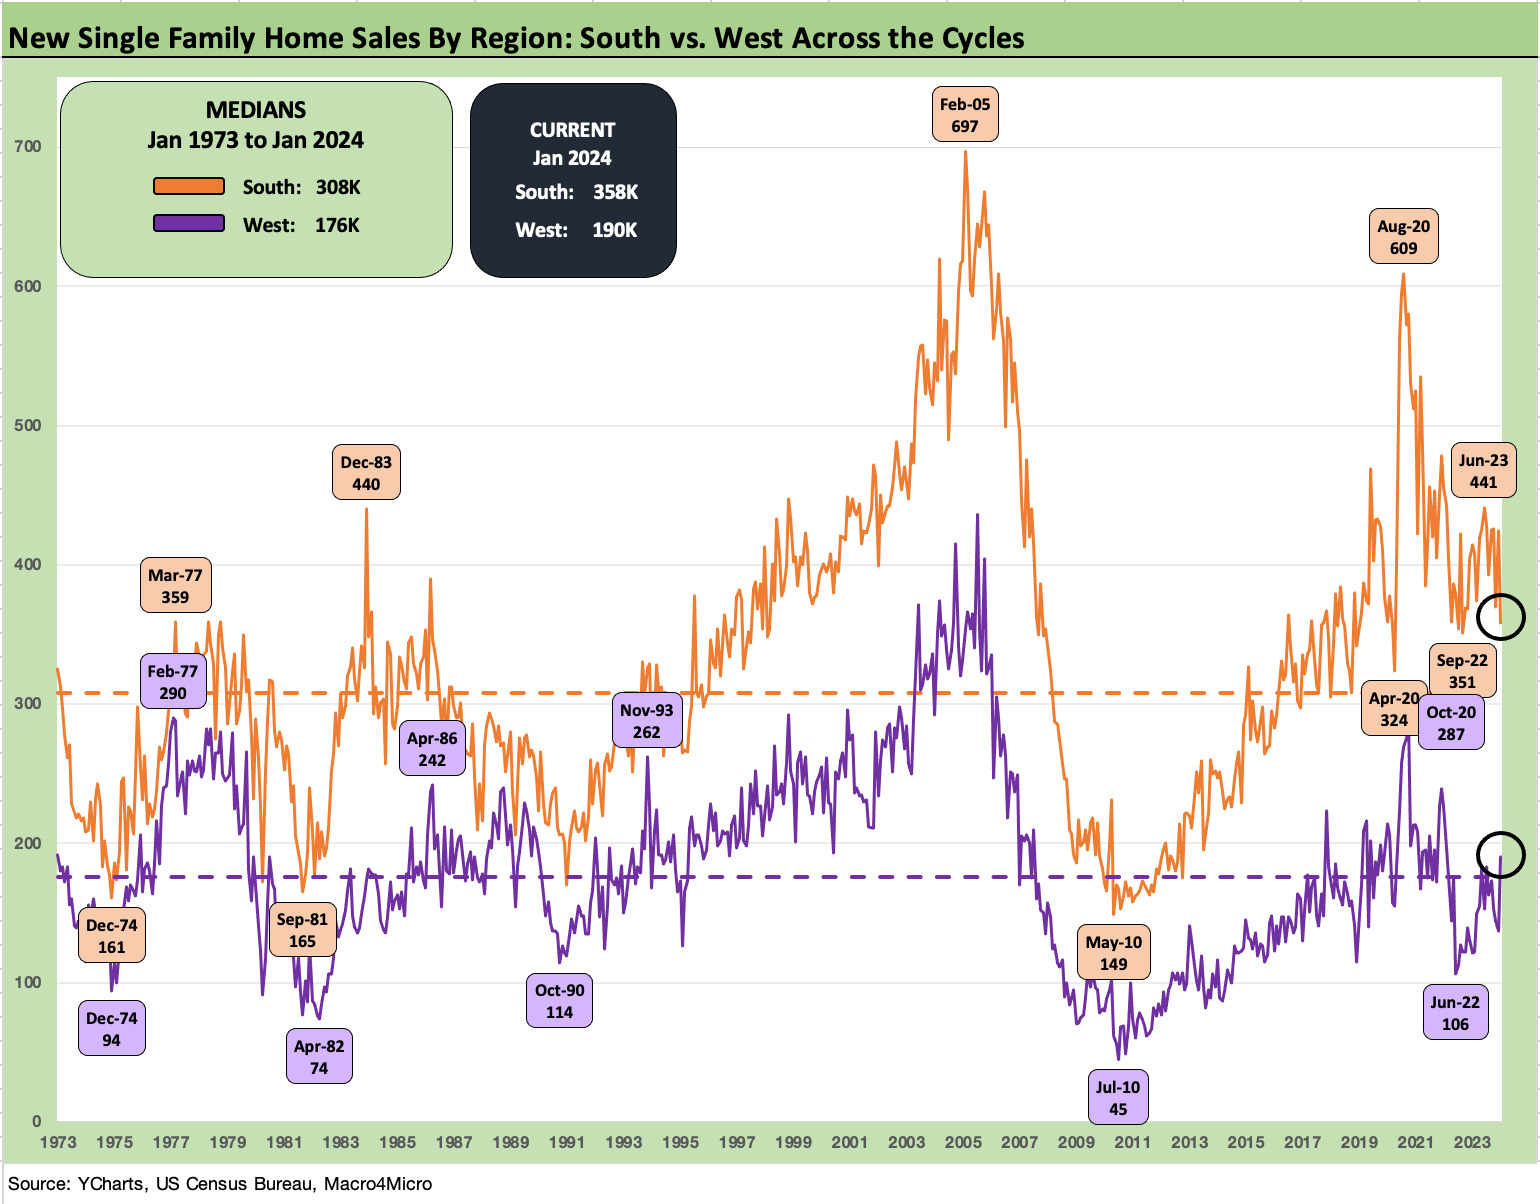
The above time series shows the South vs. the West. Those two regions include two of the “Top 10 nations” in the world with California and Texas. The South also includes the massive single family market of Florida.
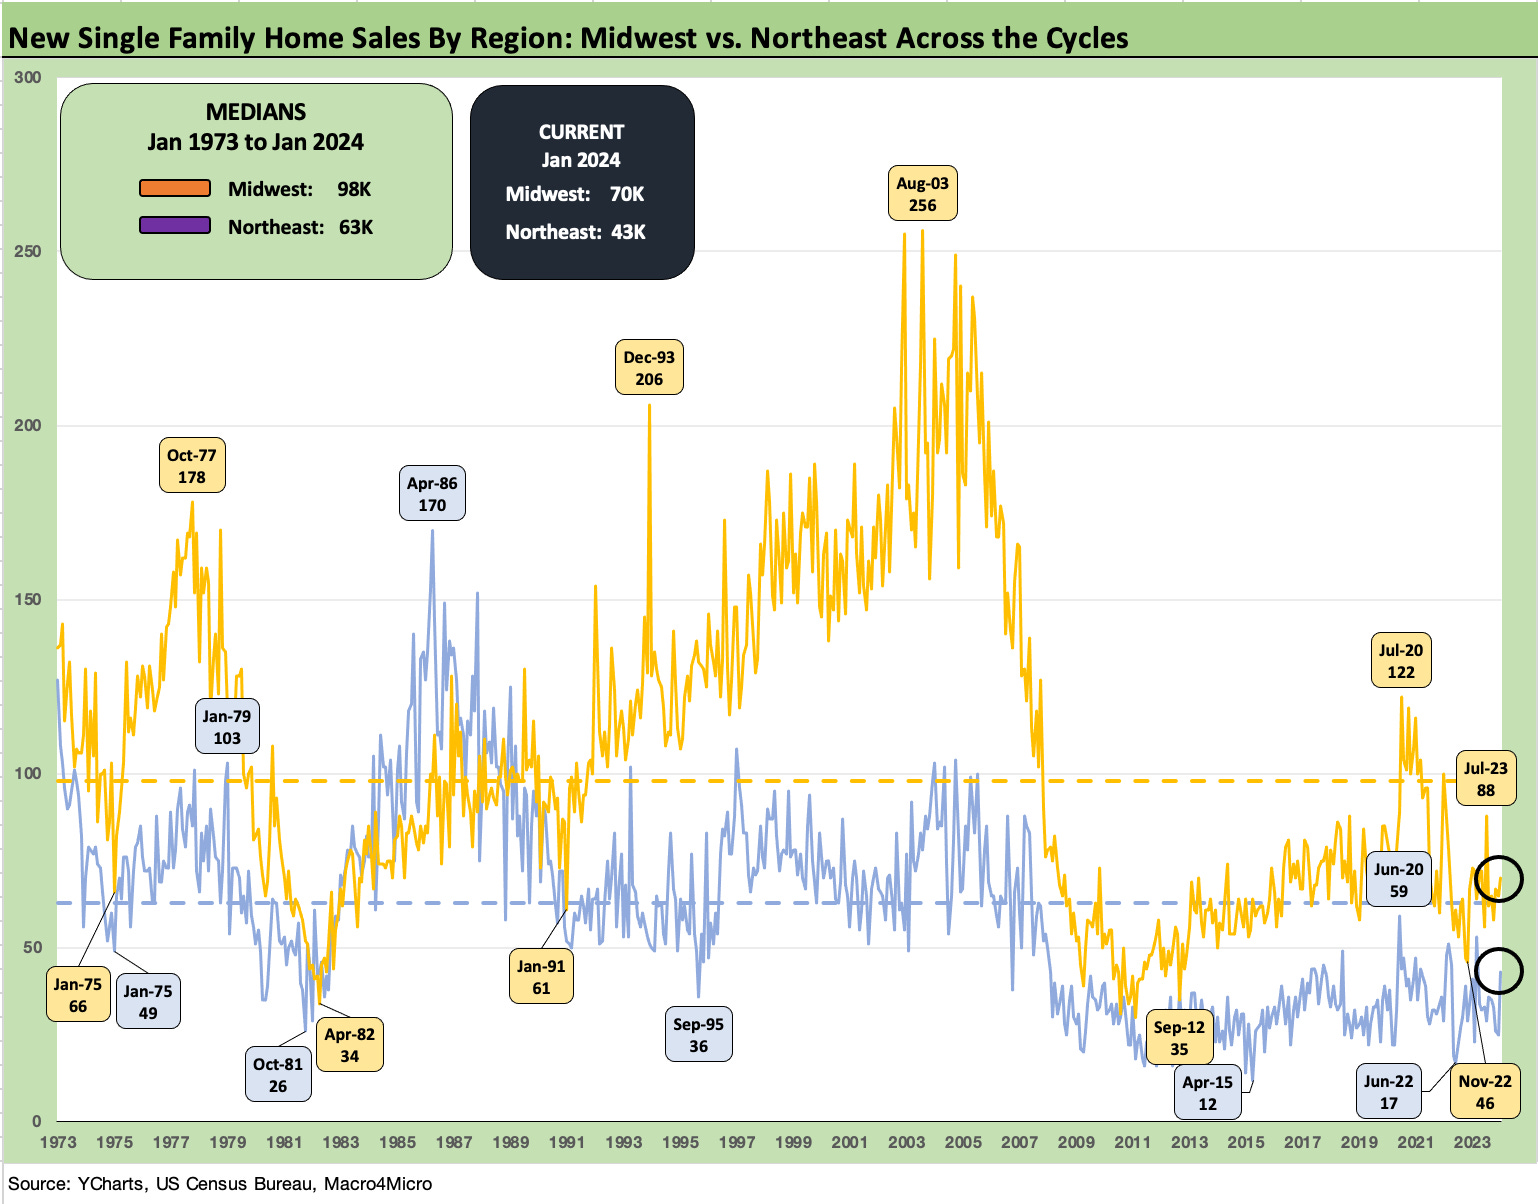
The above does the same exercise for the Midwest and the Northeast. The mature and densely populated Northeast and sections of the Midwest include a heavy dose of existing home suburban sprawl and multifamily cities.
New home market share of total home sales…
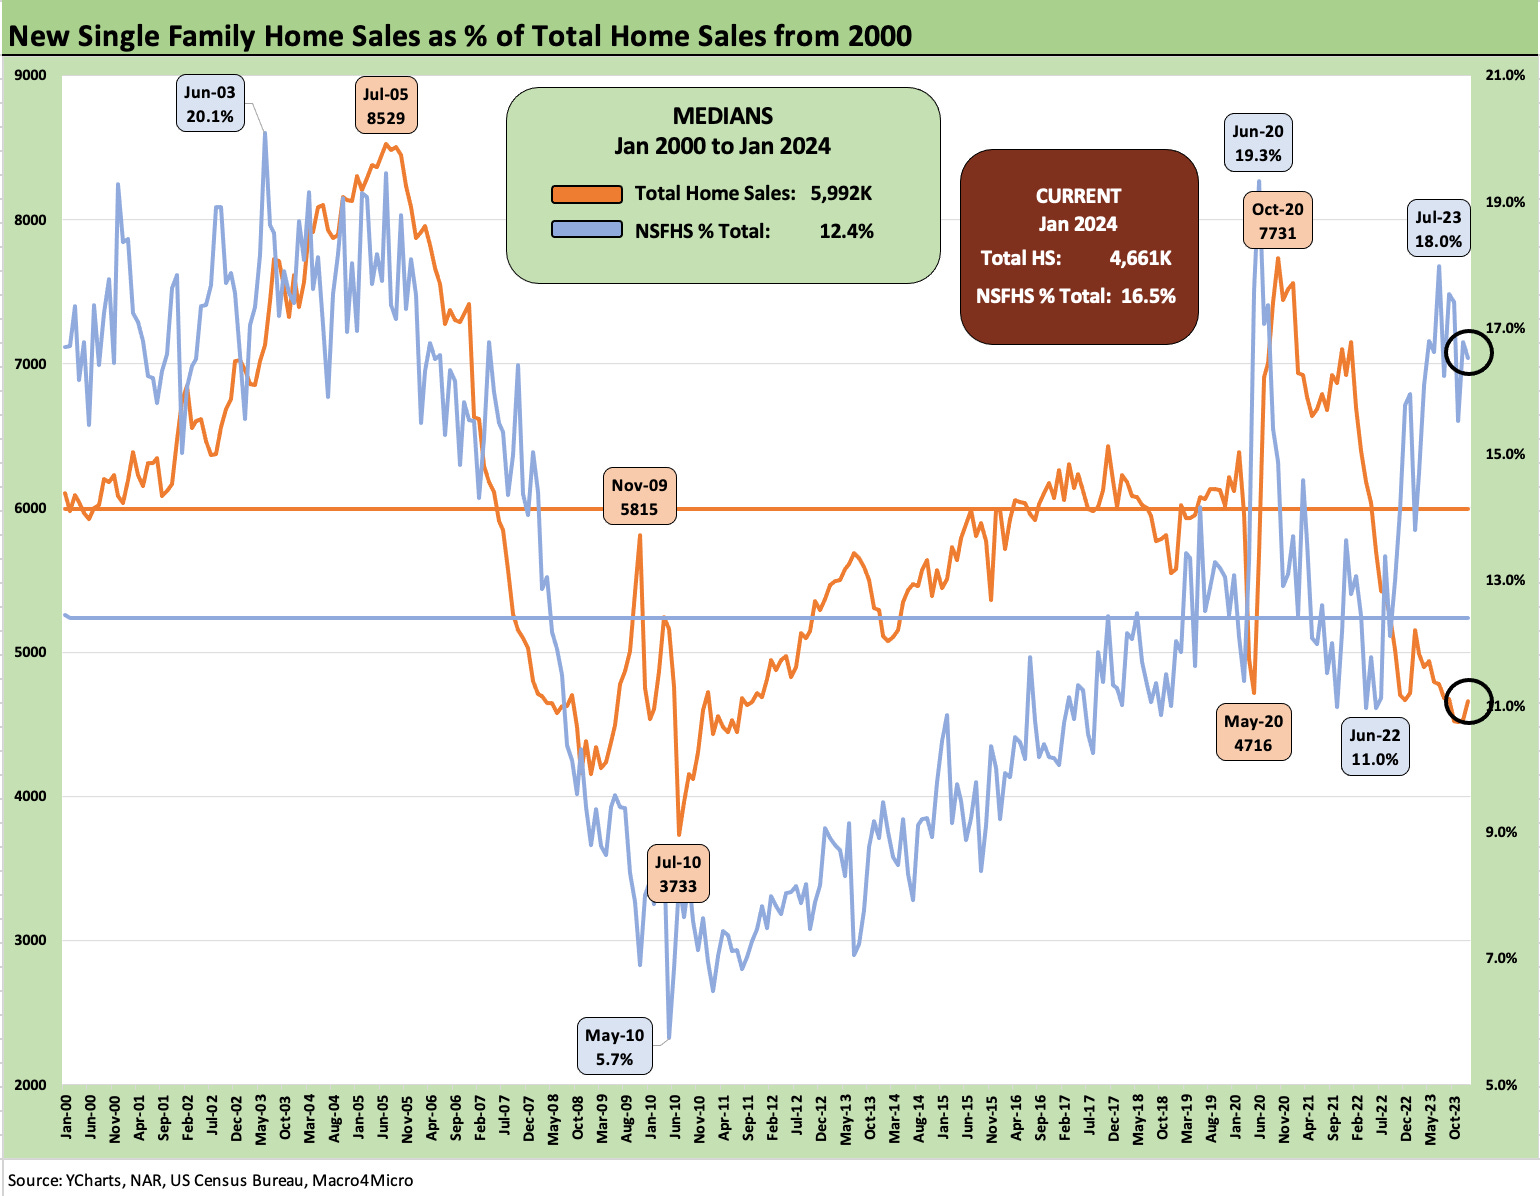
The above chart plots the share of total home sales (existing + new) held by new home sales. Existing home sales dominate the total unit sale numbers historically with the new home sales median share over the longer term typically only around 12%.
As we have covered in earlier pieces, the builders continue to pick up share with their ability to offer creative incentives ranging from fee relief to mortgage buydowns. The captive mortgage operations of the builders bring important advantages. The builders are also assured of product availability since they closely monitor their deliveries, pipelines, and community counts to coordinate starts with deliveries and demand across regions and price tiers.
The 16.5% share held by new home sales this month is well above the median of 12.4% but down sequentially from 17.6% last month. We saw some firming of existing home sales in the above median price range last month, but the inventory levels are still extremely tight (see Existing Home Sales Jan 2024: High End Climbing, Low End Stagnant 2-22-24).
New home price histories…
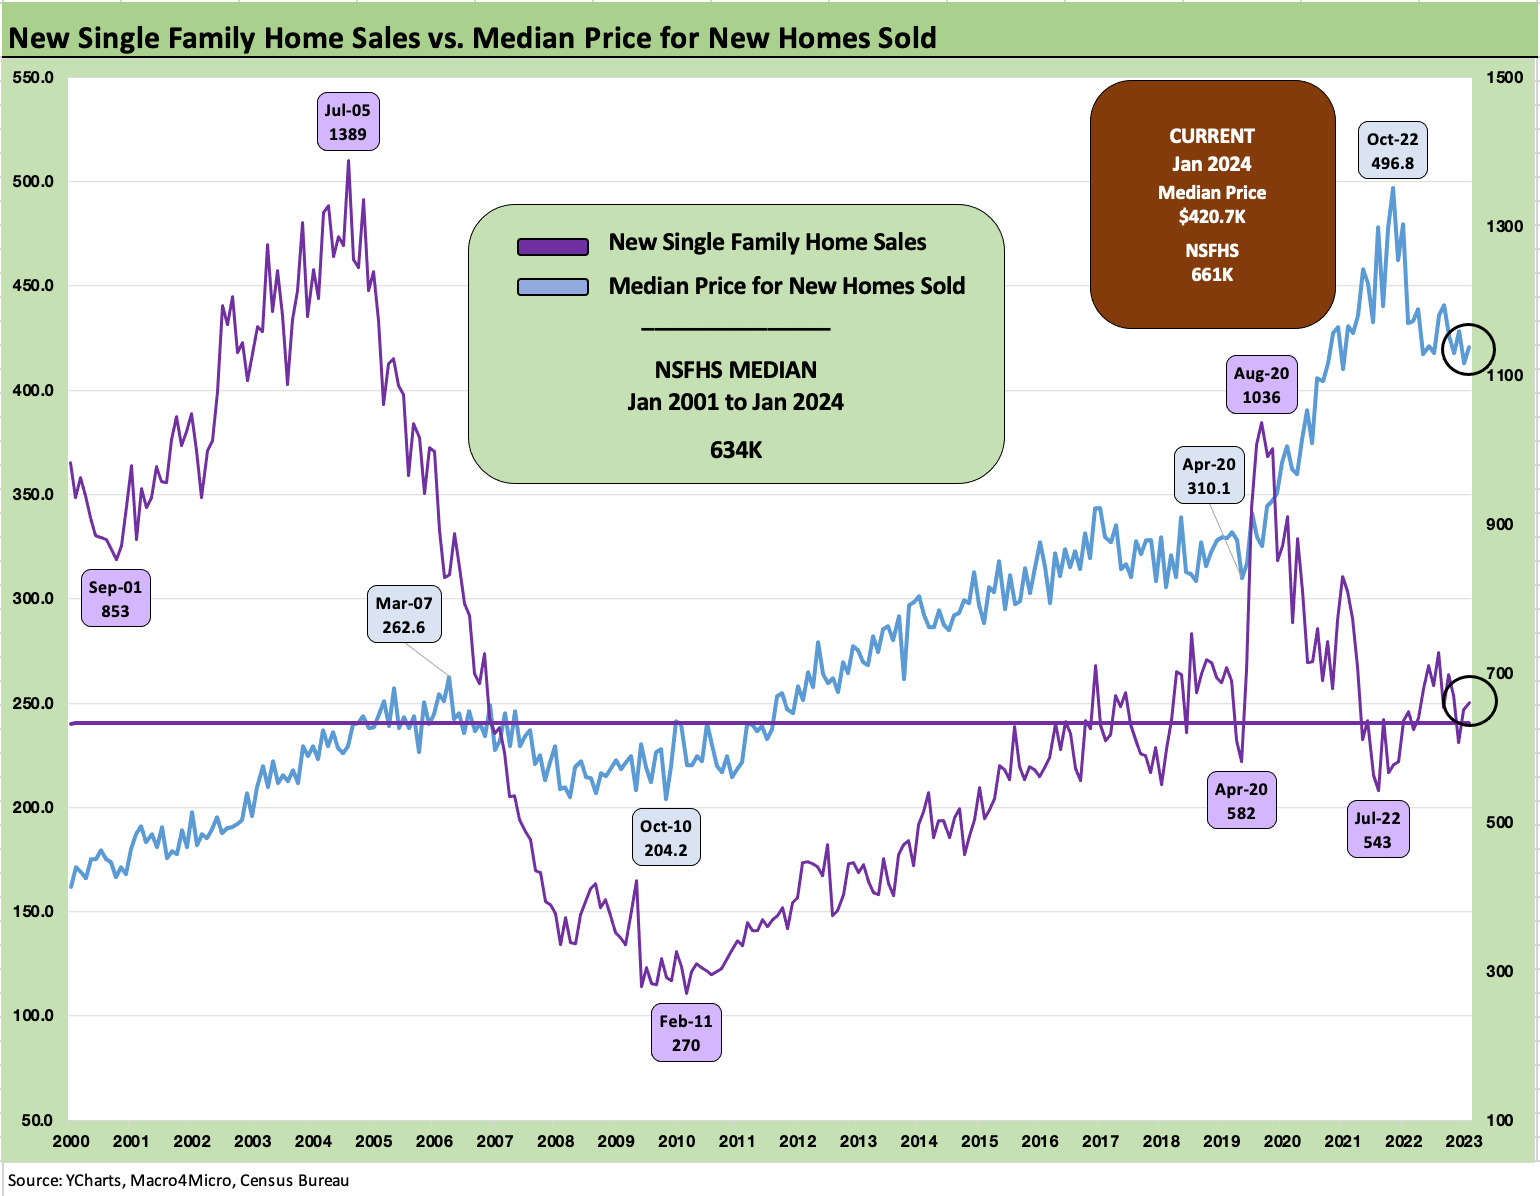
The above chart updates the time series for sales volumes vs. median prices in a two-sided chart with prices on the left and volumes on the right. The increase to a peak in Oct 2022 at $496.8 includes many homes that had been under contract before the spiking mortgage rates wreaked their full havoc on affordability.
We see a median volume of 634K from Jan 2001 across a market that includes the housing bubble, the housing sector crash and the COVID distortions that saw a “flight to the ‘burbs” effect as well as severe supplier chain disruptions for builders.
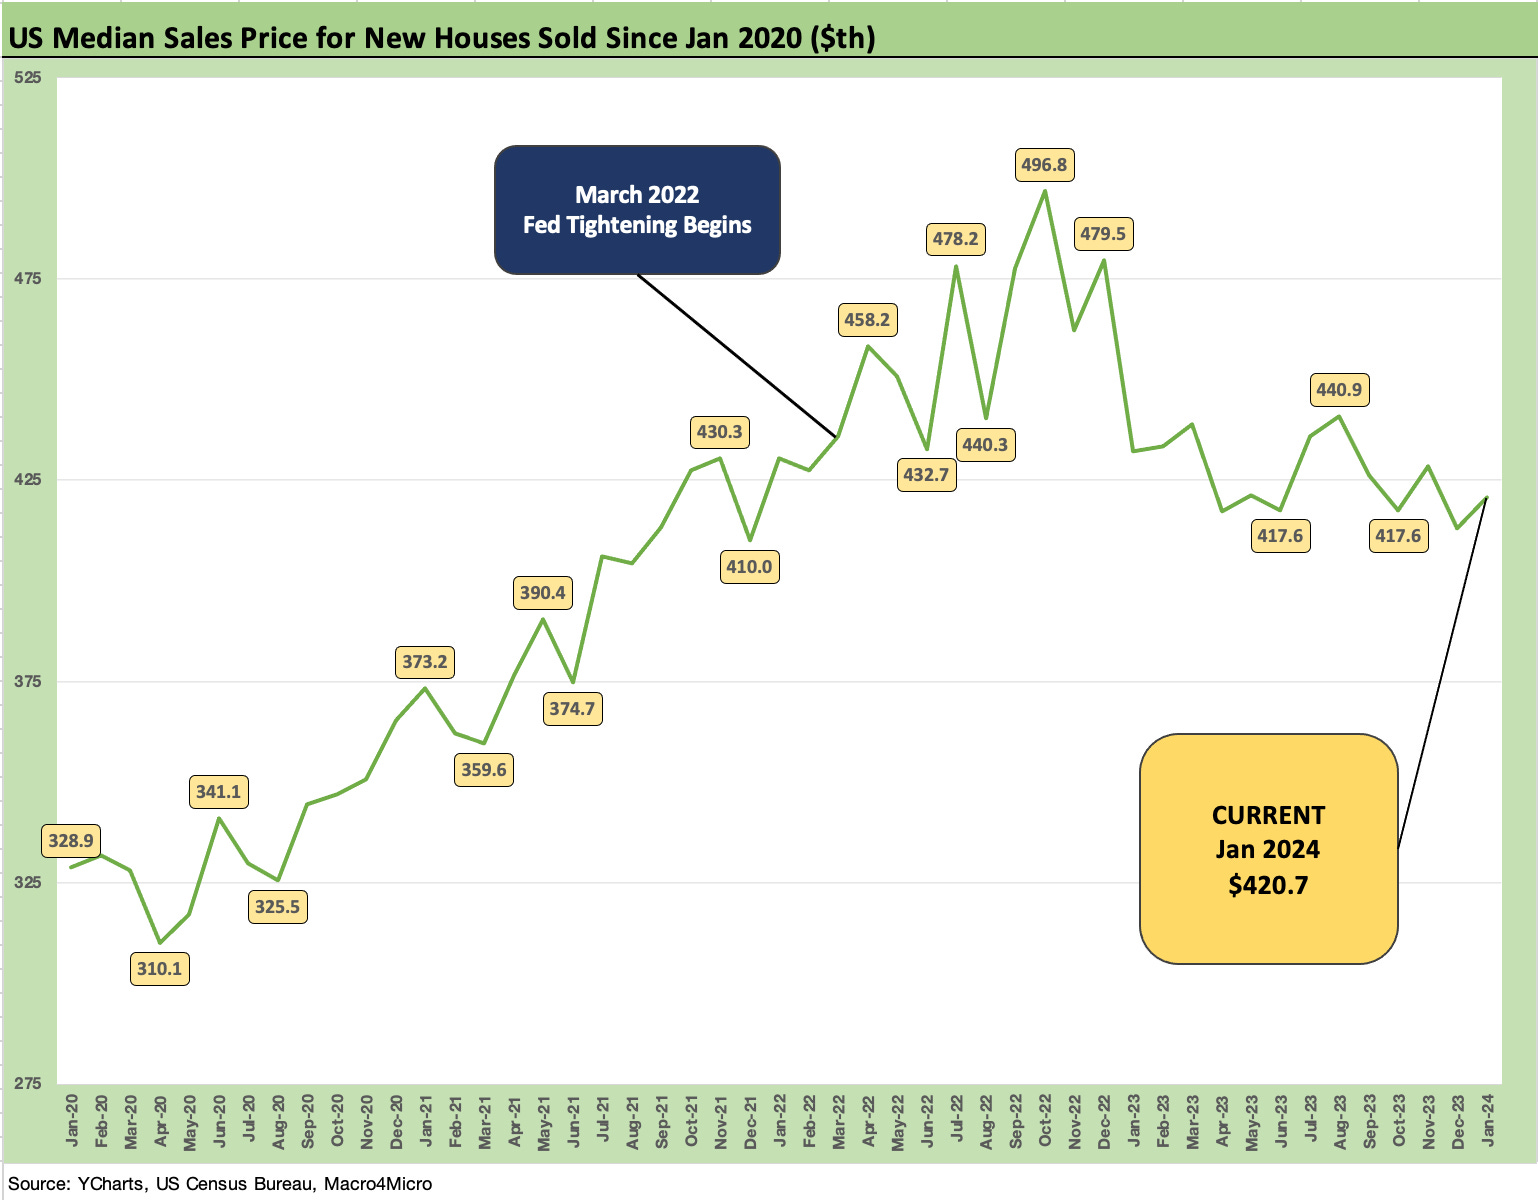
The above chart updates the shorter timeline for median prices from the start of 2020 through Jan 2024. Prices have stayed above $400K during the tightening cycle on the support from the light inventory in existing home sales and limitations on how fast the homebuilders were able to meet demand during COVID. We also see the effects of working capital discipline by the builders and measured land acquisition and development practices with a much heavier use of options on lots than seen in past cycles.
The builders learned the hard way during the bubble years, and the largest builders were more conservative in land investment by partially embracing the strategy utilized by NVR during the housing crisis and before then. NVR equity has been a home run stock over the cycles on its risk-mitigation approach to land investment and development. The result more broadly in the industry now is effective supply discipline on the builder side that is now supported by the golden handcuffs supply limits in existing home sales.
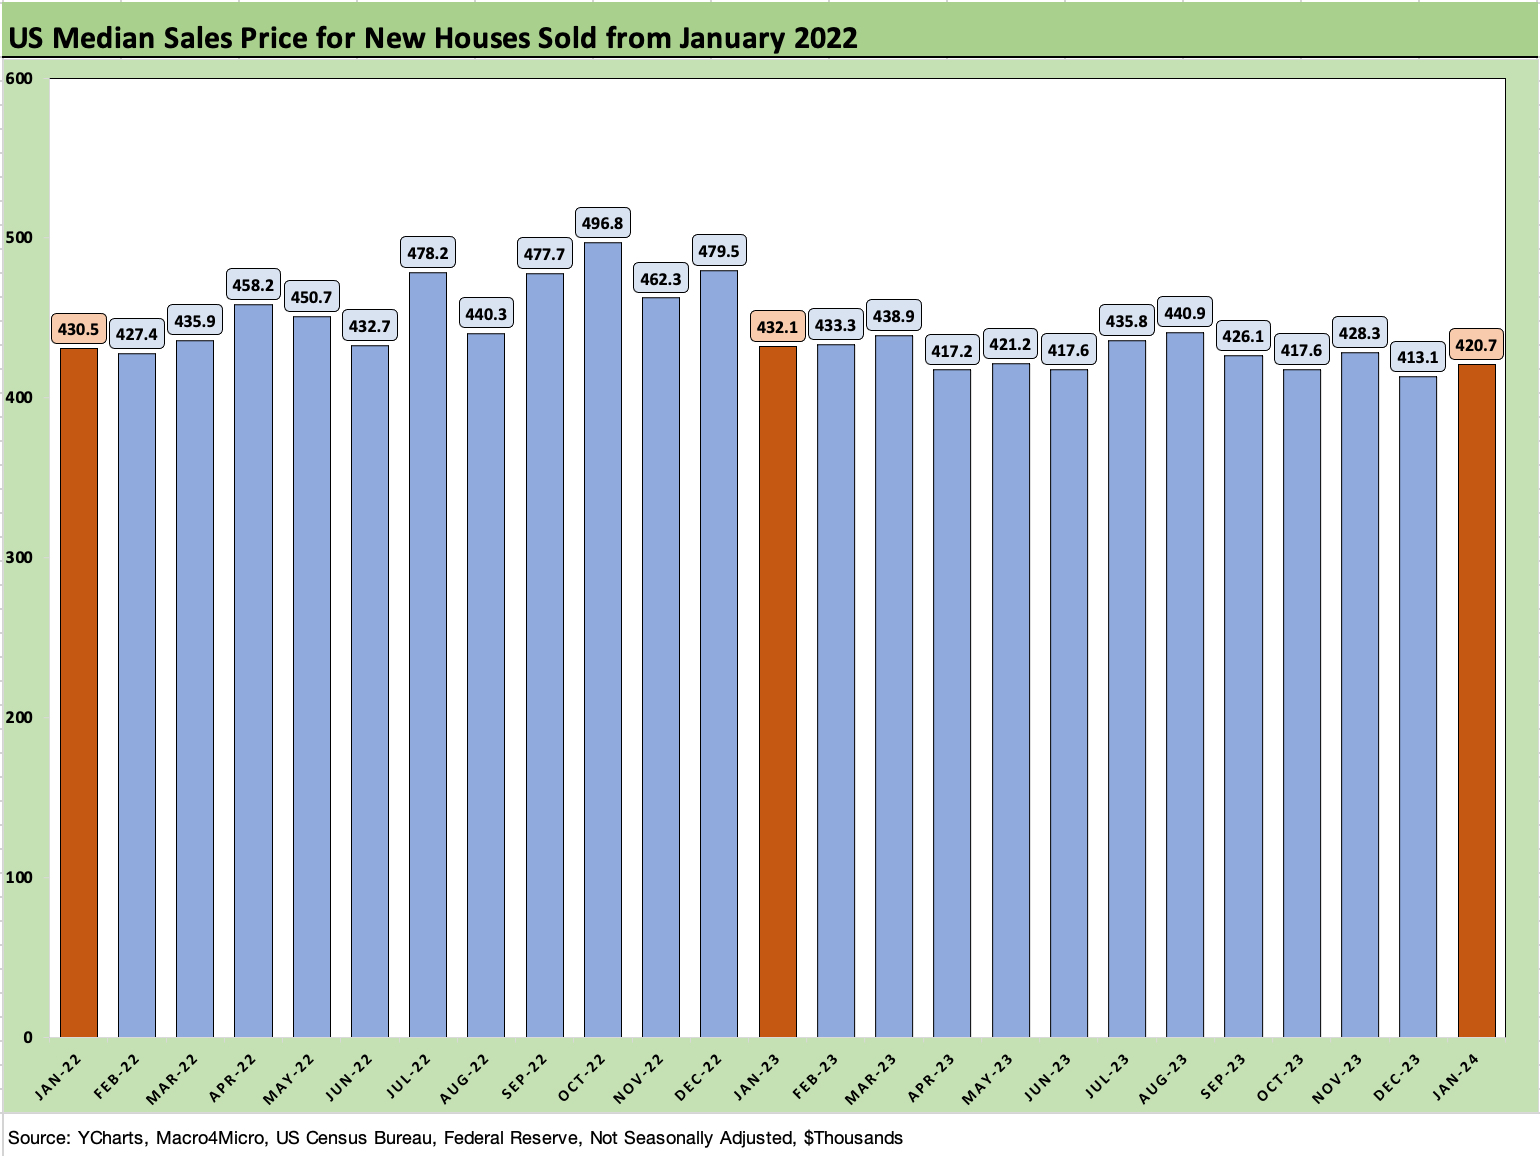
The above chart plots two years of monthly median sales prices for one more view. The median prices are a long way from the low $300K handles of early 2021.
See also:
Footnotes & Flashbacks: State of Yields 2-25-24
Existing Home Sales Jan 2024: High End Climbing, Low End Stagnant 2-22-24
Housing Starts Jan 2024; Slow…Curve Ahead? 2-16-24
D.R. Horton: Credit Stronger Even if Stock Takes a Step Back 1-29-24
KB Home: Wraps Industry Rebound Year, Exiting on Upswing 1-14-24
Lennar 4Q23:Buyer Buzz, Curve Support 12-15-23
Credit Crib Note: Lennar (LEN) 11-22-23
Pulte: Relative Value Meets “Old School” Coupons 11-15-23
Credit Crib Note: PulteGroup (PHM) 11-15-23
Anywhere and Real Estate Brokerage: Judgement Day 11-2-23
Credit Crib Notes: Toll Brothers (TOL) 9-11-23
Credit Crib Notes: D.R. Horton (DHI) 8-29-23
KB Home: Credit Profile 6-24-23
D.R. Horton: Credit Profile 4-4-23