
Retail Sales Jan 2024: Balancing Act Continues
Retail sales weigh in with some balancing variables to the downside in a calming effect on inflation jitters.


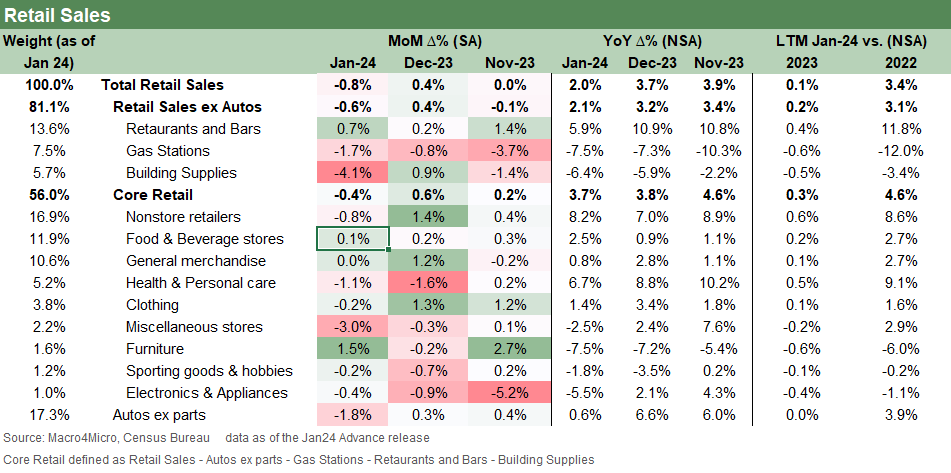
In the Yin and Yang of up and down news for econ releases, Yin decided to show up in retail sales for this month with a material miss to the downside for retail sales MoM with negative numbers across multiple cuts of the retail sales data.
The -0.8% was materially below the consensus for -0.3% while ex-Autos and Core were also underwhelming and negative and much worse sequentially.
With initial claims today still showing a low 200K handle (212K), the leading indicators for payroll numbers are a long way from trouble, but the market is looking for signs that the consumer is getting defensive or realizing they need to start paying down their credit cards.
Industrial production and capacity utilization also weighed in today with soft numbers as we cover in a separate commentary, but the main takeaway is evident.
Under the dilemma of “one man’s Yin is another man’s Yang,” we see the 10Y UST slightly lower (almost -3 bps as we go to print) but the weak retail numbers were not enough to offset the lingering effects of job adds and CPI. We suspect that a more robust retail sales number would have hurt UST materially more than this one helped with sensitivity high around inflation.
If you believe a job and wage growth are two important ingredients in the propensity to consume, then the consumer has had a reason to stay in the game with PCE being the main anchor to the soft landing and no landing story lines. Then there is the reality of consumer balance sheets and what the credit card bill might be telling the consumer each month in a world of elevated rates. Consumer credit quality is weakening, and that has to flow into behavior patterns at some point.
The large and important nonstore retailers bucket was soft sequentially, but the YoY numbers cannot be ignored. Restaurants and bars stayed busy while a few of the middle-tier categories in the chart, with weightings from 10% down, were generally static or slightly negative. That was basically the case last month but with Dec 2023 a bit firmer in that mix for General Merchandise and Clothing.
To date, the monthly consumption numbers have remained solid (see PCE Release Dec 2023: Consumption Strong, Inflation Favorable 1-26-24). We saw the UST curve rattled as recently as Sept 2023 by the retail sales release. Among recent “anxiety catalysts” for inflation and UST bulls were jobs (see Payroll Jan 2024: Big Swing 2-2-24) and CPI (see Jan 2024 CPI: The Big 5, Add-Ons, and Favorite “CPI-ex” Indexes 2-13-24).
The retail sales number added a reason to avoid getting too panicky despite cuts being off the table for the next two (or more?) FOMC meetings, after a constructive 1Q24 earnings season, a big jobs surprise to the upside, and ongoing signs of sticky services inflation. The current FOMC gang does not want to get dropped into the hall of shame/house of pain with Arthur Burns in a grim 1970s flashback (see Fed Funds vs. PCE Inflation: Peaks and Valleys Across Time 2-7-24). The embraced conviction in the market is that once they start cutting, the Fed cannot accept the risk of a backtrack.
A return of optimism around near-term fed funds cuts will take more than retail sales and soft industrial production (and capacity utilization). Perhaps PPI will help the UST bulls again tomorrow, but a constructive earnings season provides more important sea level support to the economic handicapping that cannot be ignored.
We tend to favor payroll and corporate earnings and guidance color more than retail sales. PCE and Income and Outlays at month end (next release on leap year Feb 29) are always high on the priority list, and FOMC minutes next week after the holiday will hold some clues on what is going on “in the room where it happens.”

The above chart gives some timeline perspective to what the -0.8% means when looking back across the hot markets of 2021 and the tightening cycle pain of 2022 that led to so many bearish calls on cyclical life expectancy. Late 2022 and early 2023 shared some similarities with this month’s numbers. We saw an unusual swing higher last year in Jan 2023.

The above chart updates the ex-autos and gasoline time series. The negative number from Yin still leaves Yang in the lead with a positive consumer story line until more releases prove otherwise or jobs actually start to go down. The low initial claims are still wildly below what is needed to rattle payroll counts (see Employment: What 200K Handles on Initial Claims Means (Not Much) 12-16-23). Sentiment indicators are also still waiting for more signals (see Consumer Sentiment: Multiple Personalities 1-19-24). We will get some more hints on that front tomorrow and at the start of March.
 |
|