
Existing Home Sales Jan 2024: High End Climbing, Low End Stagnant
The higher price tiers saw solid double-digit YoY growth above the $500K level but with overall inventory still low and mortgage rates rising.


January 2024 existing home sales stays in the zone of depressed inventory levels that continue to support resilient median prices on supply-demand imbalances.
Jan 2024 did add some silver linings in an otherwise dismal market for existing home fundamentals as the 4 highest of the 6 price tiers posted YoY increases with the largest tier ($250 to $500K at 44% of total sales) up just under 5% while the 3 high-price tiers above that rose by double digits.
The value of easier volume comps YoY cannot be ignored, but the news also came on a day when Freddie Mac posted another increase in its benchmark rate to 6.94%, up from 6.77% last week and up YoY from 6.5% in Feb 2023.
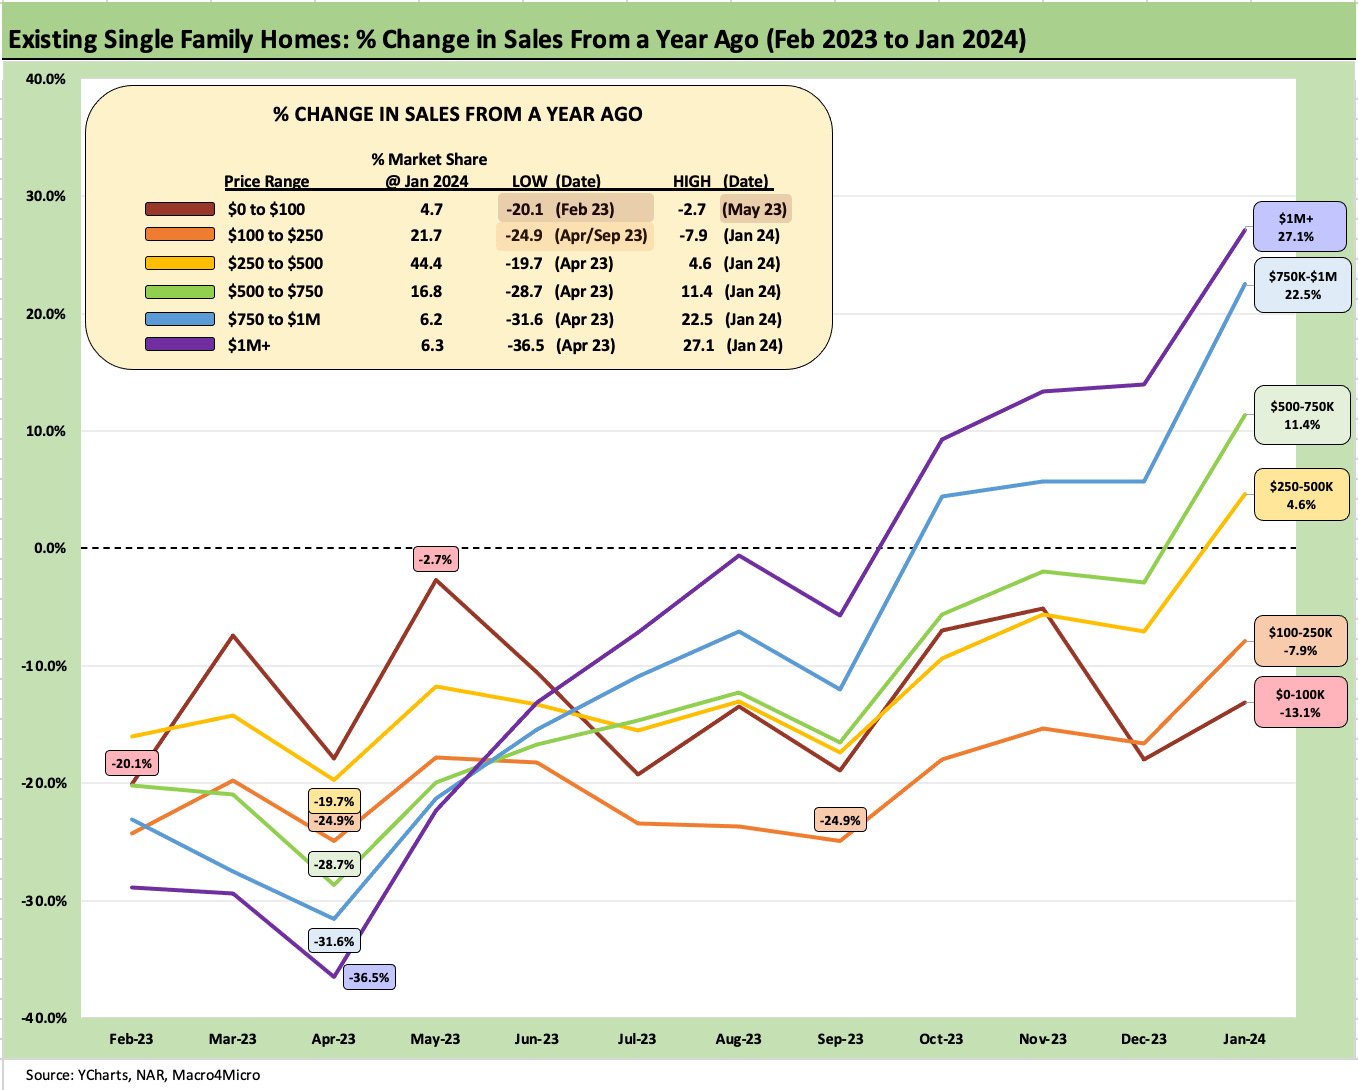
The above chart details the running YoY sales deltas in % terms that are provided each month by the NAR across the price tiers (the most recent month is provided at the end of this commentary). The favorable trend line is clear enough as the market partially adjusts to the new normal of “no more ZIRP” and the reality of higher mortgage rates.
The chart shows the lower price tiers still struggling, and that is logical considering that is the price range more likely to be squeezed by mortgage rates. The willingness to wait could be a simple financial decision. The question around where mortgage rates will level out and the toll that will be taken on affordability is still a work in progress for the existing home seller and potential home buyer.
The sellers need to consider how long the golden handcuff effect will hold them back and what their expectations are on the other side. Meanwhile, the buyer has a laundry list of factors with confidence in the economy, downpayment cushions, confidence in job security and “how much house” he is willing to buy with his dollar. If rates drop rapidly, the buyer can always do some down payment math on his next refi, monthly payment deltas, and related fees.
If the seller waits for the perfect backdrop, that may conflict with more immediate priorities. The rate backdrop has not been friendly to those who have waited and the risk of downside in home prices cannot be ruled out on their home. Lower rates can be a double-edged sword since they can come alongside recession scenarios.
For the seller, other life issues or economic decisions can come into play (relocation, considering a “move-up” trade, college tuitions, weddings, and the other realities of death and divorce, etc.). I remember being on a roadshow in the late 1980s with the CFO of Countrywide and someone asked him, “What if no one wants a mortgage?” He then proceeded to rattle off a list like that with more demographic details.
In other words, a lot of variables factor into a personal and financial decision on pulling the trigger on a sale.
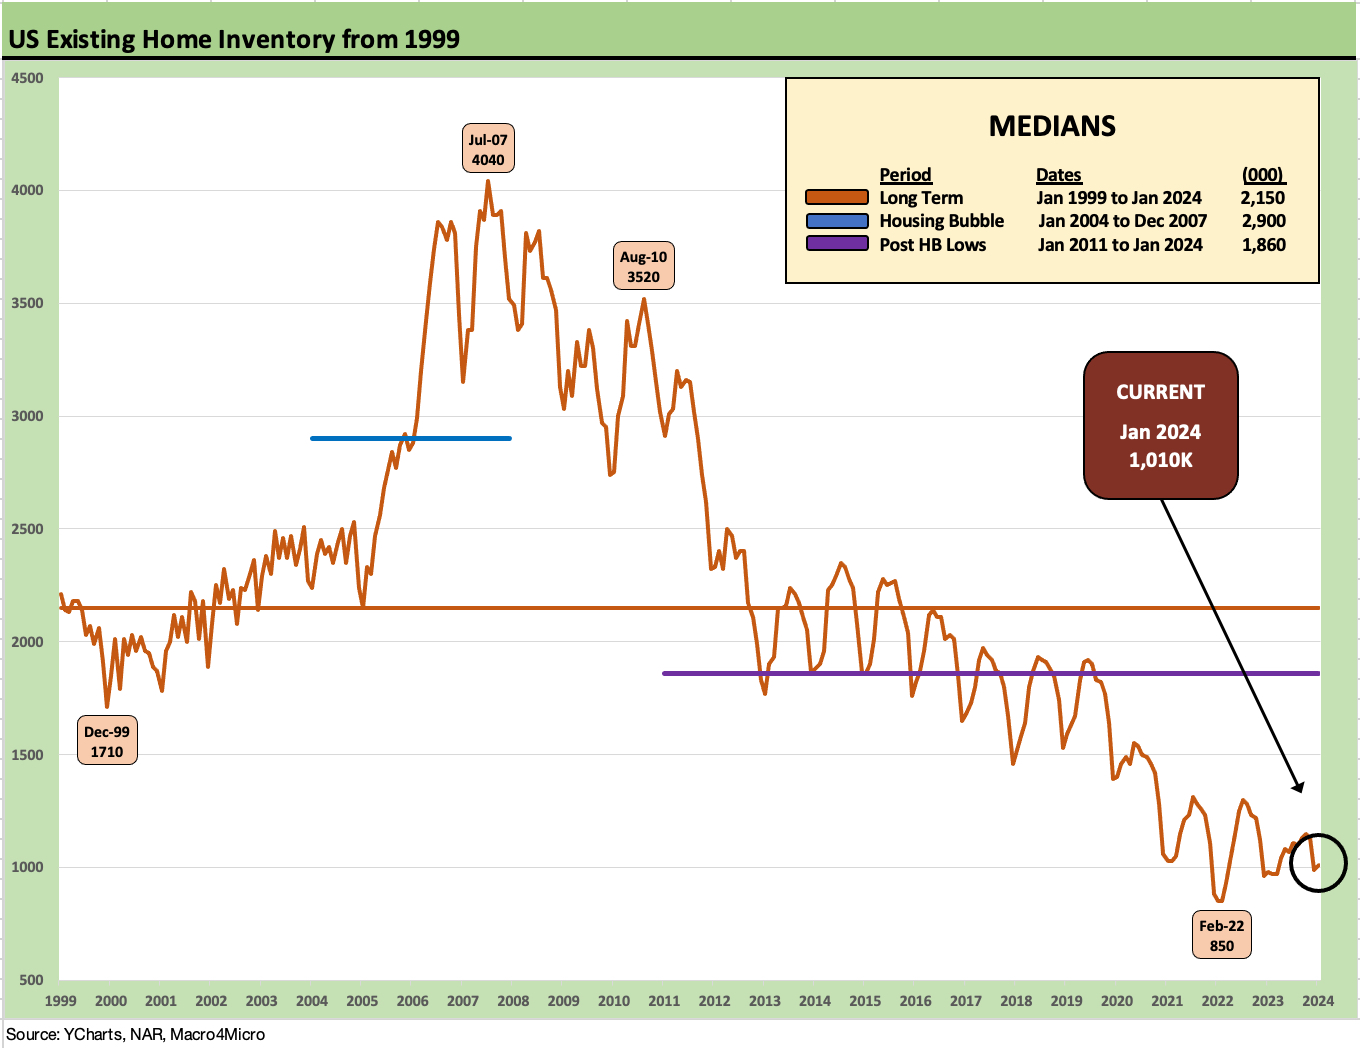
The above chart plots the timeline for total inventory with levels remaining mired in the low end of the historical range even if it ticked up by 2.0% sequentially and +3.1% from Jan 2023. The home mix nuances by tier and region complicate the conclusion on MoM trends, but it is quite safe to term this level as “very low.”
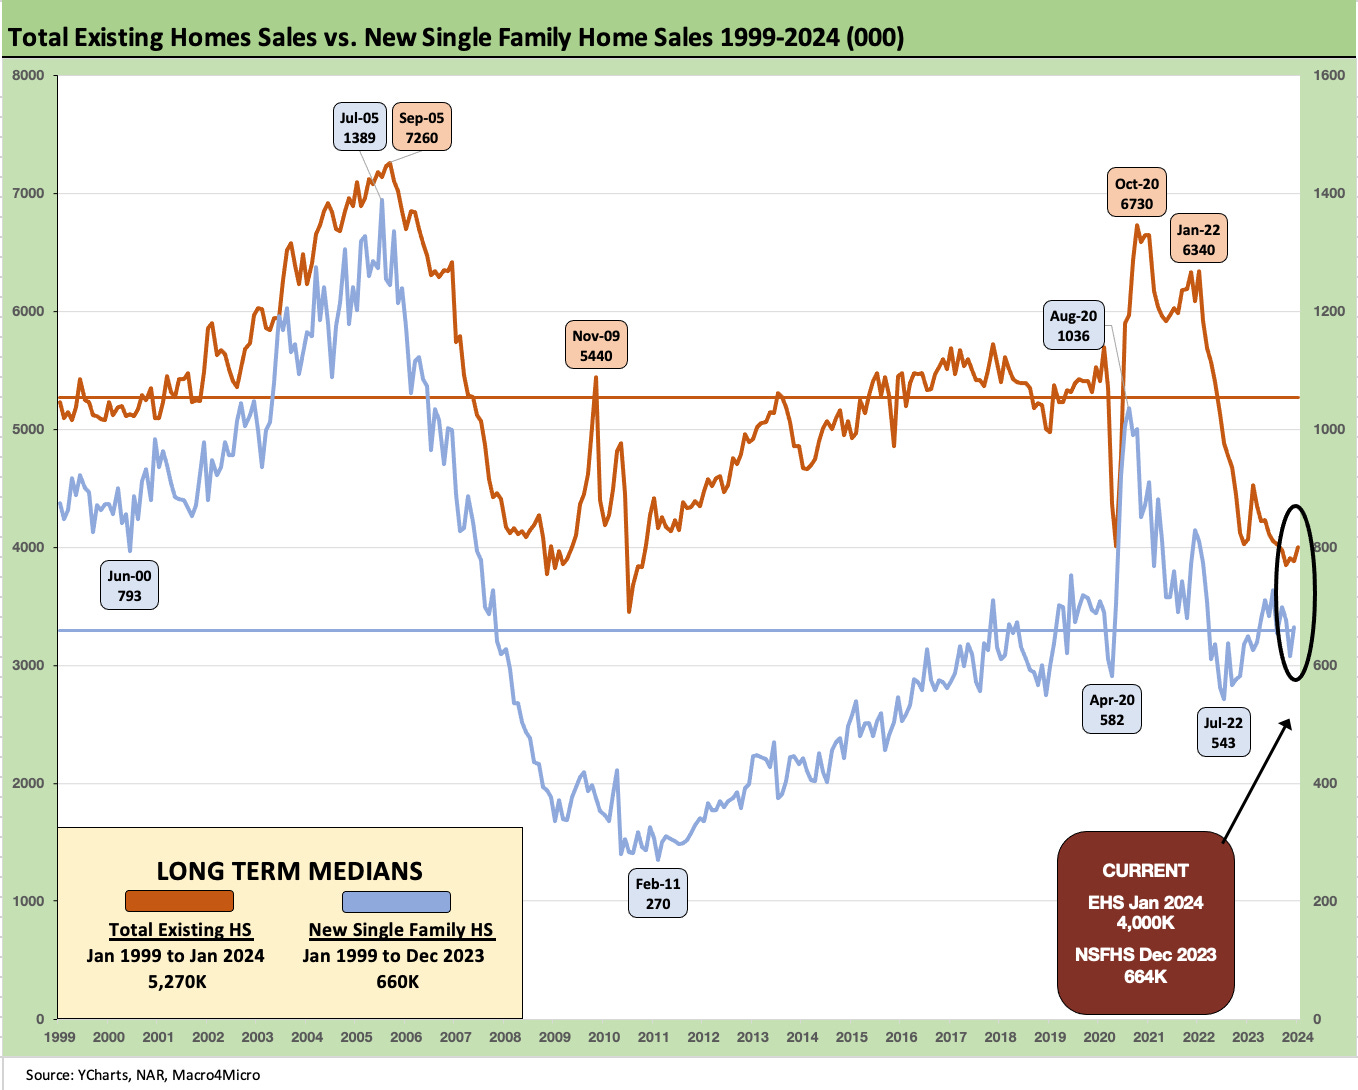
The above chart updates the “total existing home sales vs. new single family home sales” timeline, with builders still picking up an impressive slice of share in 2023 and into the new year in historical context. We will update the market share of total home sales for Jan 2024 after the new home sales release next week, but the basic theme that the builders can continue to capture share relative to history remains very much in place (see New Home Sales Dec 2023: Endurance Counts 1-26-24).
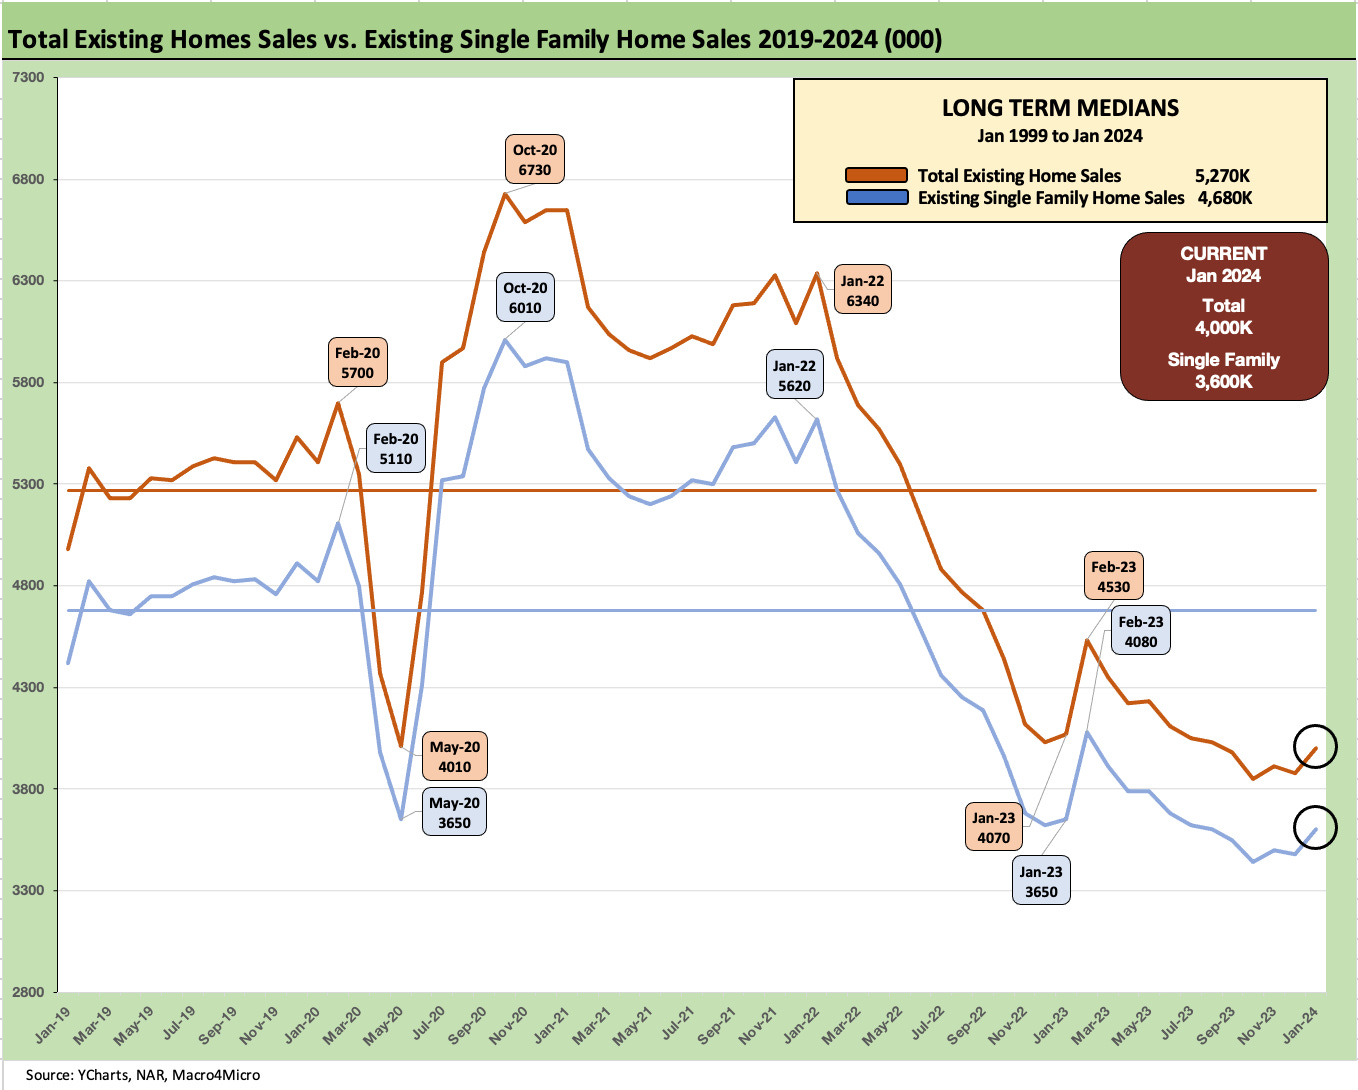
The above chart breaks out the timeline for single family alone vs. total existing. The lower line is ex-condo and co-ops. Single family home sales ran at 3.6 million for the month with 400K in condos and co-ops. The single family supply is running at 3.0 months and condo/co-ops at 3.6 months.
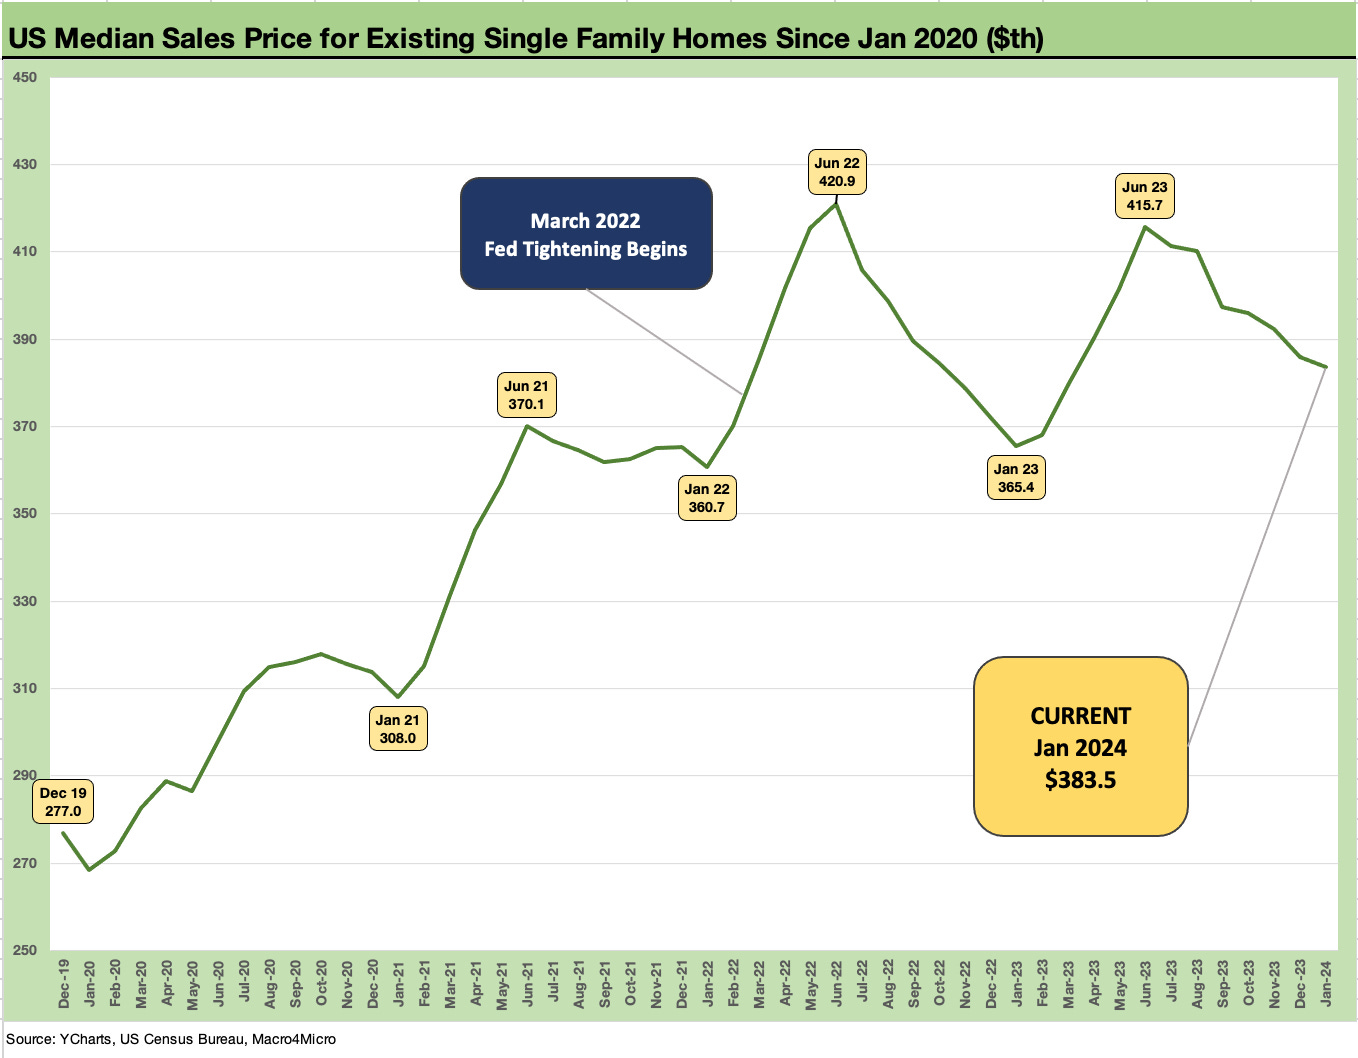
The above chart plots the single family median prices. We see a $383.5K which is up +5.0% YoY. That is down from the June high of $415.7K. We do not plot the total existing home series combined with condos/co-ops, but that came in at +5.1% at $379.1K with condos/co-ops alone at $339.4K or up +5.7%. The condo/co-op range is a wide one by region with the West on the high end at $478.9K median and the Midwest price at $232.2K.
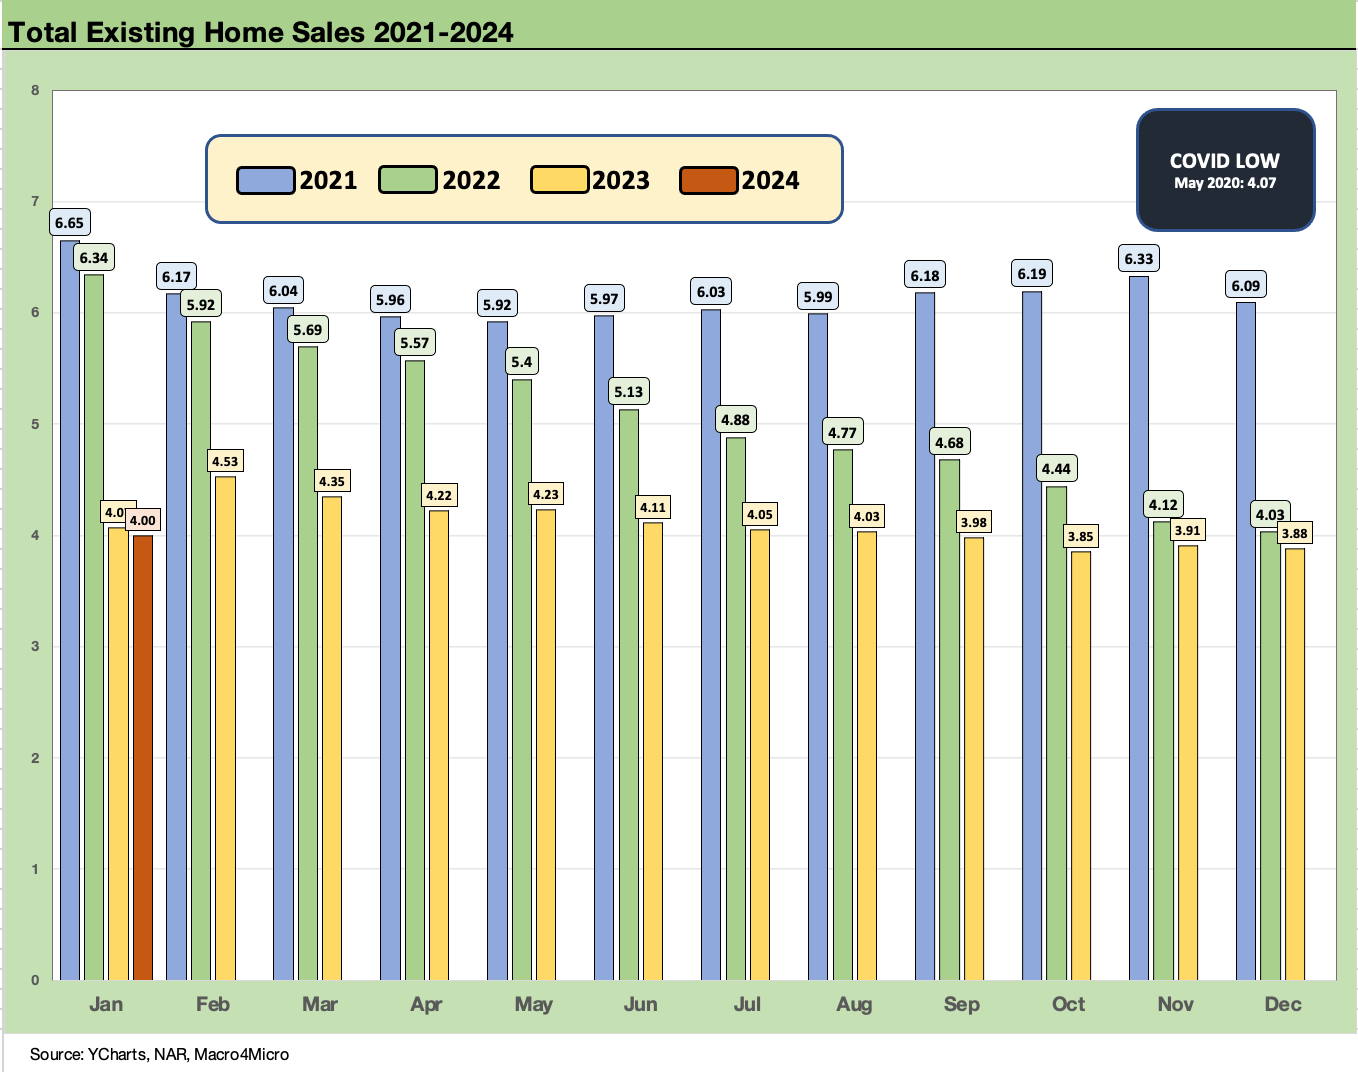
The above chart updates the running monthly sales volume for existing home sales since Jan 2021. The 4.0 million rate for Jan 2024 is up slightly from the multiyear lows below the 4.0 threshold across Sept 2023 to Dec 2023. As a reminder, the COVID low was 4.07 million in May 2020.
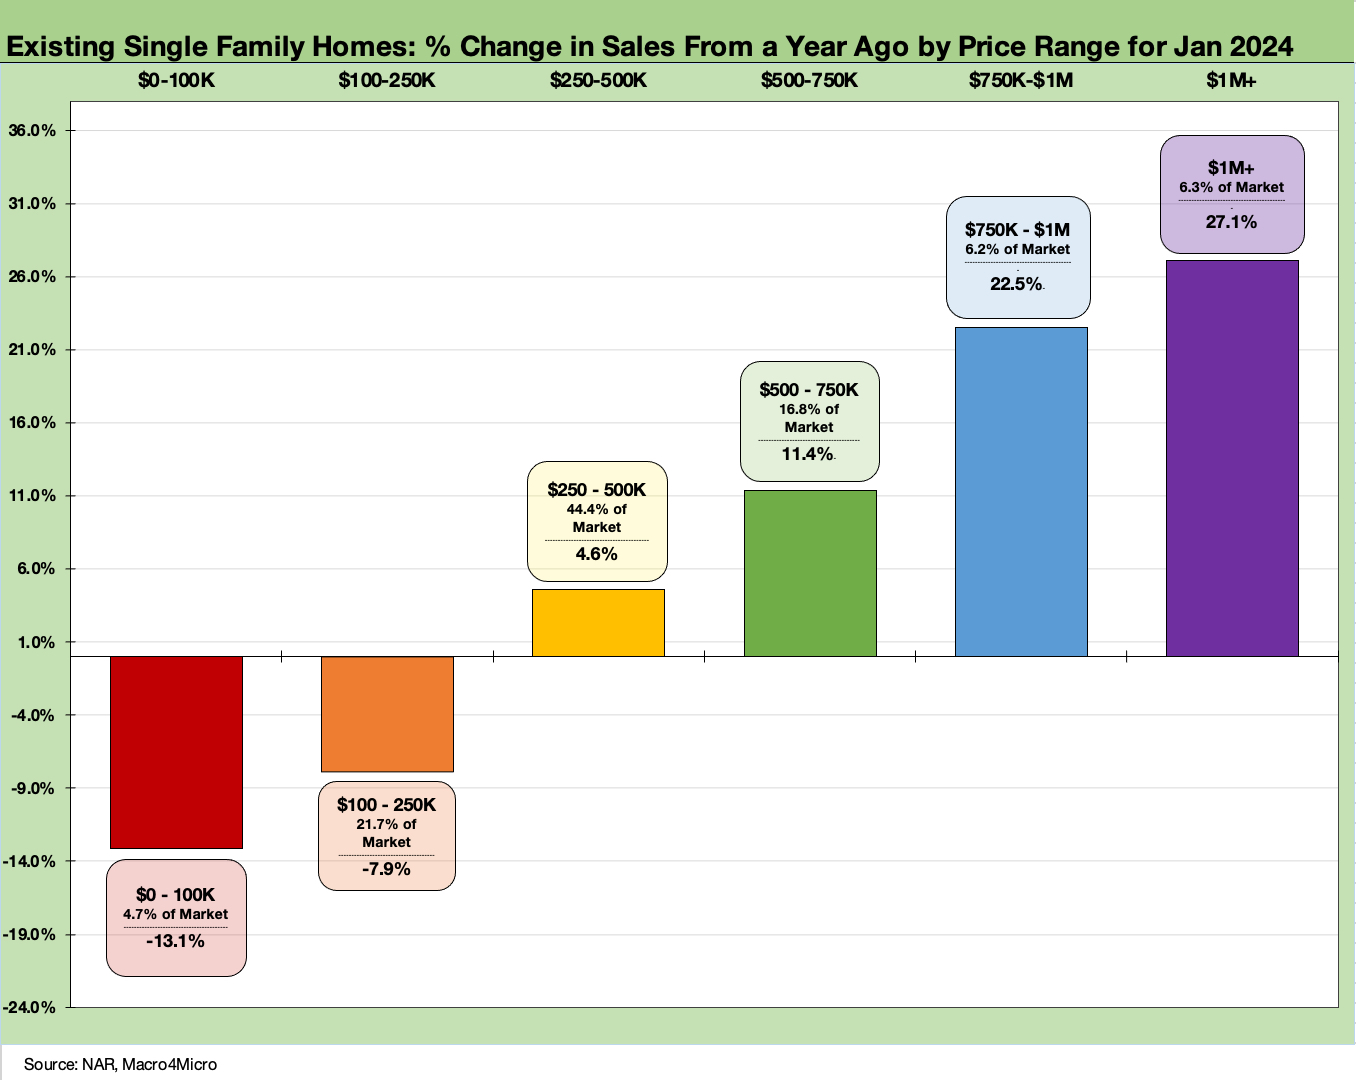
The above chart updates the YoY sales % change for the various price tiers as discussed at the top of the commentary. The biggest increase was in the million-plus tier at +27.1% followed by +22.5% for the $750K to $1 million band.
See also:
Housing Starts Jan 2024: Slow…Curve Ahead 2-16-24
New Home Sales Dec 2023: Endurance Counts 1-26-24
Existing Home Sales Dec 2023: Rerun of Multidecade Lows 1-19-24