
BBB vs. BB: Revisiting the Speculative Grade Divide Differentials
We track recent BB vs. BBB quality spread differentials across the tightening cycle back into double digits with a look at relative returns.


Quality spread compression is a fact of life at this point on high demand from BBB investors for quality BB tier names, so we give some historical context.
The strength of many major BB tier names across this post-COVID cycle has been helped by fundamental trends as well as higher demand.
Investors are handicapping how the refi-and-extension cycle plays out after a recent UST curve rally combined with composite BB tier spreads in the low +200 bps range might cause some issuers to get busy.
The current BB vs. BBB OAS differential of +86 bps is still well above past credit cycle lows averaging in the +60 bps handle range, but the BB-BBB OAS differential is well inside the long term median of +137 bps.

In this commentary, we briefly revisit the BB tier spread differentials vs. the BBB tier. We detail the median of the differentials for “BB OAS minus BBB OAS” levels across various timelines. The narrow range of those medians as detailed in the box above is notable. We also include the highs and lows as frames of reference.
The last double-digit BB-BBB quality spread low that we saw was in Dec 2019 at around +57 bps. That was in a “par plus” HY market riding the rebound off a dismal 2018 with the tailwind of three Fed easing actions delivered in 2H19 to support weaker fixed investment trends (see Histories: Asset Returns from 2016 to 2023 1-21-24). That Dec 2019 low of +57 bps came just ahead of COVID a few months later. We also saw a +62 bps differential in early Oct 2018 when HY hit a cyclical low of +316 bps (10-3-18) just ahead of a very ugly 4Q18 and Dec 2018 meltdown.
At the current +86 bps differential, you really need to believe in sustained strong demand for credit risk for both IG and HY bonds in 2024. You need to have confidence that there is a low risk of a negative HY repricing trend that pushes the overall HY vs. IG quality spread relationship wider.
As we have seen in the past, when CCC and weak B tier price action gets beaten up, that can pull the BBB vs. BB differential wider from the BB side. Our confidence in the scenario of sustained quality spread compression is low. The risk symmetry is not great in our view, and we have been more in the IG camp on relative risk as we head into 2024.
There is no questioning strong BB tier demand while the BBB is now larger than most nation’s GDPs (including the UK, France, Italy, and Canada but just shy of Germany). The HY lite strategy has been an important addition to many asset allocation arsenals and notably in pension portfolio parameters. As a result, BB tier corporate demand has been on the steady rise over the years.
As we have often covered, the term “junk” does not get thrown around as much as it used to when the reality is that long-term average default rates rise exponentially when you move from BB to B and then again exponentially on the move from B to CCC. The risk profiles differ dramatically across tiers and layers. In equities, we still see the term “junk” used without much nuance.
In past lives, I did more than a few calls with pension plan sponsors who were edging across the speculative grade divide to get some additional coupon and cash flow in a ZIRP world. The goal was to increase allocations to the higher risk tiers of the credit market (BBB and BB) that have generated superior risk adjusted returns over the years.
There are also many names in the BB tier that hold better risk-reward symmetry than many BBB names. Some major BBB tier issuers can be very vulnerable under downside macro scenarios that could bring more price dislocation risk. That is especially the case when the BBB tier name has a heavy weighting of bonds beyond 10 years with IG covenant packages. That price risk is compounded by a shortage of natural buyers in the HY market (that is, until after the price dislocation unfolds). That’s another way of say that it still comes down to industry and issuer selection, but the genetic credit tiers do matter in pricing bands. It is never as simple as you want it to be.

For the above chart, we shorten up the time horizon to a Jan 2022 start date to include the period immediately before the end of ZIRP (March 2022) and the onset of a very aggressive Fed tightening cycle. The BB vs. BBB quality spread differential gapped out to +214 bps by early July 2022 just as inflation was peaking in the June numbers at over 9%. The median over that timeline through last week was +115 bps vs the current +86 bps.

The above chart brings the BBB and BB credit tier OAS levels into the visual since the start of 2022. We can see the swings from just before the tightening cycle into an ugly 2022 as just about everyone not only predicted recession but also claimed by the fall we were already in a recession (see Unemployment, Recessions, and the Potter Stewart Rule 10-7-22).
Those recession headlines were premature with such low unemployment and resilient PCE levels. Biden was also putting some stimulus programs in place before the usual turnover in midyear elections blew the whistle and stopped the game. He had two years to get legislation on the board just as Trump and Obama did.
The BBB peak OAS of +208 bps in July 2022 was a sharp +91 bps increase from +117 bps near the starting line. We are now back at +125 bps as of this past Friday. For the BB tier, the run from +206 bps to a wide of +422 bps in early July has now seen the BB tier run back to the recent +211 bps.
The resilience of the consumer sector as broadly covered in our research and solid enough fixed investment activity (note Caterpillar commentary today) keeps corporate sector investors debating with themselves over HY vs. IG allocations. The former pays you for fundamental risks and the latter has more duration exposure. The BBB and BB tier strategy gives you a healthy slice of both in the largest tiers of the above and below speculative grade line.
With the potential for more callable BB activity, the repricing of coupons could come sooner rather than later for many with the curve inverted and CFOs/Treasurers facing some important liability management decisions ahead.
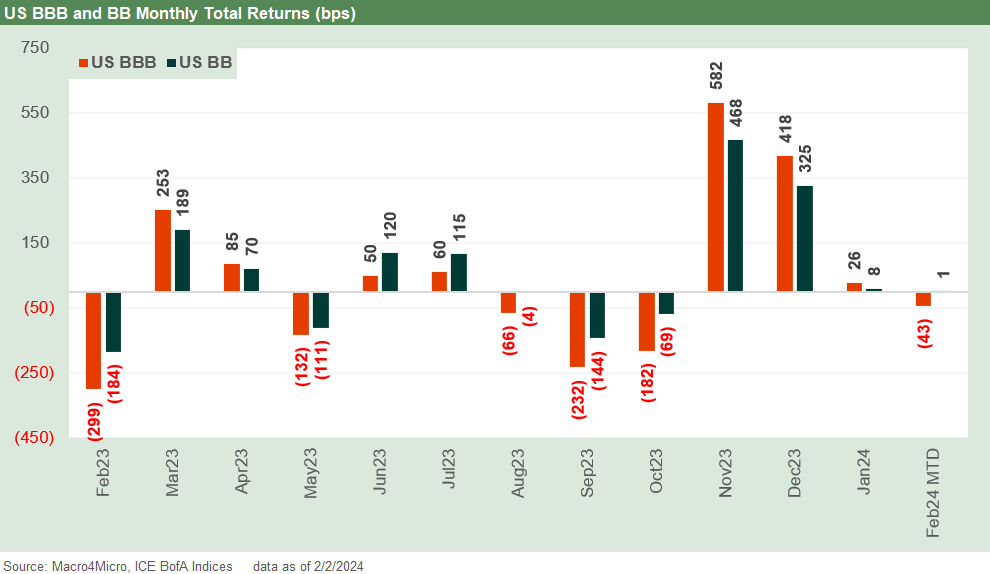
The above chart updates the running 12 months for total returns of the BBB vs. BB sector. Despite a few rough patches, the pattern across 2023 was relatively mild as investors licked their wounds from 2022 and started heavy reallocations to corporate credit and fixed income.
Yields not seen since before the crisis in bonds have moved more needles in credit asset classes than the negative factor of very low relative credit risk premiums across the IG and HY sectors.
We regularly read pension trade rags, and it is hard not to notice the level of focus on credit and bonds across 2023 as the yields get back in the same general area as assumed plan asset returns. We also see emerging asset classes such as private credit give investors more appreciation to how low credit risks actually are in the BBB and BB tier.
The shift to bonds is part demographics and part attraction to cash income to fund pension benefit payments. Many corporate defined benefit (DB) plans are closed, and employees have been shifted (by choice or mandate) over to defined contribution plans. That is another reason for higher bond allocations in the DB plans as part of a demographic wind-down.
The real joy will come when coupons catch up with current yield levels in the BB and BBB tier. The BB tier has a lot more callable paper while the BBB tier is more heavily about maturities and incremental borrowing on growth or M&A.
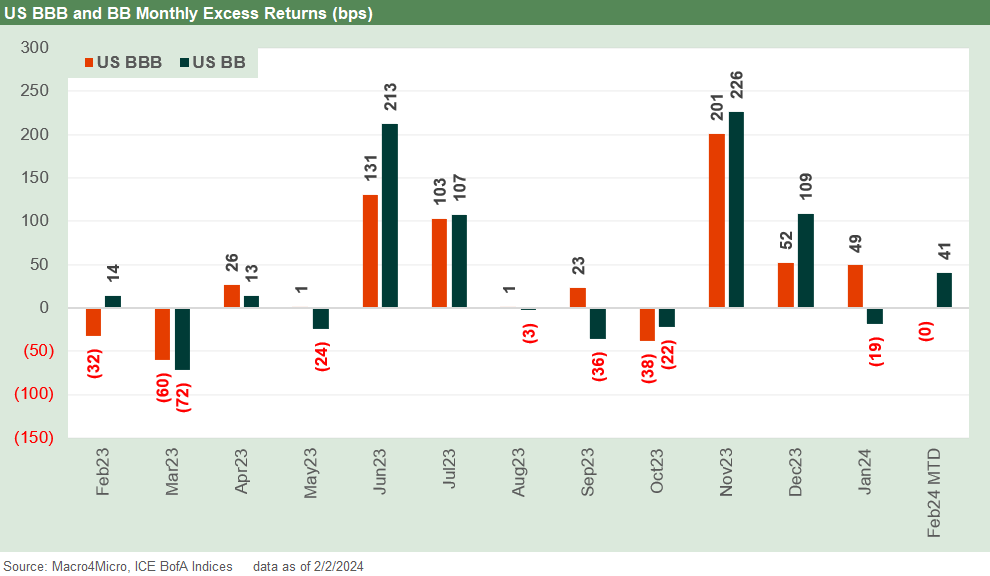
The final chart presents a monthly look at BBB and BB excess returns looking back across the past twelve months. The good news in the BB and BBB tier is the more stable profile of these credit sectors and the heavy overlay of the UST curve strategy and duration value that keeps demand high and can cushion selling pressure if fundamentals weaken.
The risk for the BB tier is that cyclical weakening will lead to quality spread widening that typically radiates from the bottom up. That is when the BB tier more notably underperforms the BBB tier while the low end of HY gets slammed. A mitigating factor for the BB tier widening risk is the lines have blurred between the low BBB tier names and the solid BB names.
Contributors:
Glenn Reynolds, CFA glenn@macro4micro.com
Kevin Chun, CFA kevin@macro4micro.com
See also:
Footnotes & Flashbacks: State of Yields 2-4-24
Footnotes & Flashbacks: Asset Returns 2-4-24
Histories: Asset Returns from 2016 to 2023 1-21-24
Credit Performance: Excess Return Differentials in 2023 1-1-24
Return Quilts: Resilience from the Bottom Up 12-30-23
HY Refi Risks: The Maturity Challenge 12-20-23
Coupon Climb: Phasing into Reality 12-12-23
HY vs. IG Excess and Total Returns Across Cycles: The UST Kicker 12-11-23
HY Multicycle Spreads, Excess Returns, Total Returns 12-5-23