
Housing Starts Jan 2024: Slow … Curve Ahead?
We see a sequential fade in starts/permits as builders prudently manage their working capital and the UST curve stirs some defensiveness.


While YoY starts numbers remain quite healthy, we see some slowing in housing starts sequentially for Jan 2024 vs. Dec 2023 in single family and multifamily with a tapping of the brakes in permits in the largest markets.
The trend could signal efforts to work down the spec build of 2023 in single family and watch the UST curve action and FOMC timing with the same challenge the bond markets face.
Multifamily permits and starts are down sharply YoY and sequentially while completed units keep rolling off the “assembly line” with a steady base of projects still under construction.
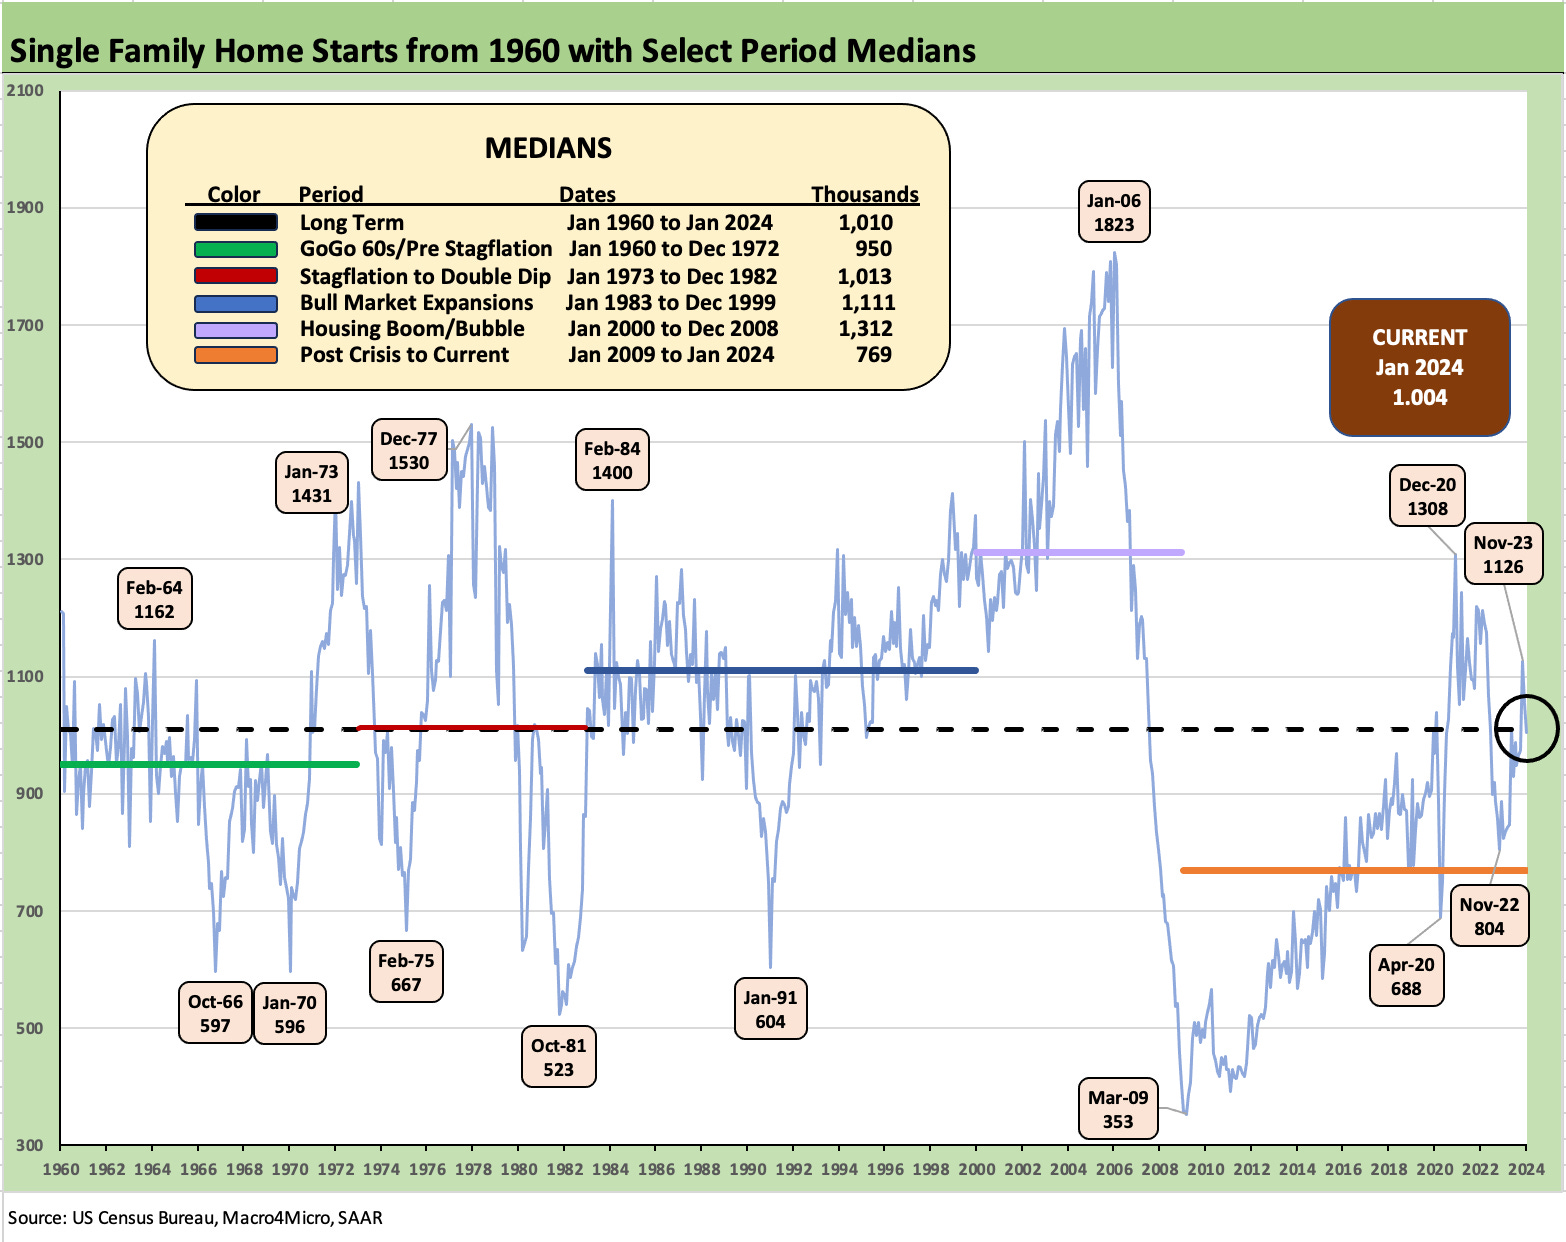
The above chart frames the critical long term time series for single family starts since 1960. The good news is that the run rate is back in the zone of the long term median after the post-crisis housing cycle was well below that level. Then came the COVID spike and ensuing volatility around inflation fighting. The tightening cycle kept many potential buyers on the sidelines with painful monthly payment increases crushing affordability for many in housing broadly (both new and existing homes).
The supply-demand imbalance has been the big anomaly in existing home inventory that kept builders in the catbird seat. The inventory constraints helped builders as mortgage rates shelved many potential sellers of existing homes on the golden handcuff effects as low mortgage rates deterred more supply. The gap between the current SAAR rate of 1.0 million units and the post-crisis to current median of 769K tells a story of how builders have been able to make such a strong comeback in equity valuation and credit quality.
With recent data hitting the UST curve again after strong payroll numbers (see Payroll Jan 2024: Big Swing 2-2-24) and a CPI release that disappointed the UST bulls (see Jan 2024 CPI: The Big 5, Add-Ons, and Favorite “CPI-ex” Indexes 2-13-24), optimism on affordability will remain scarce.
PPI did not help today, and we saw the UST take another modest move higher. 30Y mortgage rates are still well below the peaks, but the 30Y UST rates broadly (beyond the Freddie benchmark) are being cited in the trade rags around 7%. That is still a major affordability hurdle and will feed the tight supply problem on the existing home sales side.
The builders have been very consistent in promising prudent working capital management and a sound balance between deliveries and starts. As we have covered in our housing research and notably for the major public builders, the ability to get creative with incentives (buydowns, fees, etc.) has kept them in the game. The benefits of captive mortgage operations have been very much in evidence as a strategic advantage.
The FOMC has been raining on the Fed easing parade generally with its latest round of commentary and the talking head FOMC economists. The UST handicapping would logically promote some defensiveness and perhaps a fresh look at plans for the spring and summer after a heavy shift into more spec builds in 2023 for numerous builders that prefer built-to-order strategies.
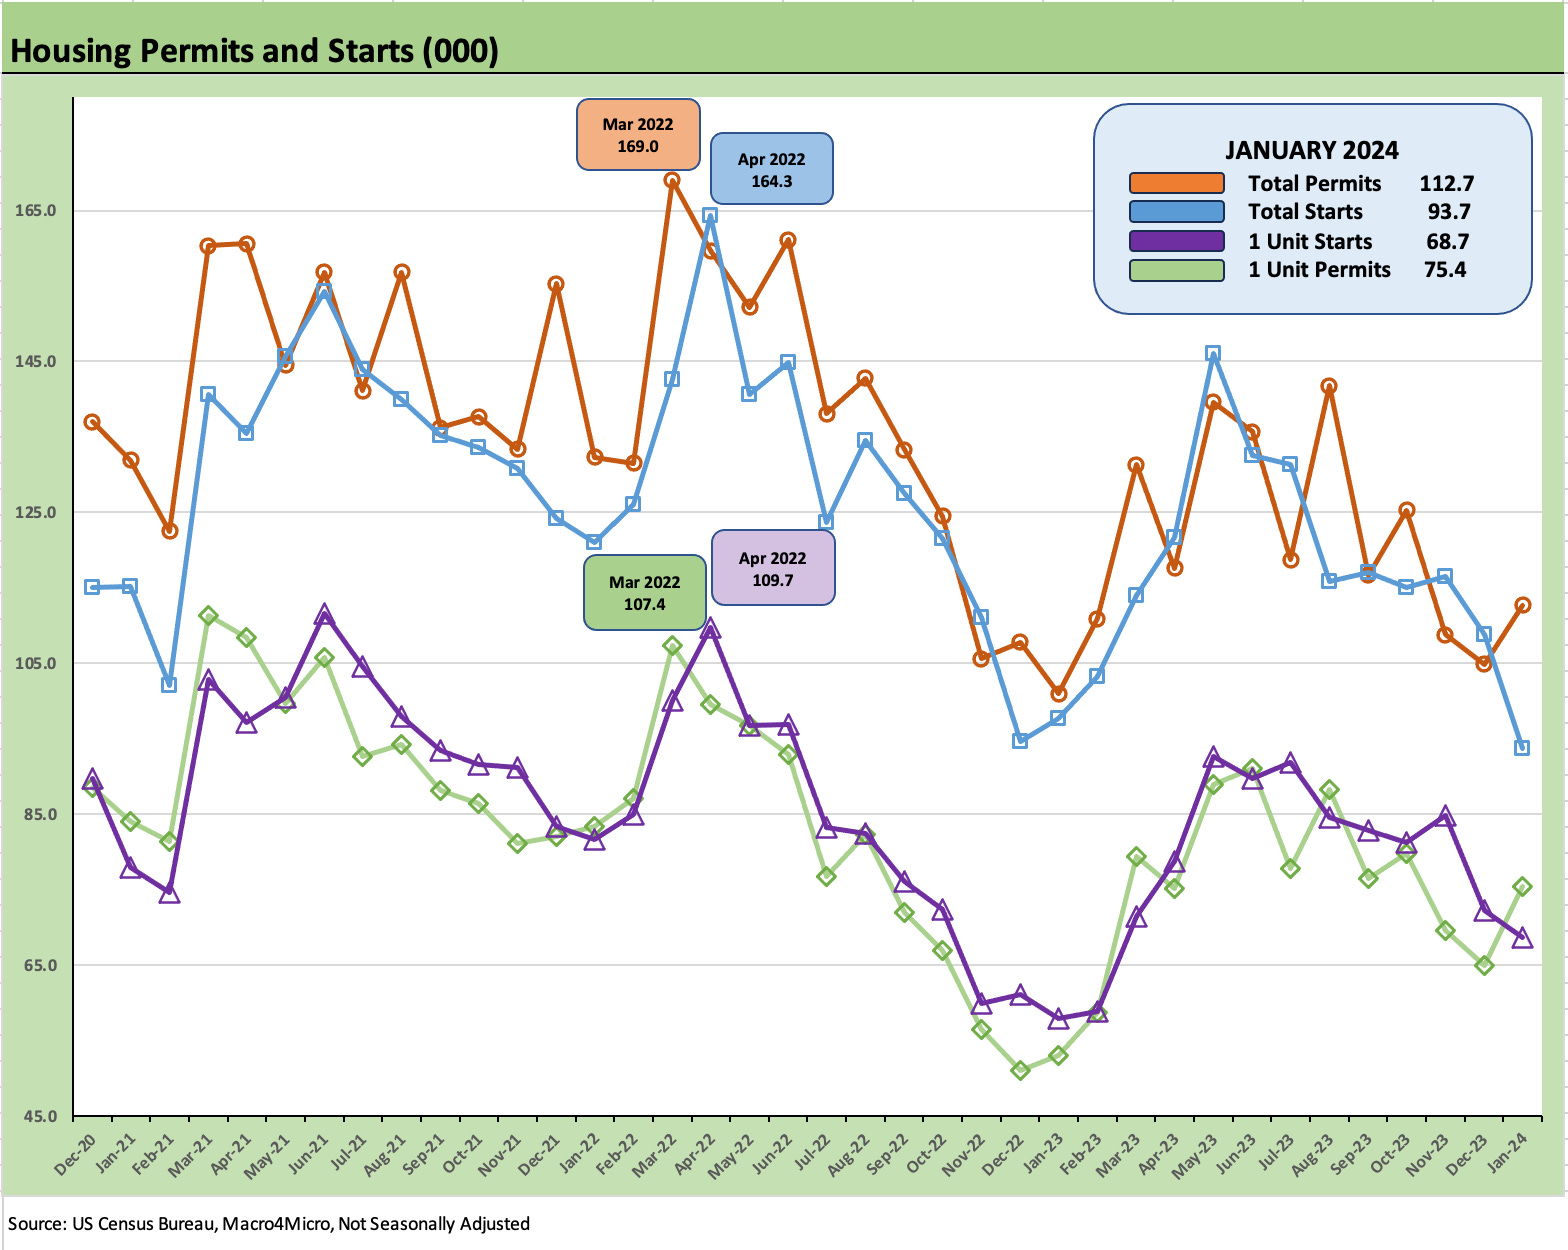
The above chart maps total permits and starts for all units as well as permits and starts for single family only. We use “not seasonally adjusted data” for this chart to get closer to the actual “sea level” activity felt by the builders. We start the timeline at the end of 2020.
We are seeing total starts dropping off and permits climbing in the recent timeline. For single family, we see permits rise this month after a stretch of declines. We see single family starts declining since the summer.
The net takeaway is that volumes are solid and steady even if starting to stall. Deliveries and demand will set the trend in 2024 for more (or less) investment subject to the UST curve direction. The health of the consumer sector (jobs, sentiment, etc.) from here will be the key drivers. The good news is the demographic trends and tight supply favor homebuilding activity.
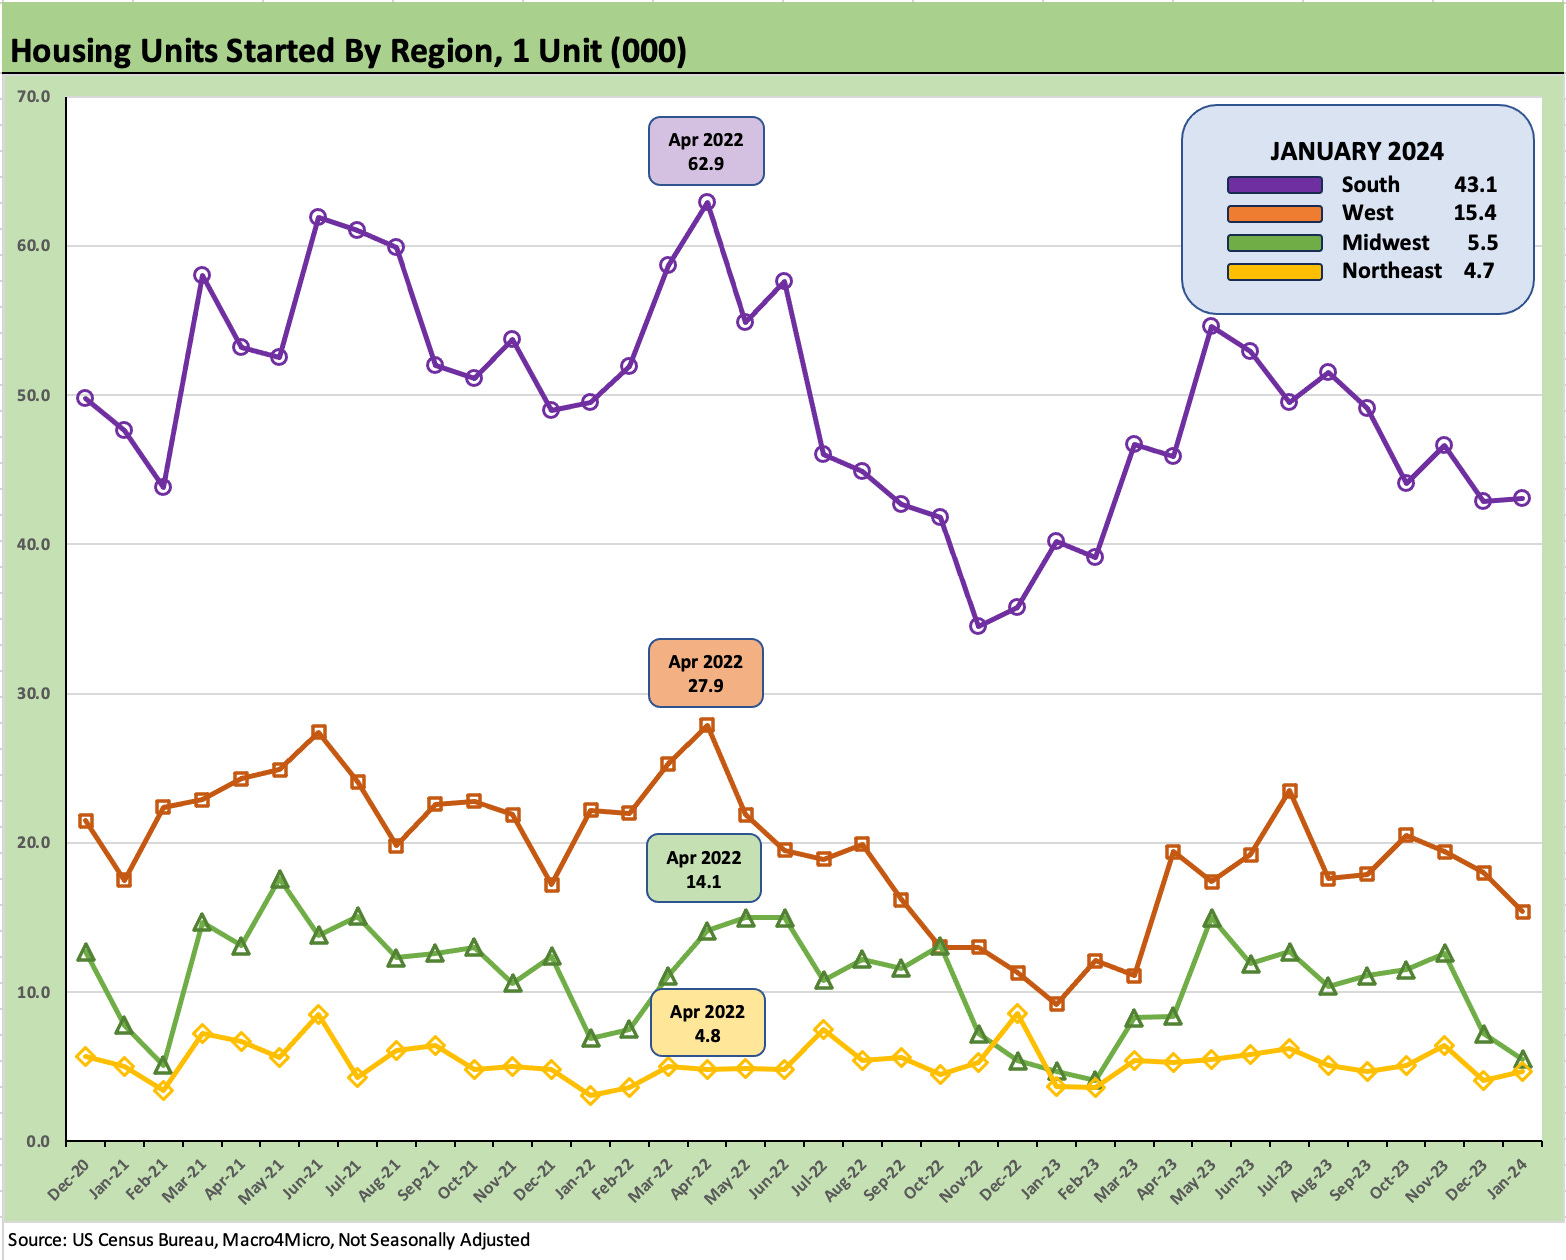
The above chart looks at the regional mix for single family starts and again on a “not seasonally adjusted” basis to get closer to the builder actual experience. The South region tends to dominate the numbers with Texas and Florida in the mix.
As a frame of reference, we highlight the highs of April 2022 for the two largest regions (South and West) just as the tightening cycle was getting underway. Those were not the highs for the smaller Midwest or Northeast region, but we include those data points for an apples-to-apples frame of reference.
The South ticked higher in Jan 2024 as did the Northeast while the West and Midwest moved lower. The net effect was a rise in starts “not seasonally adjusted” on the back of the South’s trend.
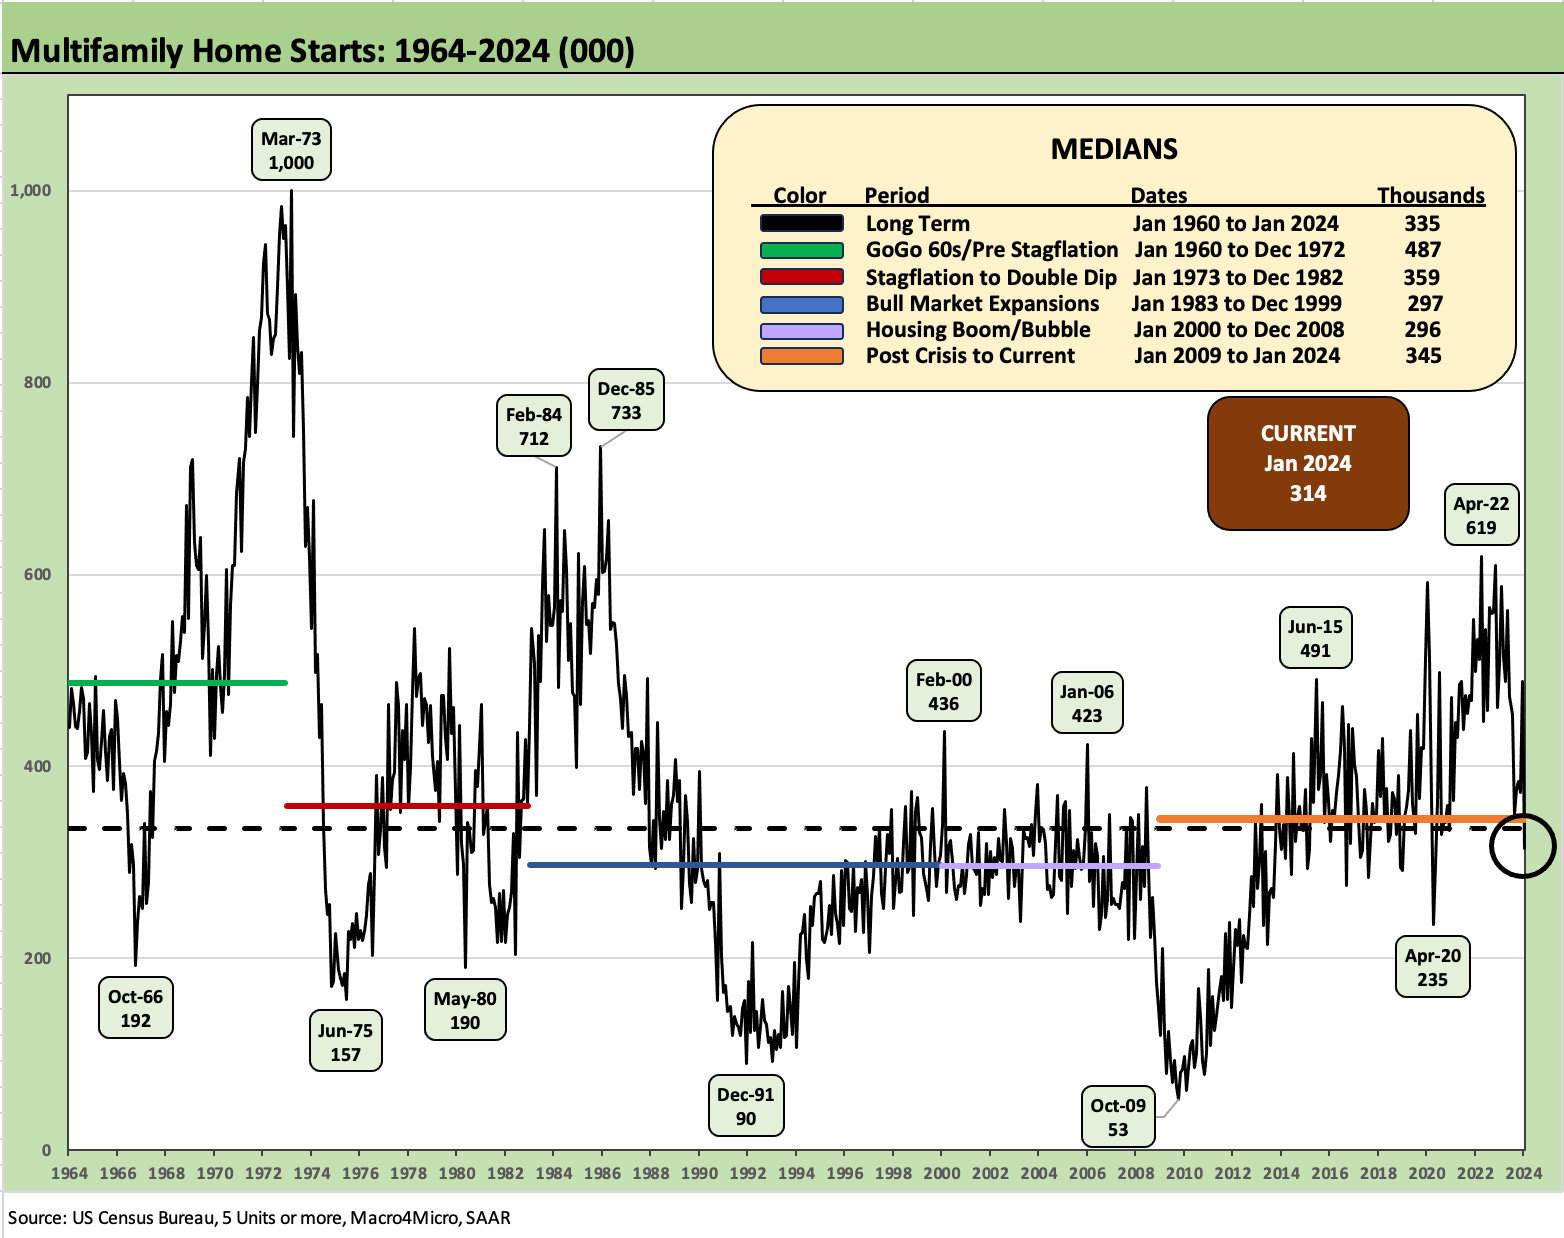
The above chart updates the multifamily starts cycles across the decades with recent activity starting to show a topping off of activity in 2022 and now a drop-off as inventory rolls across the completion cycles and enters the market.
Multifamily units under construction remain at high run rates and the same for completions with permits declining sharply. The multifamily boom and growing supply are supposed to take rents lower and offer some relief on inflation. That has been a waiting game for some months to show more effects in the shelter CPI lines.
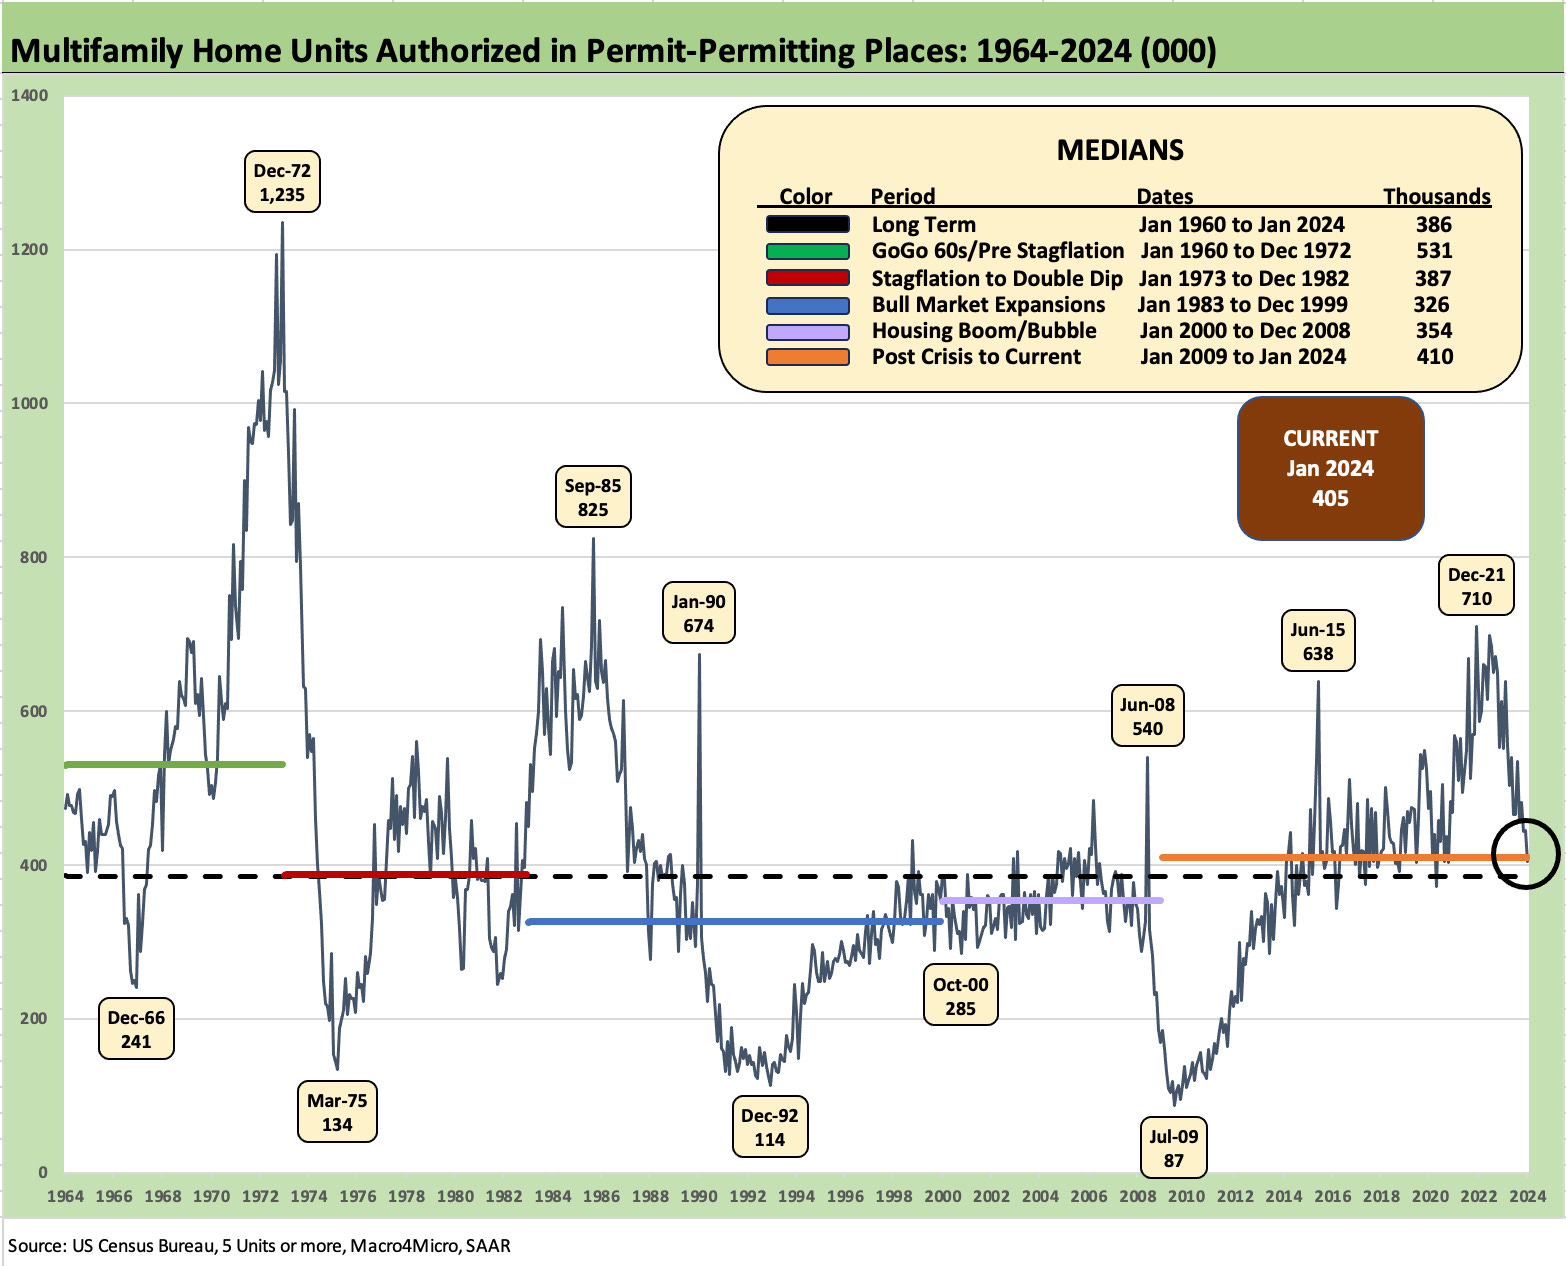
The above chart frames the permits story in the multifamily timelines. At 405K in Jan 2024, multifamily permits are now just under the post-crisis median but moderately above the long term median. The early 1970s peak dwarfs what we see today. The medians of the various periods as noted in the box are in line with current levels.
As you look back across the decades and consider the supply-demand shortfall and housing affordability crisis we see today, the multifamily peak of 2021 and where the market has gone since then does not, at a high level, look like a case of excess. The housing demand is there. A more rigorous view of multifamily needs a lot more regional nuance in the analysis. We see a lot of that metro-level analysis in the trade literature, and the bias of views is that rents will keep coming down with some exceptions in some key markets for subsectors such as single family rentals.