
Inflation Gut Check Jan 2024: PCE Prices, Income and Outlays Help the Story
We look at another balanced set of PCE numbers across prices, income and consumption that continues the lower inflation theme.


Good trend line for PCE inflation while the combination of higher income and slower consumption growth blends in with the balanced economy theme music.
PCE inflation at +2.4% mixes deflation in Goods at -0.5% (Durables at -2.4%) with Services inflation at +3.9%.
Core PCE price inflation at +2.8% at least ticked down sequentially into a second straight 2% handle YoY number (even if a high 2% handle) after a 4% handle for Core PCE as recently as July 2023.
Savings rates still linger below the 4% line (+3.8%) while real disposable income at +2.1% YoY was in a dead heat with real PCE YoY also at +2.1% with both were down from Dec 2023 (+4.2% Real DPI and +3.2% Real PCE).
Most of the numbers were tagged with “as expected” in the media chatter, and the trend line continues a steady move in the right direction for the Fed’s favorite indicator.
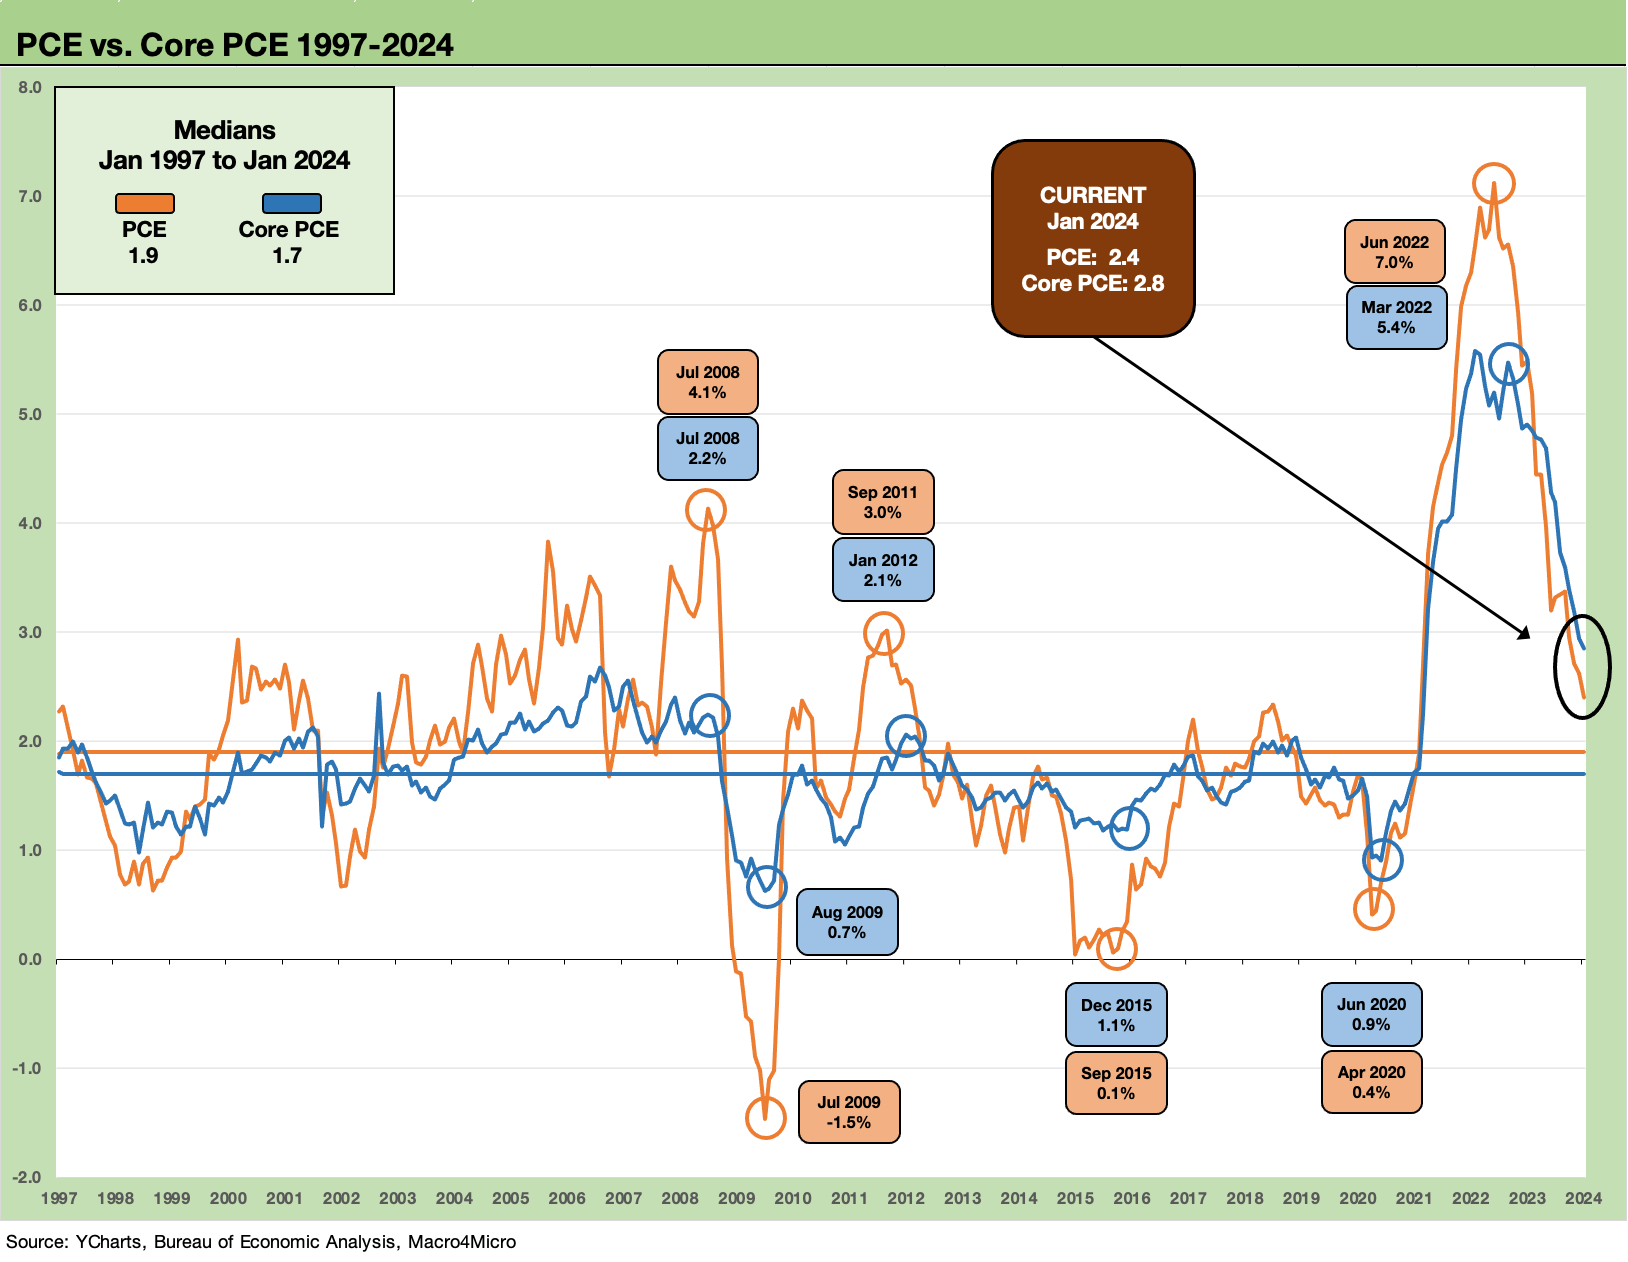
The above chart plots the time series for headline PCE price inflation and Core PCE since the TMT bubble years, and the numbers are still below the sub-2% medians across that timeline with the PCE median at +1.9% and Core PCE at +1.7%. Current PCE inflation is slightly above the long-term medians since 1972 (that time series is two charts below this one).
The market is well down from the 2022 peaks with Jan 2024 numbers a slight improvement from Dec 2023 in a YoY context (see PCE Release Dec 2023: Consumption Strong, Inflation Favorable 1-26-24).
The MoM price metrics were in line with expectations but are unfavorable on a MoM basis vs. Dec 2023. As we discuss in the following chart series, the Personal Income trends in current dollars were strong for MoM with Disposable Personal Income (DPI) vs. Personal Consumption Expenditures (PCE) more muted this month vs. Dec 2023. For MoM, PCE was down sharply to +0.2% from +0.7%.
The bigger picture is still showing a solid consumer sector while Services inflation remains sticky. That is not new. The UST curve reaction was favorable as trading rolled on during the day but mild in magnitude.

The above chart plots the MoM DPI vs. PCE across the period from the start of 2022 and then across the tightening cycle through Jan 2024. With the exception of the pop in Jan 2023, the range was narrow in 2023. The DPI and PCE medians at +0.4% across the tightening cycle are just above the current month. We read that as “steady as she goes” in the consumer sector as of now, but there will continue to be a lot of second-guessing around consumer stamina with credit card lines heavily drawn and a low savings rate.
“What would it take to dial back the consumer sector?” will remain a question both bears and bulls will be asking. Betting against the US consumer is not usually a good game plan, but the only certainty in life is that half the nation will be pissed off after Election Day 2024. That means it will be a risk factor that will be a headwind one way or the other later in the year. That is a long way off. We assume drinking establishments will be busy in Nov 2024 for both sides.

The above chart updates the long-term timeline for PCE and Core PCE. The +2.6% median for headline PCE and +2.3% for Core PCE for 1972-2024, when taken in tandem with the high 1% handle medians for 1997 to 2004 medians, underscore why the Fed would target 2.0%. It is defensible across history.
The old rule of “close is good in horseshoes but not in hand grenades” says the PCE target is horseshoes. Then again, easing fed funds and then seeing a return to mid 3% PCE inflation handles might be seen as a grenade the Fed wants to stay far away from.

The above chart updates the differential for PCE vs. Core PCE. The -0.4% differential in Jan 2024 is below the +0.0% long-term median (rounding down from +0.04% median).
We see some negative numbers in oil crash years and after some notable downturns. On the flip side, we see spikes with oil driving the differentials higher in select periods (1974 oil embargo, 1980 post-Iran crisis of 1979, 1990 Iraq invasion of Kuwait, 2008 summer oil spike). Inflation in Services is the challenge in current times.
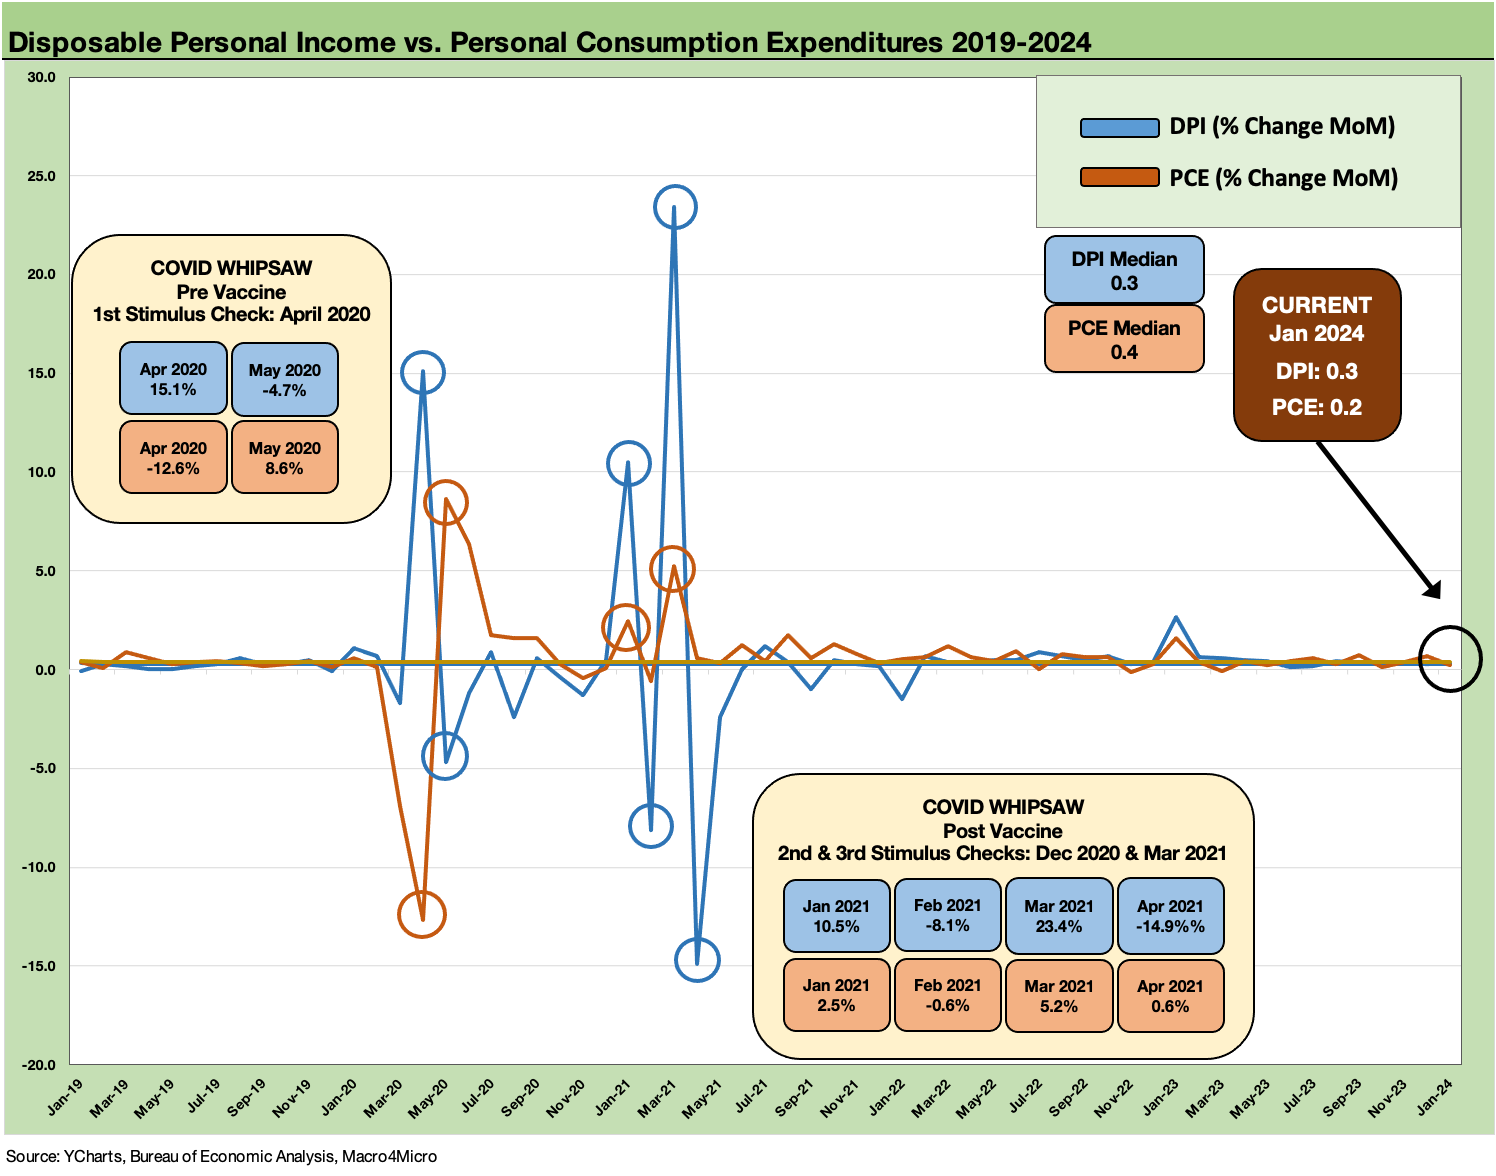
The above chart updates the DPI vs. PCE line, and it underscores the relative balance since the wild swings of the COVID stimulus and relief period. The spikes of those periods get debated by political axe grinders (see Inflation Rorschach Test: Looking at Relief and Stimulus 2-7-23), but those swings reflect the very divergent views around how to manage the COVID fallout (i.e. who gets relief and who doesn’t). Those spikes and sharp declines were seen in both income and consumption as each side of the political spectrum sought to “buy love” from their constituencies. Nothing new there except a pandemic.

The above chart wraps up the monthly PCE comment with updates of DPI and PCE going back to 2019. The Income and Outlays in the consumer sector are what drive GDP. Staying employed allows DPI to drive PCE. The cause-and-effect mechanism is not rocket science even if the mushrooms growing on the House floor and spreading their own uniquely brilliant policy ideas try to complicate the issue. Employment is quite strong right now (see Payroll Jan 2024: Big Swing 2-2-24), and that is no small factor.
See also:
Existing Home Sales Jan 2024: High End Climbing, Low End Stagnant 2-22-24
Retail Sales Jan 2024: Balancing Act Continues 2-15-24
Industrial Production: Capacity Utilization Limps Along 2-15-24
Jan 2024 CPI: The Big 5, Add-ons, and Favorite “CPI-ex” Indexes 2-13-24
Fed Funds vs. PCE Inflation: Peaks and Valleys Across Time 2-7-24
PCE Release Dec 2023: Consumption Strong, Inflation Favorable 1-26-24