
Jan 2024 CPI: The Big 5, Add-ons, and Favorite “CPI-ex” Indexes
Jan CPI was a clear setback vs. consensus YoY and in sequential numbers from food to shelter even if there is plenty of doubt to cast on the Shelter line and OER.


The CPI number was hotter than expected and sent a fresh signal to the market that things are not always what they seem to be in a thematic message for the start of an election year.
Headline CPI did not crack the 3.0% line as predicted, and both headline and core YoY came in 0.2% above YoY consensus with more than a few comparisons to Sept 2023, which was a bad month for UST.
The monthly CPI rate for headline inflation was +0.1% above consensus at +0.3% and core monthly rates was +0.4%, just above expectation as the stock and bond markets immediately took it on the chin (10Y UST up almost +12 bps and 2Y UST over +15 bps as we go to print).
The “CPI-ex” special aggregates we look at below tell a reassuring story for “All-items ex-Shelter” at +1.5%, but All Services at +4.9% and Services ex-Energy at +5.4% will keep the Fed on edge even if the value of the oversized shelter lines (36.2% of the CPI index) are debatable if not downright dubious.
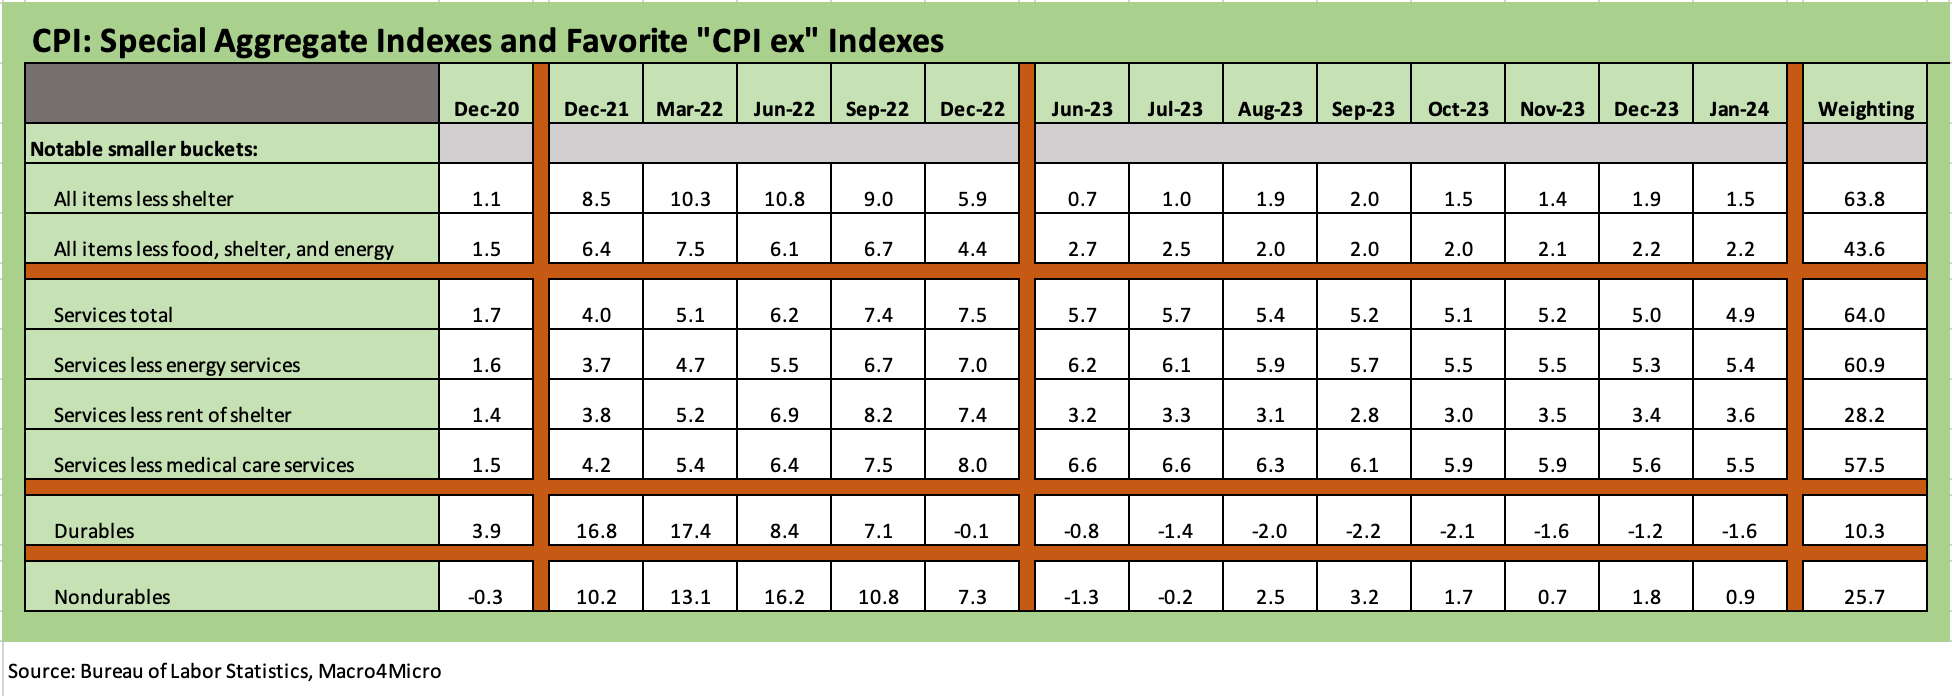
We start with the special aggregate indexes this week in the chart above and get back to our “Big 5” and add-ons below. The Big 5 comprise around 75% of the CPI index and the add-ons we drop in below add almost another 12% of the index for 87% of the total.
The shelter problem…
The special aggregate CPI indexes above tell a story from a few different angles. The 1.5% CPI for “All Items Less Shelter” is a positive inflation reading at a level well below 2%. The sequential monthly move was ugly at +0.6% for Shelter overall and for Owners’ Equivalent Rent (OER) which ticked higher from +0.4% in Dec 2023 to +0.6%. The adverse move in Shelter comes just as many high frequency rental indicators are showing lower rents and more rental supply coming on the market and expecting OER especially to come down since it is derived from rental data.
There is a wide range of rental trend performance by metro area that one sees in the housing sector news flow and trade rags, so this area remains a wrestling match for UST bulls and Fed handicappers. The rise of single family rentals is a new factor relative to past cycles and can be a “disturbance in the force” for various economic models looking at the space.
We take some solace from the ex-Shelter levels and the data we see from market sources. This shelter topic is perplexing for many, and the Fed stays relatively quiet on the topic (or relatively superficial). We assume there are some at the Fed that find OER useless and conceptually flawed, but academics do not like to talk trash about tools developed by the “home team.”
We won’t replay all our past commentary other than to say the Shelter metrics are now a bigger slice of the overall index at 36.2% in total (up from 34.7% in Sept 2023). OER by itself is +26.8%. The OER part violates the common sense “cash-in, cash-out” rule of what impacts the consumer pocketbook day in and day out. If you have a 3% mortgage locked in or zero mortgage, you are not feeling a 6% handle inflation rate on your home as your fixed rate mortgage does not change and your home value is materially higher since COVID.
For a homeowner with a low or no mortgage, you are more likely feeling pretty good unless you want to sell your home and get a new mortgage on a home on the other side. If a homeowner is thinking about divesting a 3% mortgage for a high 6% mortgage, they feel bad at current mortgage rates and monthly affordability metrics (especially if they are in the grocery store line thinking about selling their home and making the next car insurance payment).
Services vs. Durables and Nondurables…
We live in a services economy, so the various cuts of Services inflation are a tough “last mile” trip for the destination to 2.0% PCE for the Fed and perhaps a mid-2% CPI line for the broader market.
Total Services of +4.9% YoY is tough but includes the Shelter problem. The “Services less Energy” index at +5.4% is not reassuring either with so much of the jobs strength and the anchors for consumer spending tied up in Services payrolls (see Payroll Jan 2024: Big Swing 2-2-24). As a reminder, the Shelter metric is 36.2% of the index within a total Services line that is 64% of the CPI index and a Services ex-Energy line that is 60.9% of the CPI index.
The goods side is at least coming up roses for fans of easing with Durables deflating at -1.6% YoY and Nondurables at +0.9% YoY. The Nondurables line includes -1.0% for “Nondurables less food” and -1.2% for “Nondurables less food and beverages.” We see -1.6% for Nondurables less food, beverage, and apparel. That works OK for those on a severe diet but not if they plan to drop 25 pounds and get clothes that fit. Starving, thirsty and naked is not a great metric either, so those do not make our chart above.
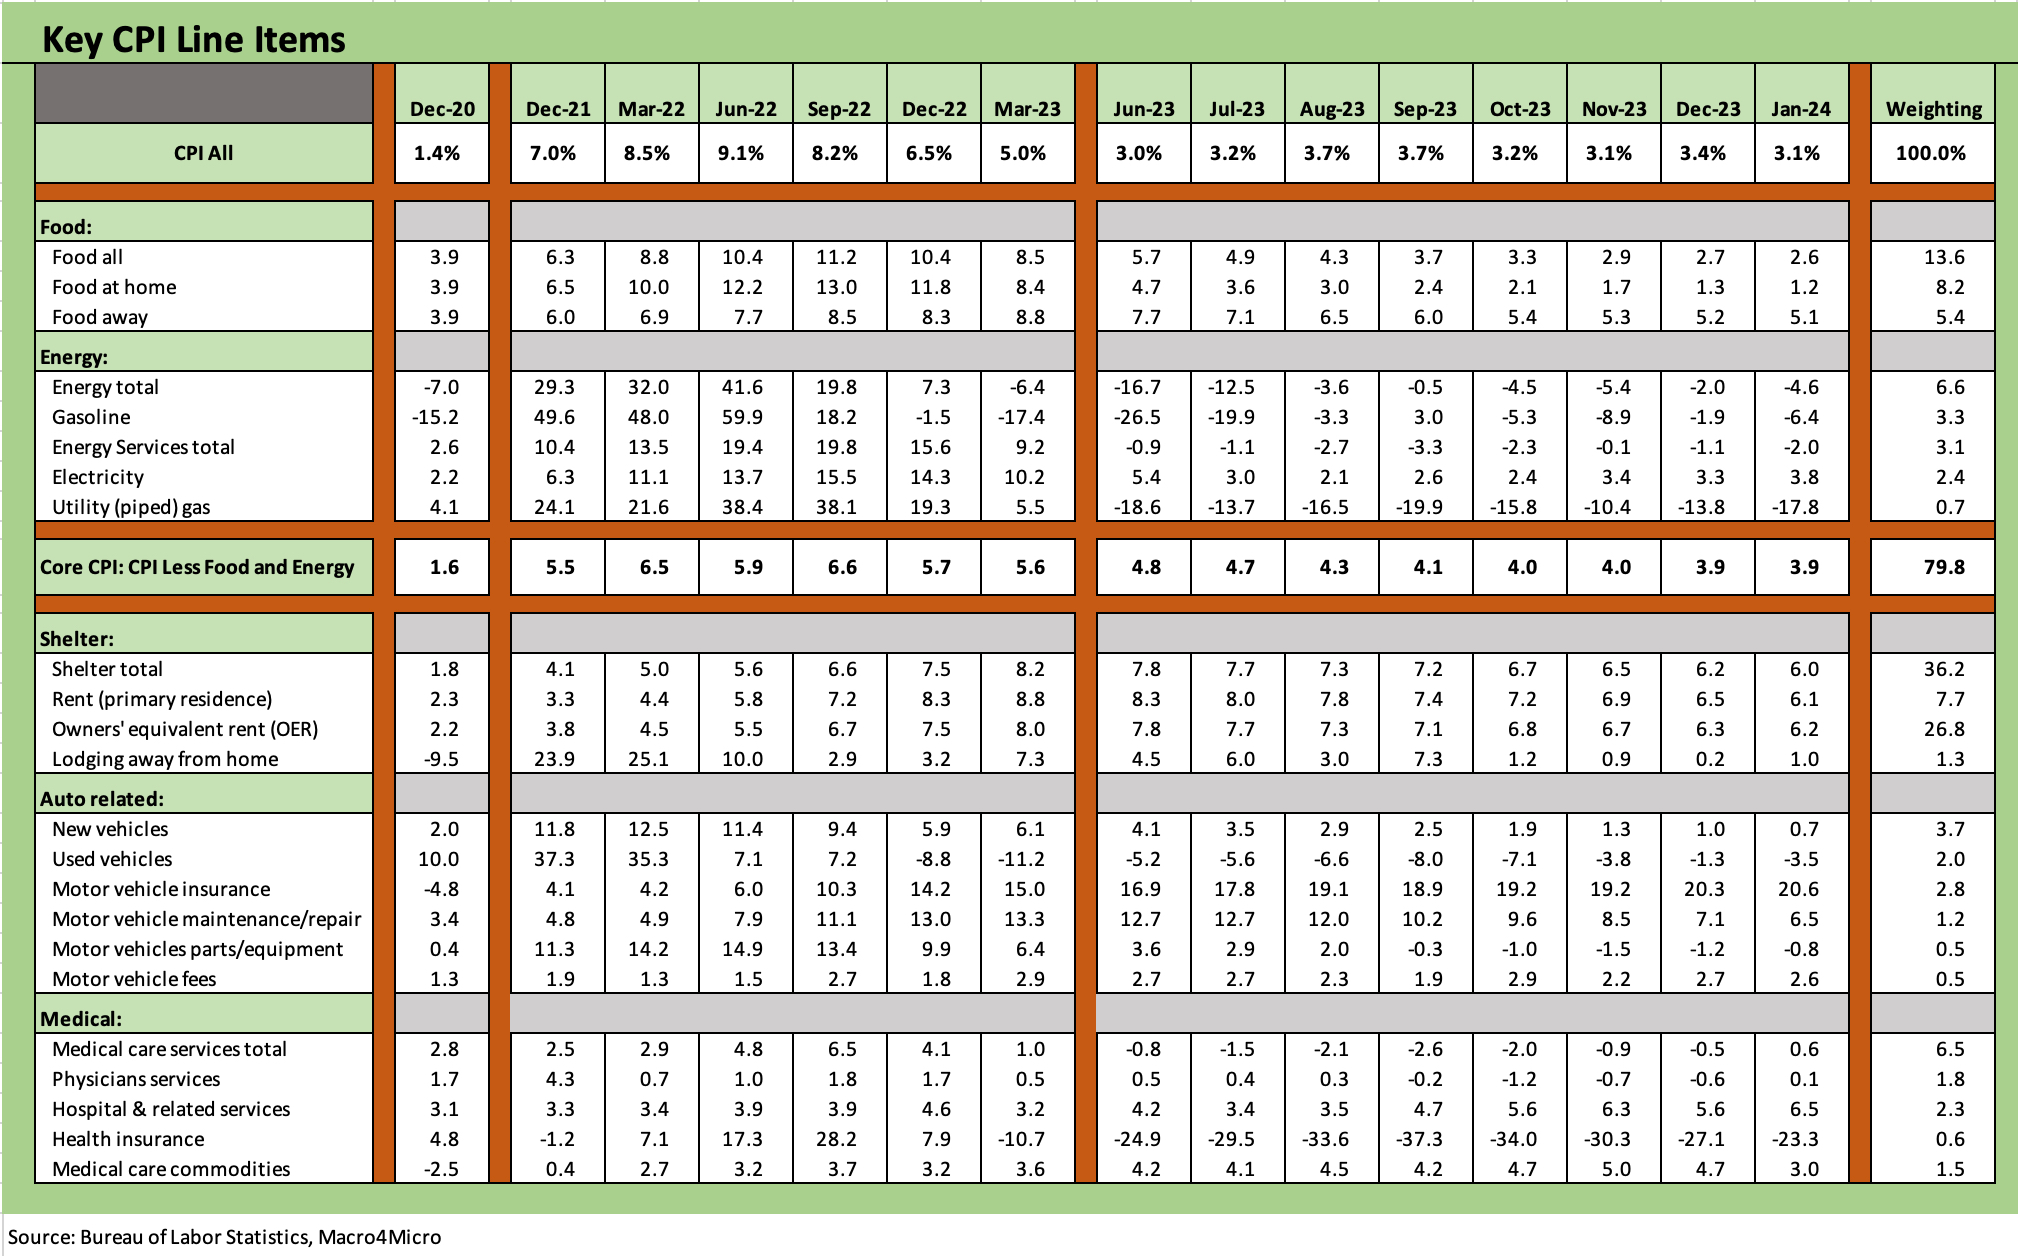
The above chart recaps our Big 5 list which adds up to around 75% of the CPI index. With the add-ons that we break out in the next chart, the chart above and the one below account for around 87% of the total CPI index.
We already addressed Shelter earlier while “Food All” inflation is down materially from the double-digit peak in 2022 to 2.6% this month. Food at Home was down to +1.2% YoY in Jan 2024. We see a move higher sequentially, however, in the monthly Food bill that is 8.2% of the CPI. Food All rose MoM to +0.4% from +0.2% in Dec 2023. Food at Home rose MoM to +0.4% from +0.1% in Dec 2023.
The inflation trends for food come on top of a repriced “menu” on a running basis that has not seen wages keep pace. For many consumers, 0% Food inflation from here will not change the diminished purchasing power of their current paycheck. That is just the reality.
On the way to Core CPI, Energy has a history of swinging widely, but history is not kind to the idea of food deflation bailing out household budgets after an inflation spike. That is just a matter of a time series (see Inflation Timelines: Cyclical Histories, Key CPI Buckets 11-20-23). You see very few (and very small) data points with food CPI turning negative.
In contrast, Energy has been a long roller coaster ride since the early 1970s and natural gas has had its share of wild moves also. When oil and natural gas go higher, the price of food also by definition goes higher. That is the sheer unforgiving force of economics (fertilizer, energy cost, freight and logistics, etc.). Unlike Energy, food prices are much stickier on the downside. That is a fact.
That reality of the energy-food inflation link is very much known in DC (by the non-idiots in the mix) and by most of the pseudo hawks in the Senate and the House who advocate hitting Iran’s energy infrastructure. If the US were to hit Iran’s infrastructure, then the big talkers can campaign on inflation (“Look at gasoline! Look at food!) and get CPI back moving higher for the election (note: they are not so tough when Trump says “jump” or “roll over and bark.”).
There are plenty of targets in the Middle East for retaliation against Iran if this keeps heating up. Targeting within Iranian borders takes a high bar to clear given not only the escalation risk, but also the inflation and economic toll.
The auto story is bigger than it seems…
Autos play a larger role in inflation than it sometime gets credit for. As a reminder, we craft our own mix of line items to come up with a better frame of reference on the costs the consumer faces in owning a car or truck. The focus on new and used vehicles in 2022 sometimes distracted attention away from some line items that had been soaring.
The collective cost of having a car as we break out above excludes items like gasoline (which we like to keep in the Energy bucket) or a parking space for many urban dwellers that run a wide range nationally. For many homes, the auto CPI basket is bigger than food when gasoline costs are included. Insurance has been spiking and is still rising subject to some state regulatory lags.
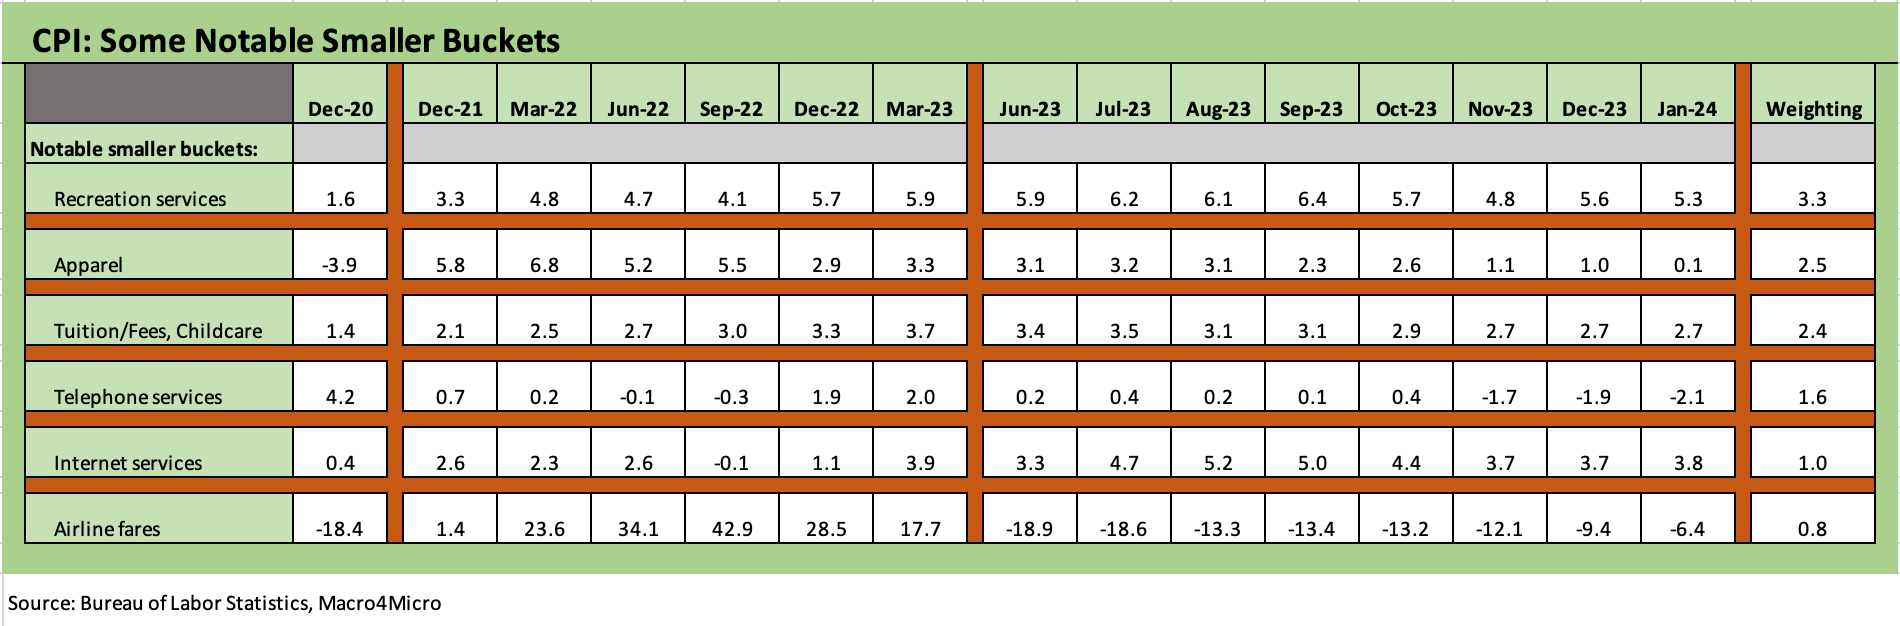
We wrap with our usual “add-ons” that are near and dear to many households. This list adds almost another 11.6% points of the CPI index as noted in the weighting column on the right. Apparel inflation is almost down to the 0% line YoY at +0.1% while Telephone services and Airline fares are in deflation. Aviation fuel is a big part of the airline pricing story. We see 2 of the 6 posting lower inflation, 1 posting higher deflation, 1 posting lower deflation, and one flat (Tuition etc.). The sole line item with higher inflation YoY was Internet services with a small increase to +3.8% from +3.7%.
As we go to print, the market has cast a clear vote on how it feels about this inflation number.
See also:
Footnotes & Flashbacks: State of Yields 2-11-24
Footnotes & Flashbacks: Asset Returns 2-11-24
Fed Funds vs. PCE Inflation: Peaks and Valleys Across Time 2-7-24
Payroll Jan 2024: Big Swing 2-2-24
Productivity: Takes the Edge of the 4% Handle YoY ECI 2-1-24
Employment Cost Index Dec 2023: Compensation Mixed Picture 1-31-24
JOLTS Dec 2023: “Little Changed” on Replay 1-30-24
PCE Release Dec 2023: Consumption Strong, Inflation Favorable 1-26-24
Consumer Sentiment: Multiple Personalities 1-19-24
Dec 2023 CPI: Big 5 and Add-Ons, the Red Zone Challenge 1-11-24