
Payroll Feb 2024: Records, Revisions, Reality
We drill down into jobs trends, look at structural underemployment, and frame payroll deltas by occupation. We call political BS on a state and local hiring boom.


The good news in payroll numbers is that +275K job adds handily beat expectations even while unemployment ticked higher to 3.9% on the long division math of total unemployed/total labor force as both the labor force and total unemployed grew.
The sharp downward revision of Jan 2024 (revised down by -124K from +353K to +229K) and the downward revision of -43K for Dec 2023 (from +333K to +290K) left the question of “How hot?” a bit blurry for Fed handicapping while the +4.3% YoY hourly wage numbers edged lower from the 4.5% in Jan 2024.
The facts of the Establishment Survey are clear in the most important way in that we see another record payroll count, and more paychecks are better than less paychecks (Mo Money, Mo Spending).
We add the U-6 Unemployment rate to our collection this month at 7.3% for a read on “Structural Underemployment” and those discouraged-but-aspiring workers who are more likely to be part of the economic malaise theme seen in polls.
We update the occupational line item deltas for Feb 2024 for the post-Jan 2020 period, LTM, YTD and MoM as rolling LTM job adds remain very strong.
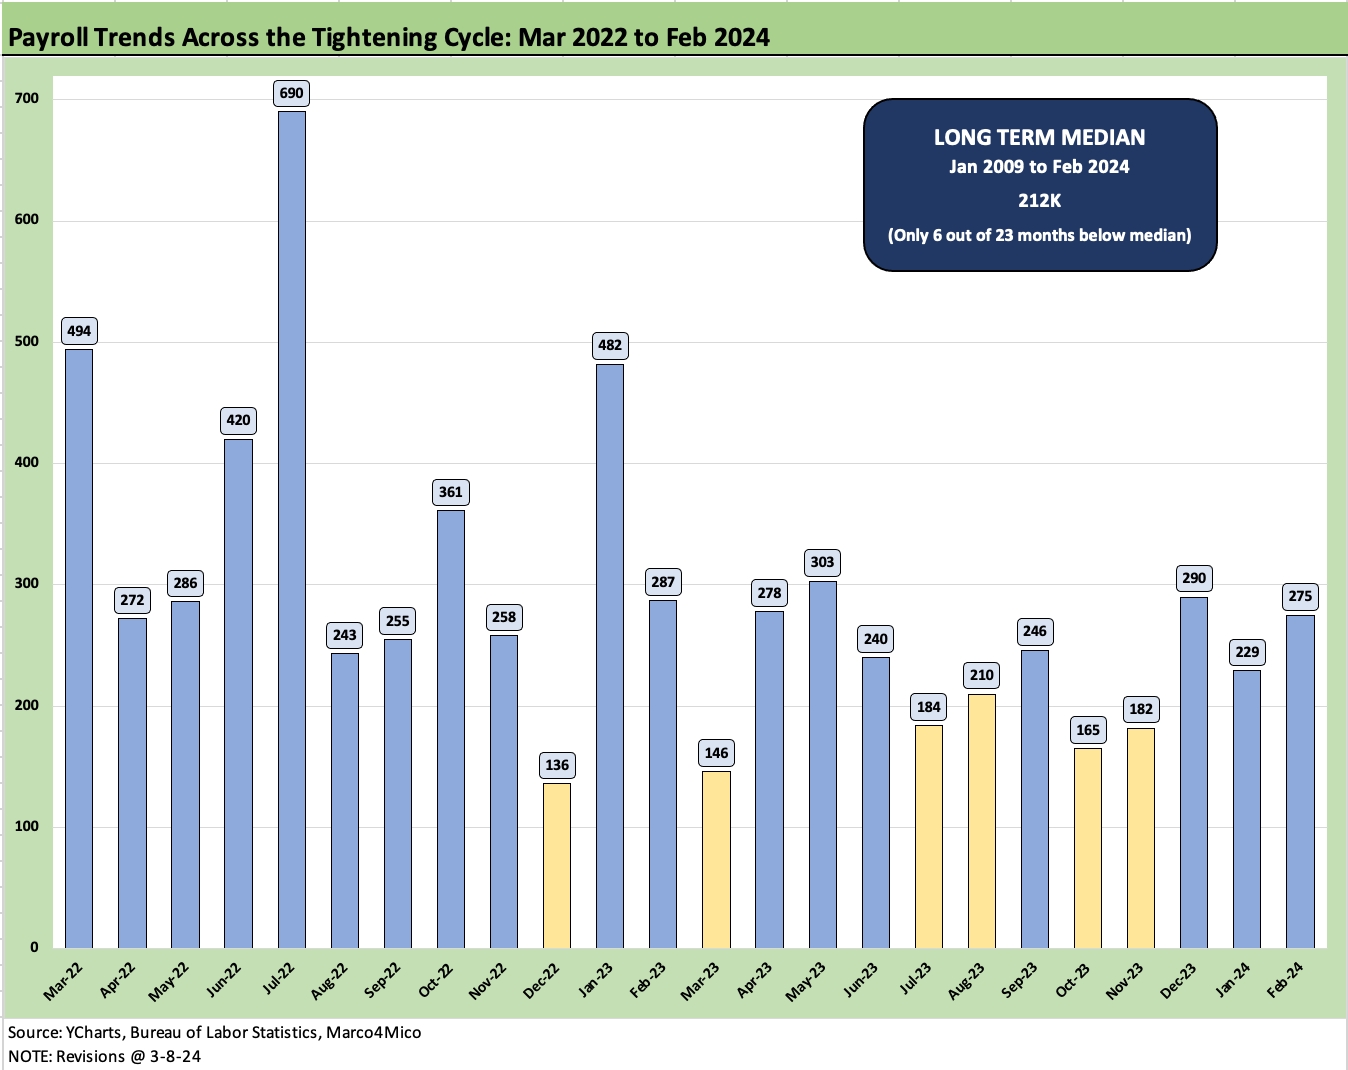
The above chart updates the monthly job deltas back to early 2022 and reflect the downward revisions for the past two months that pulled the headline numbers back down under the 300K handle line.
For many, 200K is the demarcation line for a solid month that materially outpaces demographic needs. We usually don’t see serious conversations about recession until we see job declines rolling into the monthly reports.

The above chart offers a long-term trend line on monthly payroll changes vs. the unemployment rate. We break out the massive employment swings during COVID peaks in the box within the chart to avoid impairing the overall visuals of the chart during “normal” times of economic cycles.
The longer-term median from Jan 2009 on job adds in a growing economy with a growing labor force is 212K while the median unemployment since early 2009 is 5.4%. The timeline covers the Obama, Trump, and Biden years.
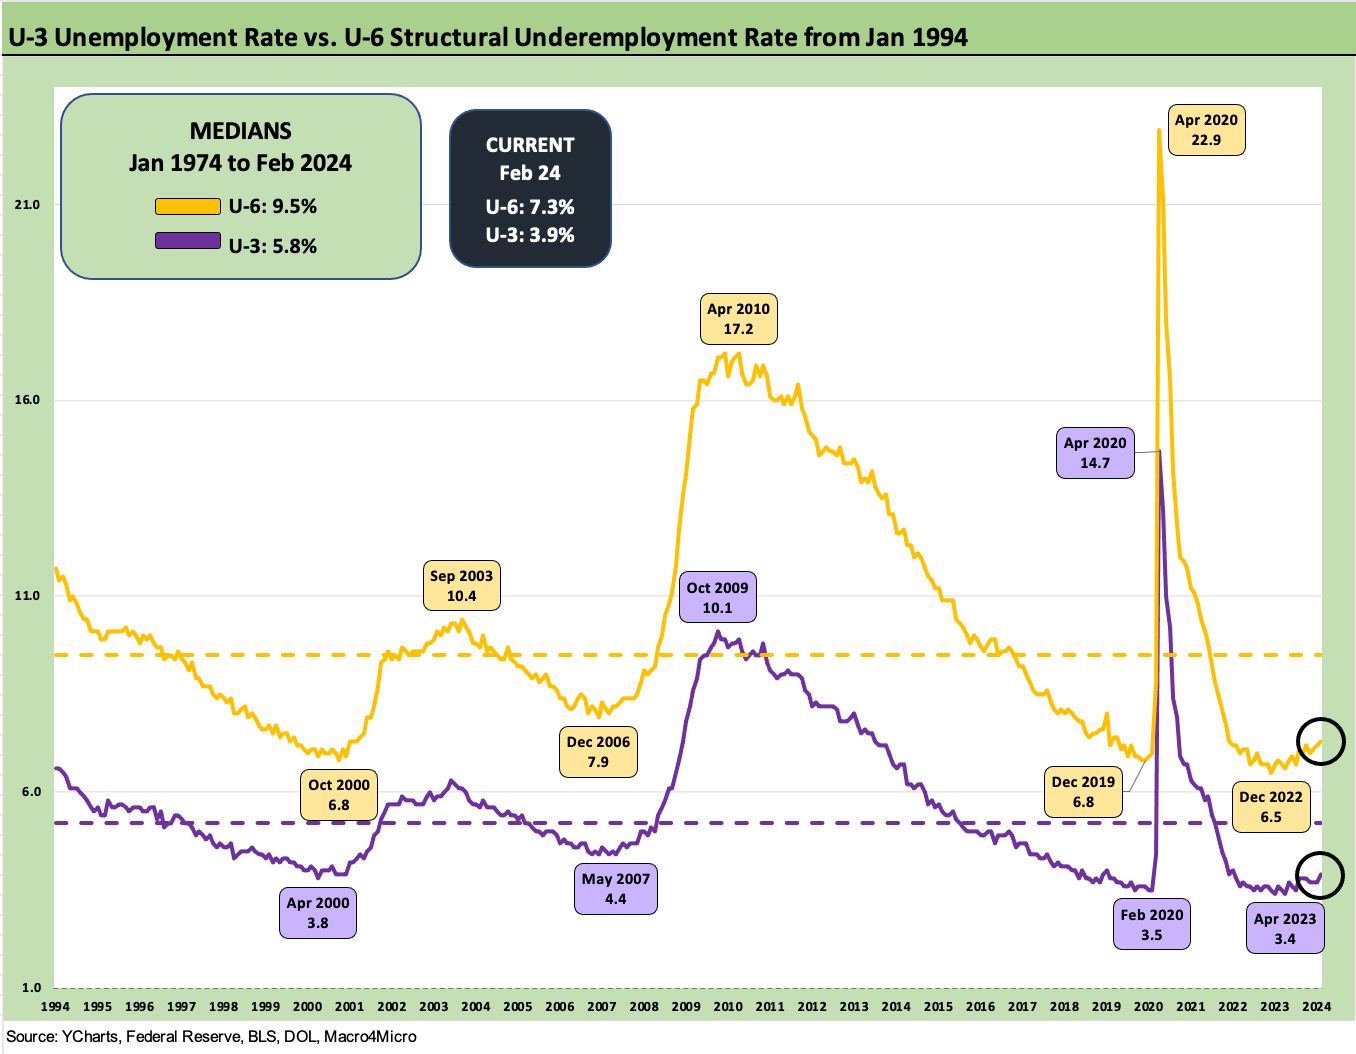
We thought we should add a U-6 time series to the collection to frame another view that departs from the official U-3 unemployment rate. The U-6 reflects a more conservative view on unemployment, underemployment, or labor underutilization depending on how one wants to frame the quality of employment at the worker level. The U-6 number at 7.3% is up YoY from 6.8% and ticked slightly higher sequentially from 7.2%. However, that does not change the overall assessment that it was a good jobs month. From here, the U-6 will be a good metric to monitor.
The U-6 is another metric framing consumer health as reflected in the employment picture. The official definition of the U-6 metric shows the numerator as “total unemployed + persons marginally attached to the labor force + total employed part time for economic reasons.” The denominator is “civilian labor force + workers marginally attached to the labor force.”
Part time workers (for whatever reason economic or noneconomic) get included in the civilian labor force, but the “marginally attached” part of the Household Survey includes those who are “neither working nor looking for work but indicate that they want and are available for a job and have looked for work sometime in the past 12 months.”
The mix of part-time jobs gets its share of attention. For some yardsticks, workers categorized as part-time for noneconomic reasons totaled 22.3 million during Feb 2024. “Part-time for noneconomic reasons” means 1 to 34 hours, but those shorter hours worked are for other reasons such as childcare, retirement supplemental income, or family obligations among others. “Part-time for economic reasons” totaled 4.4 million with the same 1 to 34 hour definition. Economic reasons include business conditions, lack of available work, or seasonal declines in demand among others.

The above chart plots the U-6 differential vs. the U-3. The U-6 tracks the pattern of the U-3 closely across cycles over the past few decades. We saw that similarity in the swings in the prior chart. For the U-6 vs. U-3 differential, we see highs in March 2009 (stock market lows) and Sept 2011 (Euro sovereign crisis, UST default threat) when capital markets were pricing risk in a very ugly way. So, no surprise there. We see another high during COVID for obvious reasons.
The cyclical peaks still bring frustration for many workers (employed or otherwise) that climb into the millions. That was true across the years during downturns when some industries faced severe upheavals that lingered into the recovery years. The crisis period was brutal for many industries, and the same was true with COVID fallout. The interest rates and inflation shock did economic damage in 2022, but jobs kept on rolling in and pushed back on the recession forecasts.
There will be plenty of challenges ahead for those seeking better employment opportunities in those labor-intensive industries that see technology reducing headcount needs as tech gets substituted. We anticipate AI will be a labor disruptor ahead. Tech vs. labor has been going on for decades in many industries across manufacturing as well as services.
Whether discouraged, marginally attached to the labor force, or in a part time job when that worker wants a full-time job, the emotional side of the equation for workers (employed or otherwise) factors into sentiment indicators and shows up in election years.

The above chart plots the time series for total payroll from the Establishment Survey (i.e. employers) that hits the headlines with each payroll report. The 157.8 million handle SAAR record high reflects a record-sized economy and a lot of demand. Employers do not hire for no reason, and the election year politics struggle to make a higher number look lower. The number is the number. Period. You can debate the underlying fundamentals, the quality of jobs, and prospects ahead.
The unemployment rate of 3.9% is a function of unemployed (6.46 million) vs. the civilian labor force (167.4 million). Both the number of unemployed and the civilian labor force grew this past month in the Household Survey.

The above chart plots the total number of Job Openings vs. Total Payroll as a frame of reference. Job Openings was addressed in our JOLTS report commentary earlier this week (see JOLTS Jan 2024: Holding at “High’ Even if Well Down from Peak 3-6-24). Job Openings of 8.86 million comfortably exceeds the new (and sequentially higher) total unemployed number of 6.46 million.
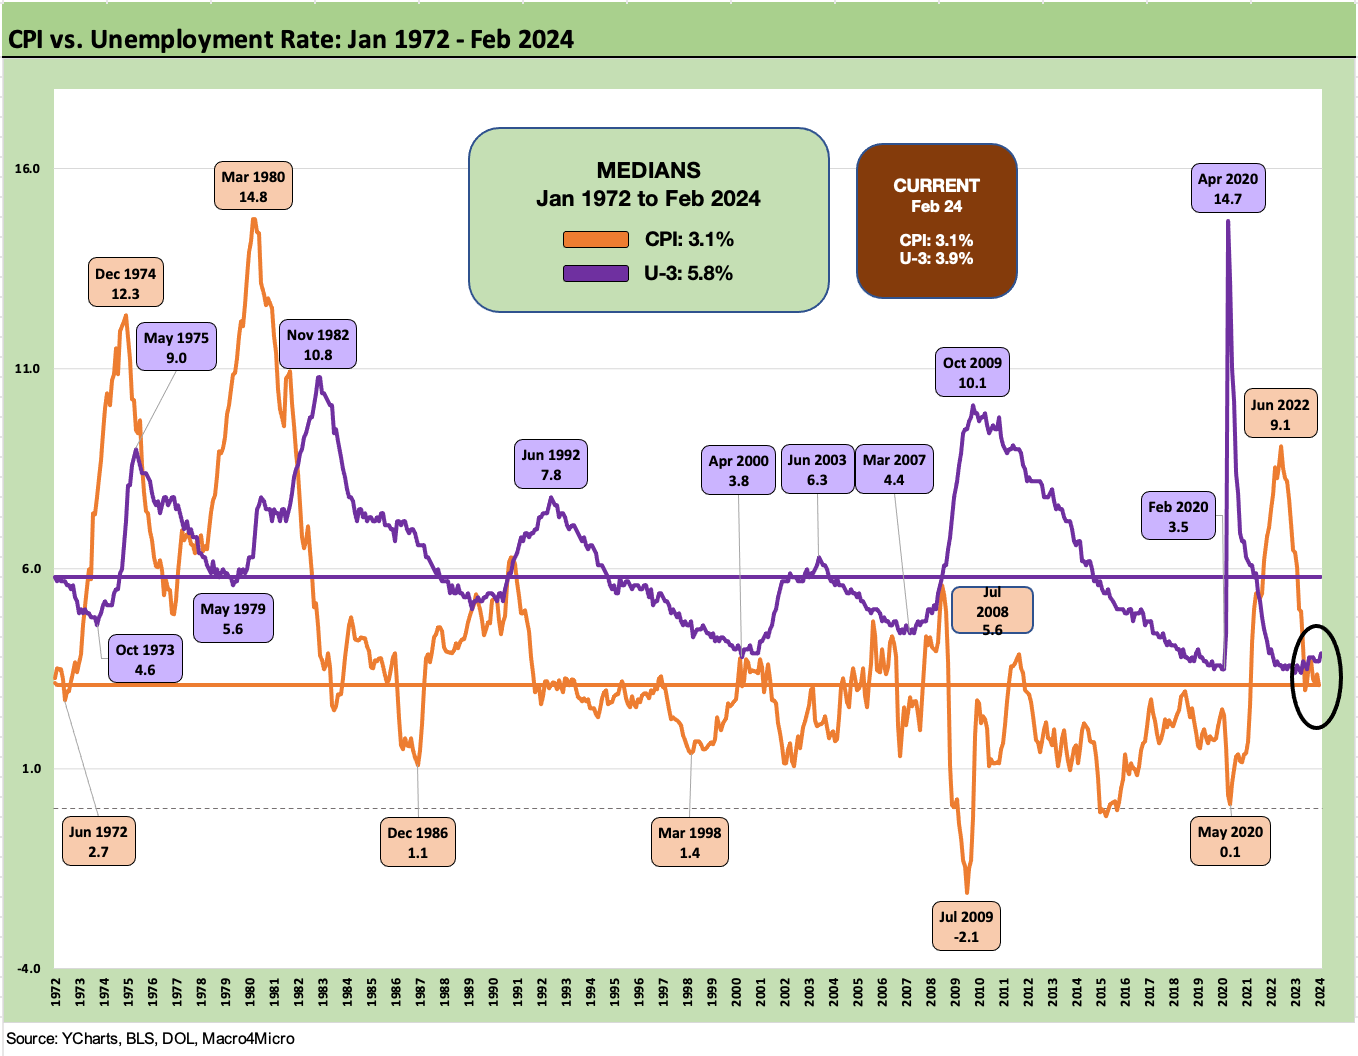
The above chart takes you down memory lane showing the two components of the Misery Index (Inflation + Unemployment Rate). The current 7.0% on the Misery Index is a long way from the 22% of June 1980 when I got off the train to start a job in NYC.
The running occupation deltas…
In this next section, we update the running deltas using time horizons from Jan 2020, LTM, YTD and MoM. We look at these each month, and the line items help demystify the story line around what sectors are fully recovered from COVID and which ones are outpacing the peer group within Goods-Producing categories, in Services, or across Government jobs.

The above chart breaks out the payroll headcount deltas for the increase sequentially from Jan 2024 to get to the Feb 2024 payroll adds/declines by occupation. We see the increases led by Health care and Social Assistance followed by Leisure and Hospitality and Government in third. Construction more than doubled its payroll adds this month vs. January. Transportation and Warehousing stayed steady again this month.

The above chart plots the running deltas since Jan 2020 just ahead of the Feb 2020 cyclical peak. Feb 2020 started to show some risks of COVID by month end, but in March 2020 the pandemic exploded in the markets.
The 5.8 million jobs added since Jan 2020 have been addressed regularly in past commentaries, and it is important to remember these job adds are not post-COVID but relative to pre-COVID. In other words, this is real growth in jobs after recovering from the employment plunge of COVID. The year 2020 was punishing for jobs, and we have addressed the rebound in Jobs and the related policy support in other pieces (see Employment Across the Presidents 8-15-23).
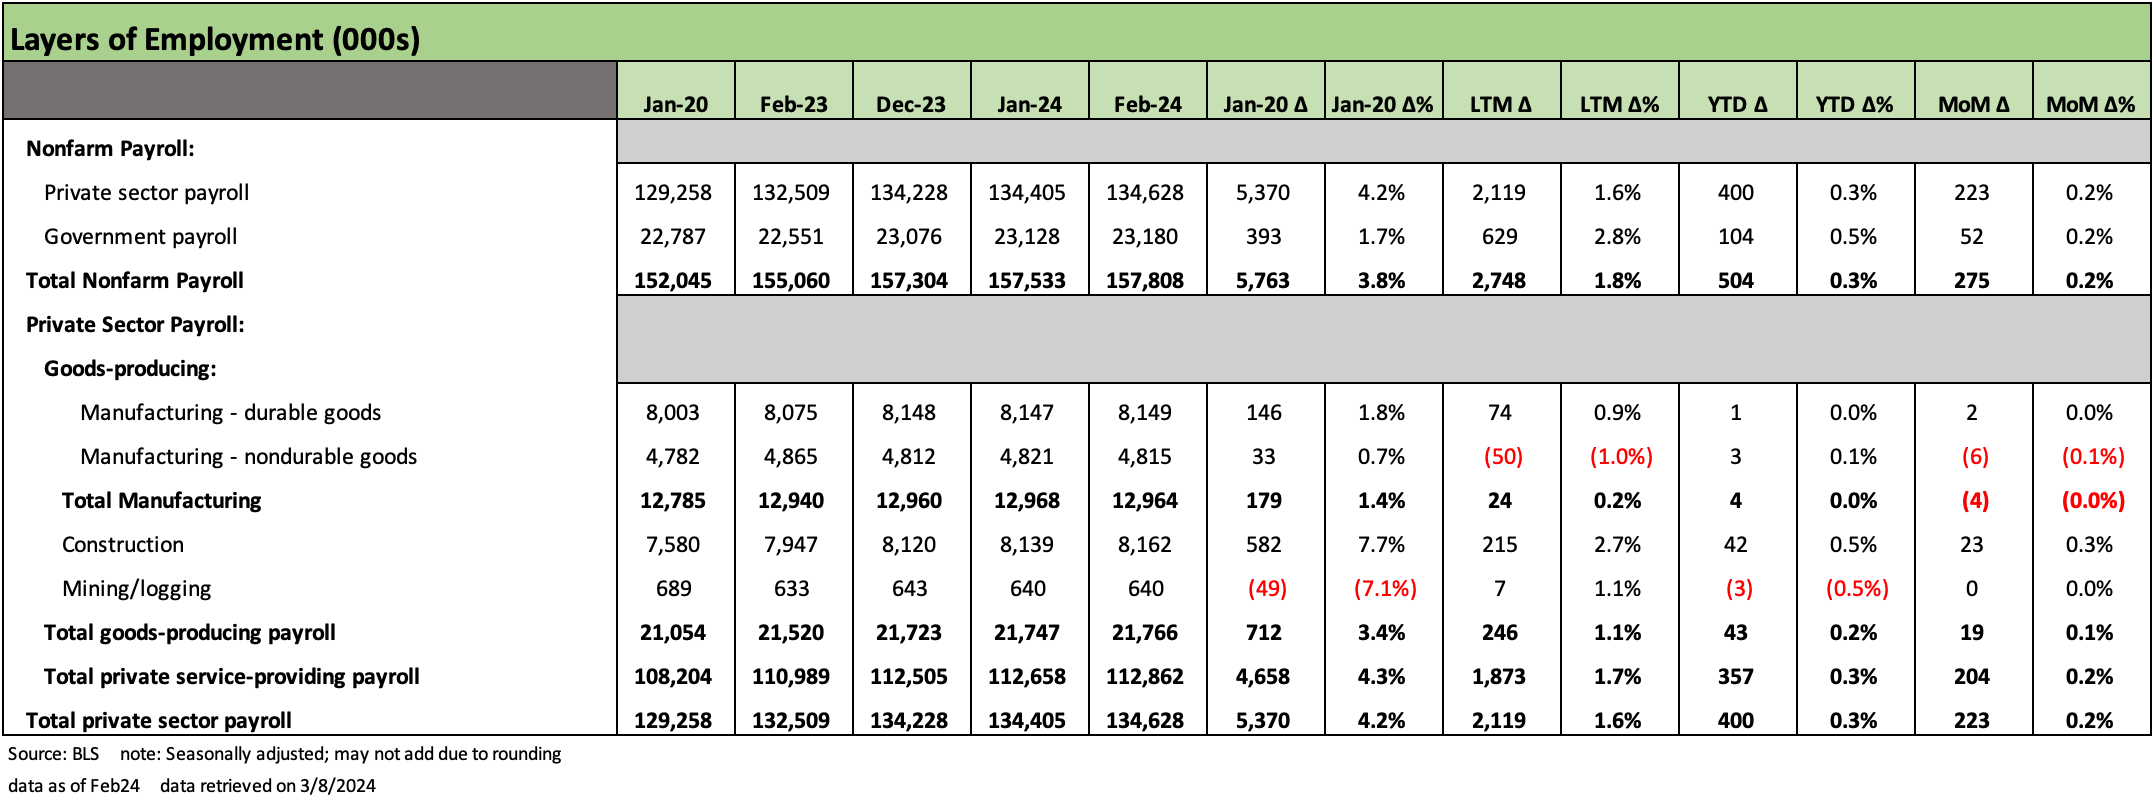
The above chart is the high-level, top-down look from total nonfarm payroll across private sector buckets of Good-producing and Services as well as Government. The private sector increases of 2.1 million LTM, 400K YTD, and +223K MoM are not sending recession signals.
The running increase for total nonfarm payroll from Jan 2020 of 5.76 million is dominated by the private sector increase of 5.37 million topped off by the Govt increase of +393K. Within the Goods-Producing category, the Construction delta of +582K dwarfs Manufacturing’s +179K. The Services sector is still the leader by far at +4.66 million from Jan 2020.

The running Manufacturing payroll deltas have defied bullish views on a Manufacturing renaissance, but the Construction payroll count has been a major policy beneficiary in the goods sector beyond Manufacturing.
Durables overall only posted a +146K rise since Jan 2020, and that was dominated by Transportation Equipment led by expansion in Motor Vehicles with smaller contributions from Machinery and Computers/Electronics.

Nondurables remains a recurring weak bucket for jobs on adverse secular trends and offshoring. Food Manufacturing and Chemicals remain limited pockets of strength in Nondurables.

Construction across nonresidential and residential has been a solid source of labor demand as evident in the above line items. We see +582K since Jan 2020 and +215K LTM.

The fact that the US is a services economy is hardly news, and that is evident in the wide range of job deltas by Services line items. The LTM adds of 1.87 million rule the roost with +357K YTD and +204K MoM.

The Government has been in hiring mode since Jan 2020 (+582K) and LTM (+215K), so that is not a sign of tax base weakness or an inability of the State and Local hiring to find money to hire. The +393K since Jan 2020 sees State and Local at 2/3 of that hiring, but the more telling sign of economic strength is the much stepped-up base of hiring on an LTM basis at +629K and 86% of that at the State and Local level.
If the US is in such bad shape, their state and local budgets seem to be surviving. A look at the State and Local mix of employment trends and hiring rates might call into question some of the political gloom and doom themes one hears from so many politicians overseeing these budgets.
Summary
The trend lines and mix across the various top-down angles and the occupational line items are still about solid employment metrics by any standard. The subset of drawbacks is what we often see in the form of underemployment and a labor force that wants to do more, make more, and have more choices. That is hardly a new problem, but in terms of what drives the PCE line of GDP, the resilience is very much in evidence. As we cover in other pieces, wages are growing, and the pricing power of labor has been demonstrated to be as good as it has been for numerous cycles.
Where the job menu goes from here will be intertwined with the economics of protectionism, government incentives, industrial policy action in areas such as tech and manufacturing and how well some services sectors hold up as the lead employers. There is always a lot of talk from the political realm on what they will do to help education and training, but then the execution remains high with deficits high and politics toxic.