
Footnotes & Flashbacks: State of Yields 3-16-24
A tough week for duration on mixed inflation and economic data comes just ahead of the FOMC meeting and new dot plots.


The week was tough for UST bulls as CPI and PPI failed to cooperate, Retail Sales and Industrial Production sent mixed signals, but at least credit spreads tightened on the week.
The consumer waiting game will see more housing data (starts, existing home sales) this coming week after the Freddie Mac 30Y interestingly ticked lower again, but affordability is still not a pretty story for housing with the golden handcuffs theme still intact while housing inventory pressures support prices.
With the FOMC meeting, the new dot plot is likely to be at the top of the suspense list this week as the market seeks more objective (sort of) signals on the number of cuts in 2024.
Crossing the $80 crude oil line this past week did not help the inflation mood much after CPI saw some energy pressure in Feb even before the latest oil shifts as refining turnarounds ahead of peak driving season also brought some imbalances.

The above chart plots 3 curves and includes a box detailing the UST shift from the 10Y UST peak date of 10-19-23 to this past Friday close (3-15-24). We also detail the upward shift in the UST curve YTD. This has not been an easy start to 2024 for UST bulls. The absolute yield levels are posted at the top of the chart.

The above chart details the UST long march from the end of 2021 across some key timelines to the current level posted on 3-15-24. The UST curve is still above 12-31-22 levels after a year of inflation battering that peaked in June 2022. We note the UST pullback in March 2023 after the regional bank crisis reared its head. The June 2022 UST curve that we post above was during the peak month of inflation.

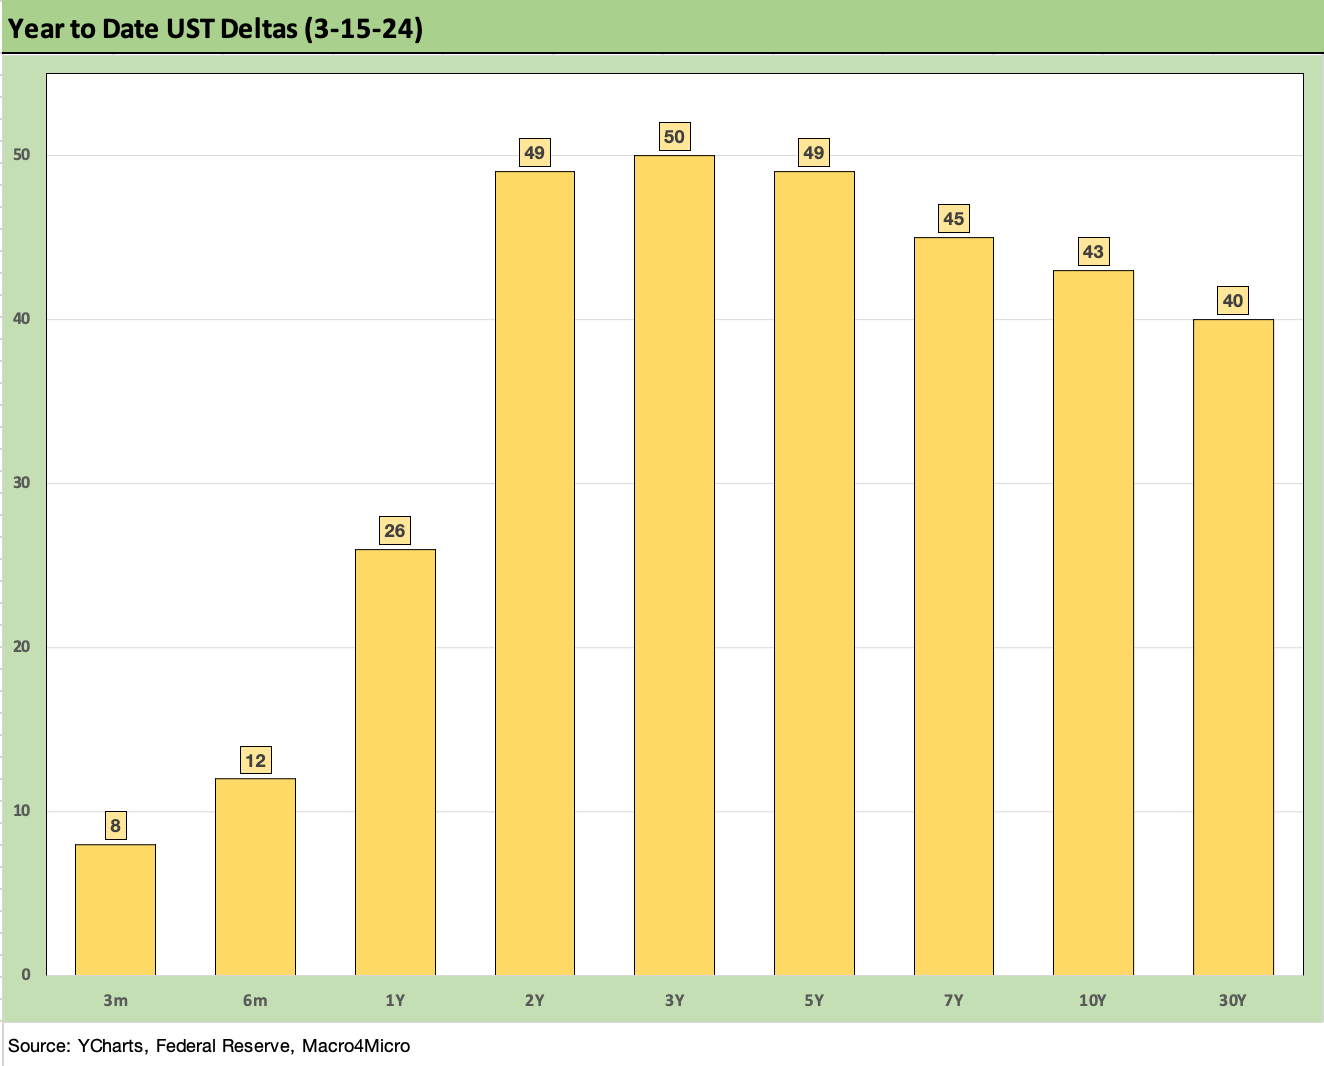
The above chart shows the 1-week UST deltas as the curve shift hurt bond returns with inflation not bringing enough confidence to the market ahead of this week’s FOMC meeting. This week brings the next round of FOMC forecasts and the always-enjoyable dot plot counting exercises. We see the 2Y to 10Y shift higher in the 20-bps handle range with a more modest move for the 30Y.

The above chart updates the UST downshift since the peak 10Y UST rates were posted in the third week of October (10-19-23). That came ahead of the extremely bullish risk rally and UST rebound to wind down the year in Nov-Dec 2023.
The above chart updates the adverse shift in the UST curve for fixed income YTD. After the monster late year rally, the UST curve is still well inside Oct 2023 levels but struggling with the balance of data points. We routinely cover the mix of economic metrics that are working well for the economic picture with employment and the consumer’s propensity to keep spending at the top of the list (see links at bottom).
We have seen slowing inflation and more optimism around cyclical and economic fundamentals. That is good news for the economy but presents the risks of a stall in the fed funds cuts. The inflation metrics have been supportive with 2% handles for PCE inflation (both headline and core) and CPI doing well with 3% handles for headline and core.
The trick is the last stretch of road for PCE to get to the 2.0% line. The demand side of the equation for consumers had not faded enough yet even if it has slowed down from stretches of 2023. Manufacturing has been soft but not folding on the cycle by any stretch. Autos are solid, cap goods mixed, and construction markets riding a wave of mega projects.
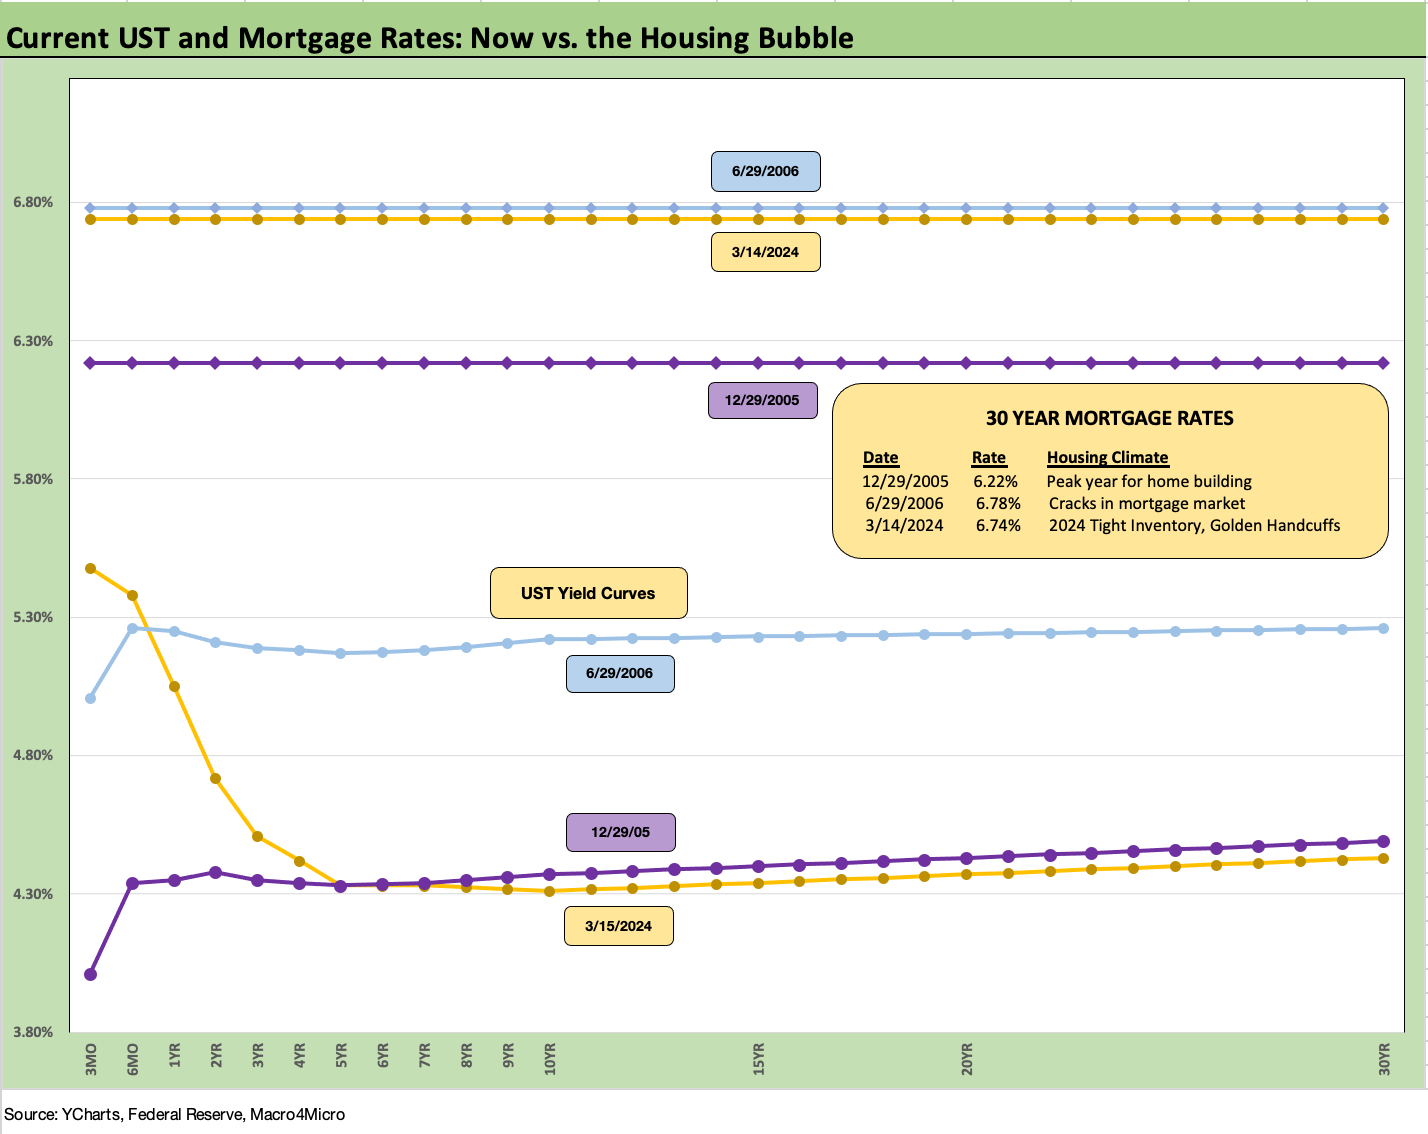
The above chart updates the Freddie Mac 30Y mortgage using the most recent benchmark date (released on Thursdays) and the Friday close for the UST curve. We also post the Freddie Mac 30Y and UST curve for the end of 2005 and middle of 2006. The Freddie Mortgage levels are along the horizontal lines, and we detail them in the box.
We choose those two dates in 2005 and 2006 for historical significance. The year 2005 was the peak homebuilding year and the housing market and mortgage borrowing was smoking hot. By mid-2006, the subprime RMBS market was starting to get some practitioners nervous, but mortgage origination was still booming before the wheels fell off the bus in 2007.
Today’s Freddie Mac rates are near 2005 and 2006 despite the lower UST rates (correction from an earlier chart draft). The UST in 2024 is well below mid-2006. Mortgage spreads and high home prices today bring the headwinds while the lack of inventory (notably in existing home sales) and high demand are protecting home valuations and home equity.
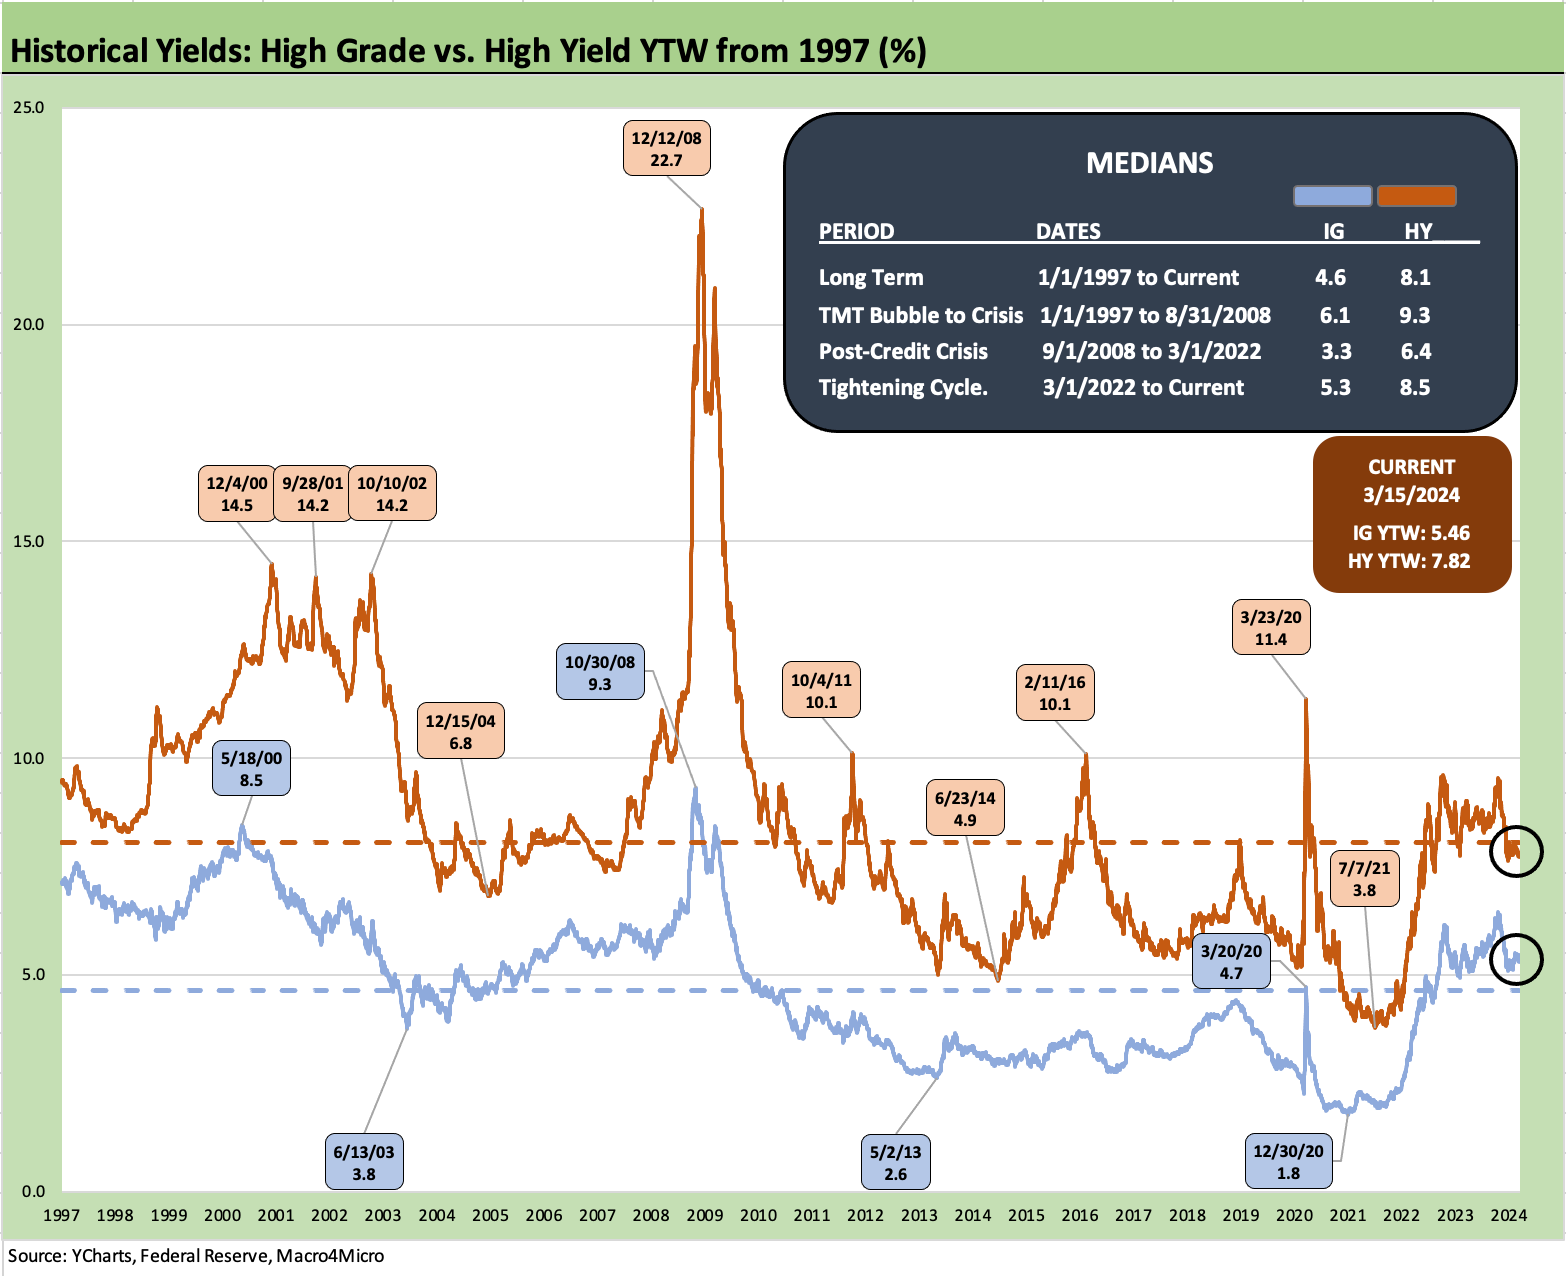
The above chart plots the time series for IG index corporate yields and HY bond index yields across the cycles from 1997. We detail some notable highs and lows across time. We include the medians for various time horizons including a long-term median and a pre-crisis median. In this narrow case, pre-crisis is defined as before Sept 2008 when Lehman and AIG melted down and Merrill merged into BofA.
We see that 9.3% pre-crisis HY median from 1997 to Aug 2008 as the most relevant since it is before the ZIRP years. When looking at these yields, we also should highlight the mix distortions with today’s BB tier mix in the HY index much higher. We also see a much-enlarged IG investor base dipping down into the BB tier today than in bygone years.
The takeaway is that the 7.8% HY index yields is compelling for many investors, but that is more in the context of ZIRP year comparisons than when framed against “normal” HY markets. That comes with a caveat that the definition of “normal” in HY has been a challenge given the 1980s and 1990s ahead of the credit crisis in 2008.

The above chart uses the same approach in framing some historical comps as we did with mortgages and the housing bubble years. In this case, we plot IG index yields from credit cycle peak periods in 1997 and 2007. We also plot the UST yields for current levels, 2007 and 1997. We plot the IG index yields along the horizontal lines for each.
The UST yields are clearly in a different zip code relative to the 2007 and 1997 peak credit markets. The IG Corporate Index yields are also priced at tight spreads as during those earlier peaks, but the UST curve is the main driver of the index differentials. The sequential lift this week from the prior week’s yields rode the UST curve with IG spreads narrowing.
IG spreads tightened slightly over the past week by -6 bps (ICE) to +93 bps, continuing within a narrow, tight OAS range. As frames of reference, the Friday close on the IG index spreads are inside those seen at the end of June 2007. The IG OAS is on top of the +93 bps average of 1H04 to 1H07. The 1H07 period alone averaged +86 bps. The all-time low for IG was +53 bps in Oct 1997 before reaching +70 bps at the end of 1997 and averaging +95 bps for 1997-1998. It safe to categorize current IG spreads as quite tight right now even if well above the 1997 lows.
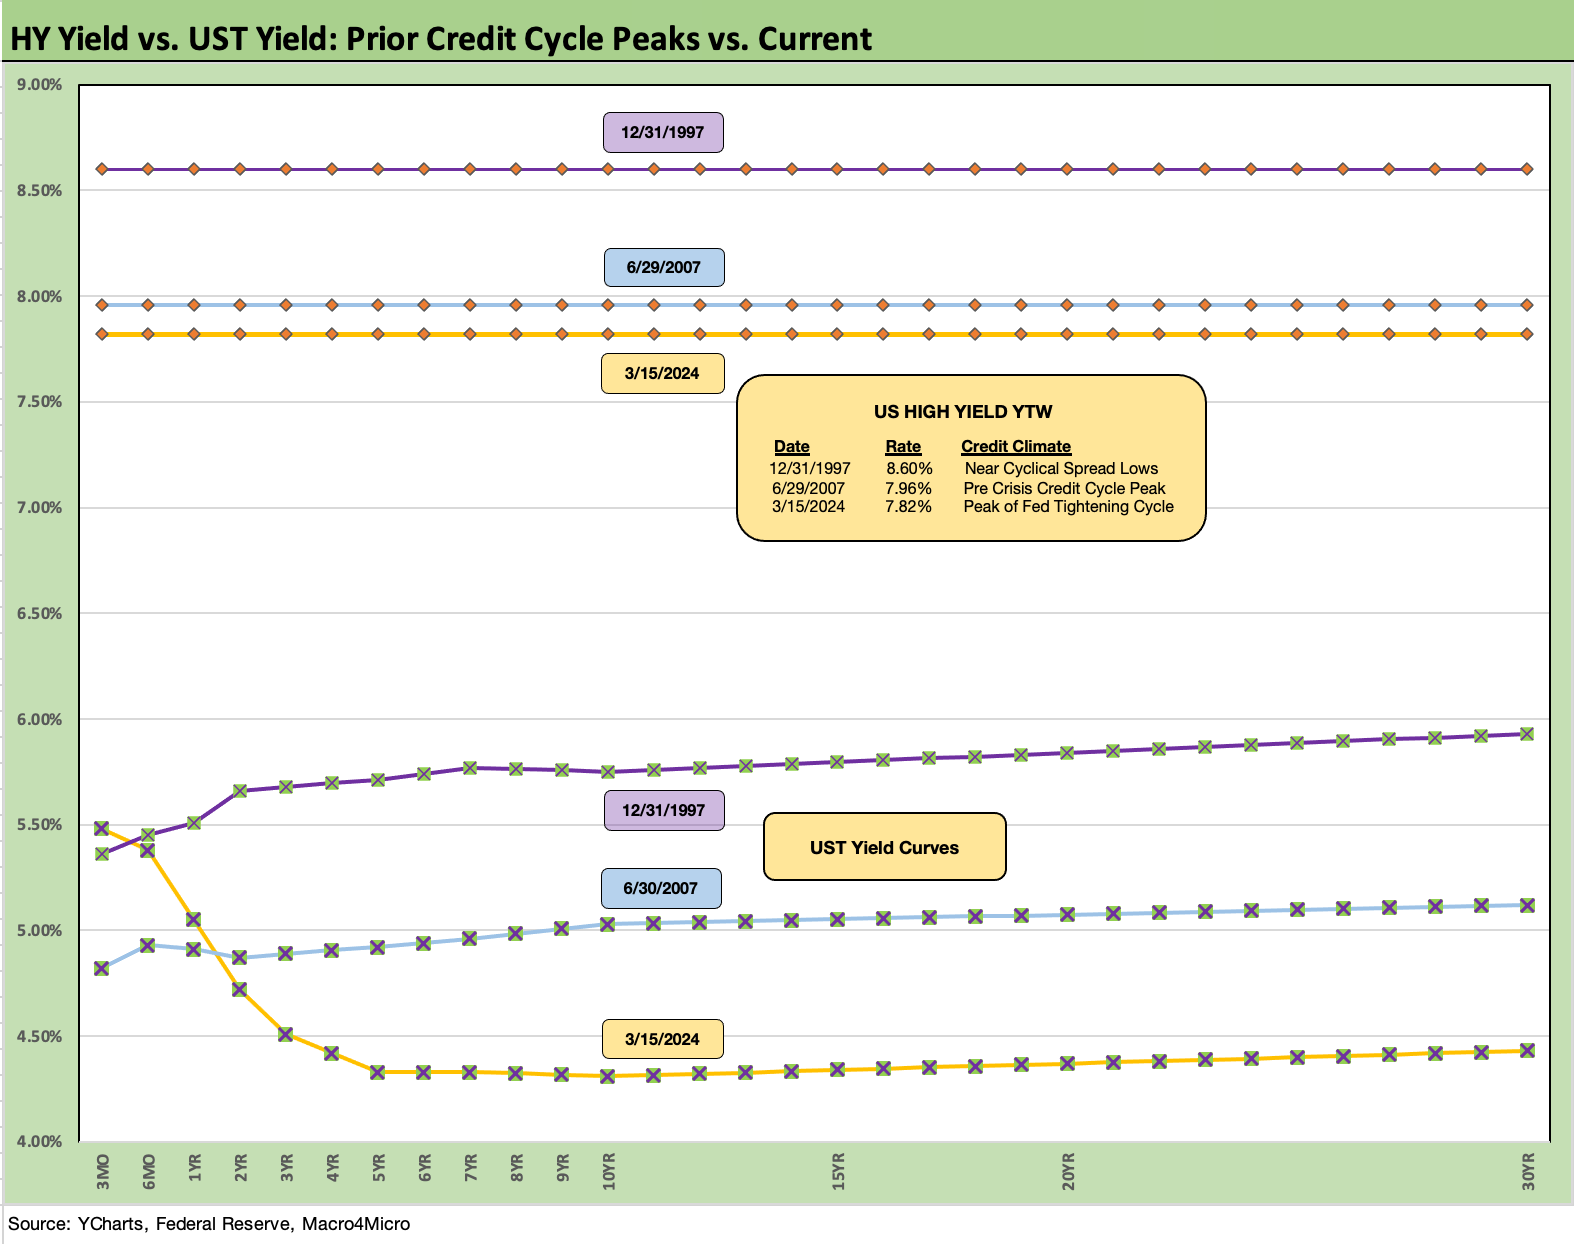
The above chart does the same drill as with IG framing the HY index yield and UST curve for Friday close vs. the credit peaks of 2007 and 1997. The yields to end last week for US HY are lower than 1997 and 2007 on a materially lower UST curve but with spreads wider today than the sub-250 bps lows of June 2007 and Oct 1997.
The 10 bps OAS tightening last week to +316 bps is below the June 2014 lows of +335 bps (6-23-14) and on top of the Oct 2018 lows of +316 bps (10-3-18). History shows that spreads can stay compressed for a long stretch of time. As an example, the +270 bps average of 2H97 and +298 bps in 1H98 tell a story of resilience. That period also offers a reminder of how it can get ugly when the market turns. Spreads can turn with a vengeance as we saw in 2000-2002. That gets back to the same old challenge of deal quality and chasing spreads in a compressed market.
We do a more detailed review of HY spread histories in the 2023 recap (see Footnotes & Flashbacks: State of Yields 1-1-24) and in the links below covering quality spread histories.

The above chart plots the 3M to 10Y UST slopes from 1984 across the cycles through the end of this past week (3-15-24). We like the 3M to 10Y curve since it really hammers home the viability of cash as a low-risk asset allocation decision in this market until an investor’s confidence is higher on the curve and the credit vs. duration trade-off.
Investors can reallocate quickly whether in stages or all at once. In the push-button world, you could be fully invested out of cash concentration in minutes. That is the flip side of being able to generate a push-button run on regional banks. Allocation out of 3M UST into 10Y UST is not a major time challenge.
The basic pattern of “ease into downturns” and “tighten into upturns” has been taken for granted, but there is a lot more to the story than that as we have covered in our research in past pieces. There is nothing like the 2022 inflation spike and rapid tightening in this time series from 1984 even if we had a wild and unexpected tightening and bear flattening in 1994.
It is safe to state that the 2022-2023-2024 experience in inflation and tightening pales in comparison to what unfolded in 1980-1981 whether in the aggression of monetary policy or the absolute level of interest rates. The same is true of the record inversion and record steepening from the short end under Volcker during those 2 years. That stagflation market backdrop has been covered in other commentaries (see UST Moves 1978-1982: The Inflation and Stagflation Years 10-18-23).
The current -117 bps inversion of the 3M to 10Y UST is well inside the inversion peaks noted in the chart. When holding it up to the +162 bps long-term median from 1984, the scale of the inversion in a growing economy with low unemployment and a 3% CPI handle is still one for the ages. That is especially the case with 2% handle PCE inflation and superior growth in the recent economy relative to the past two decades.

The above chart shows the short-term timeline from the start of 2021 and the upward sloping curve through last week. We include the long-term UST segment slope medians and the current slopes in the embedded box.
The peak slope since the start of 2021 was +227 (5-6-22) and the peak inversion was -189 bps (5-4-23, 6-1-23). That rolled into a median for the short time series of +30 bps.
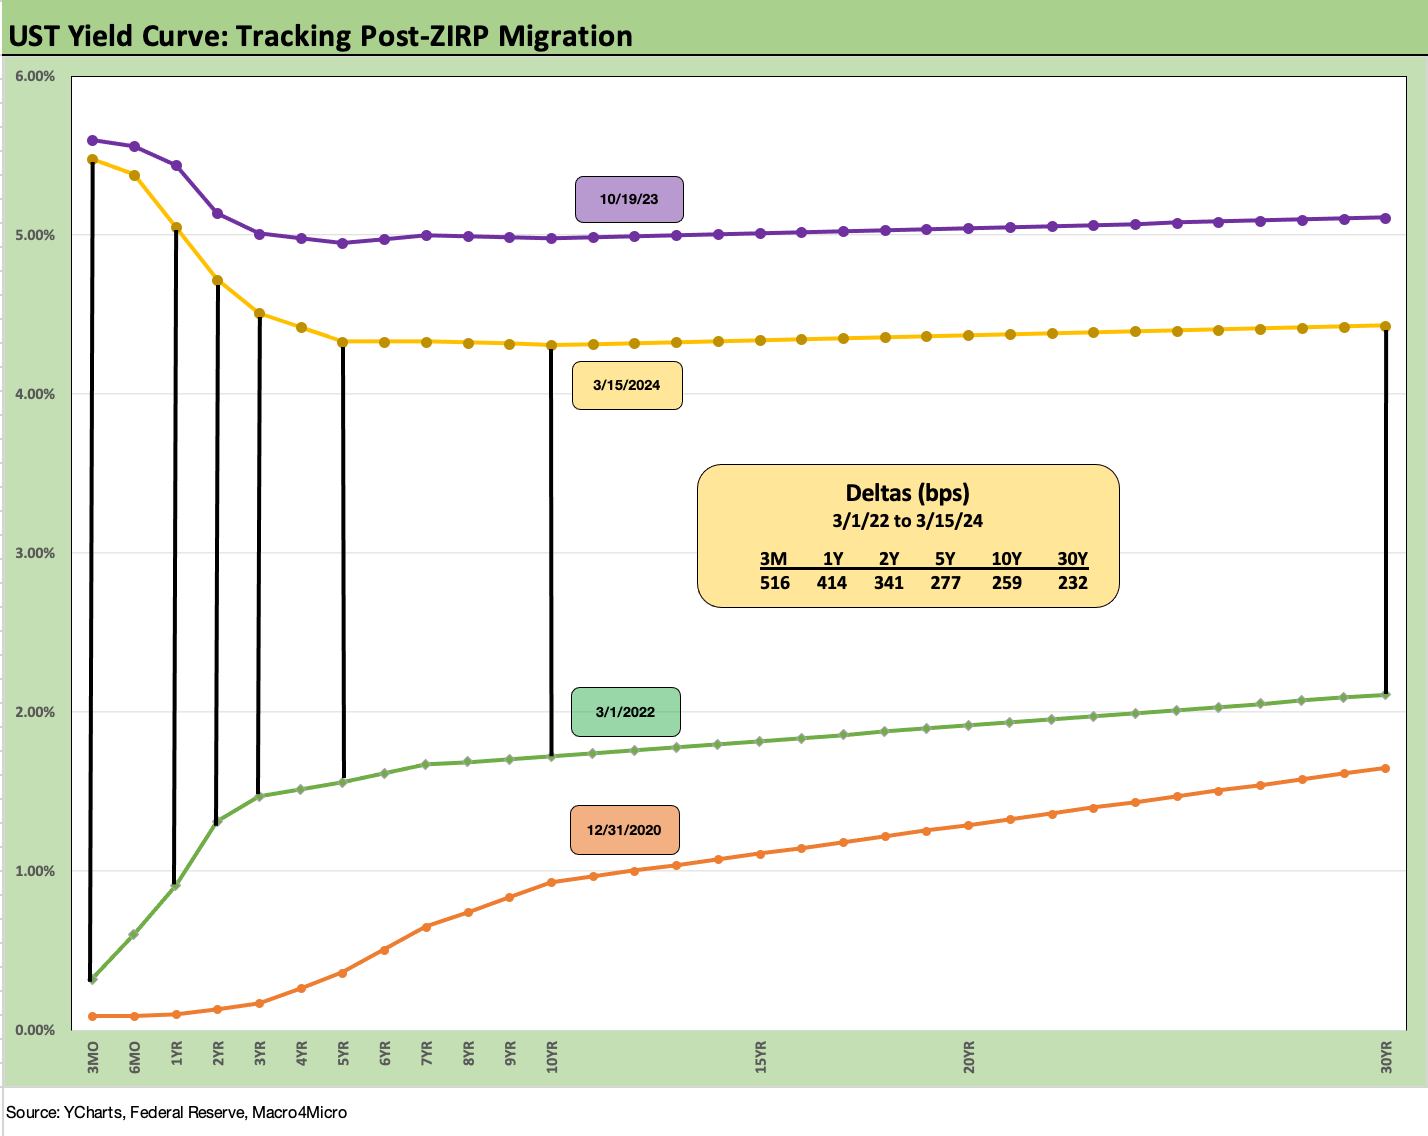
We wrap with our usual final chart that plots the migration of the UST curve and deltas from 3-1-22 during the month ZIRP ended (effective 3-17-22) through this past week. We also include a 12-31-20 curve as a frame of reference and the 10-19-23 UST curve when the 10Y UST peaked.
The UST delta numbers included in the box show the numerical journey from March 2022 to March 2024 as the upward sloping curve passed through a bear flattener on the way to a bear inversion. We hit the two-year anniversary this weekend on the Fed implementation date (March 16 was the statement date to end ZIRP, the policy was effective March 17, 2022).
The lack of clarity in the data-dependent course of decisions ahead keep the market focused on every indicator these days (even if we don’t write on them all). Inflation releases are always major priorities to check out the line items mix, but this week will be all about dot plots as the FOMC weathervanes. They have all given plenty of speeches to this point.
See also:
Industrial Production: Capacity Utilization Shows Manufacturing Edging Higher 3-15-24
Retail Sales: Consumers Will Stop Shopping…Someday 3-14-24
CPI Feb 2024: Extra Innings 3-12-24
Employment: Real Numbers vs. Fictitious Dystopian Hellscapes 3-9-24
Payroll Feb 2024: Record, Revisions, Reality 3-8-24
JOLTS Jan 2024: Holding at “High” Even if Well Down from the Peak 3-6-34
Inflation Gut Check Jan 2024: PCE Prices, Income, and Outlays Help the Story 2-29-24
4Q23 GDP: Second Estimate, Moving Parts 2-28-24
Banks: Leveraged Loans, Classified, Special Mention Mix 2-28-24
BB vs. CCC: Quality Spread Differentials, Yield Relationships, Relative Returns 2-20-24
HY vs. IG Quality Spread Differentials and Comparative Returns 2-6-24
BBB vs. BB: Revisiting the Speculative Grade Divide Differentials 2-5-24
Histories: Asset Returns from 2016 to 2023 1-21-24
Credit Performance: Excess Return Differentials in 2023 1-1-24
Footnotes & Flashbacks: Asset Returns 1-1-24
Footnotes & Flashbacks: State of Yields 1-1-24
Return Quilts: Resilience from the Bottom Up 12-30-23
HY Refi Risks: The Maturity Challenge 12-20-23
Coupon Climb: Phasing into Reality 12-12-23
HY vs. IG Excess and Total Returns Across Cycles: The UST Kicker 12-11-23
HY Multicycle Spreads, Excess Returns, Total Returns 12-5-23