
Footnotes & Flashbacks: Asset Returns 3-16-24
We look at asset returns as the mix of positive vs. negative returns had a very bad week at the office.

The return symmetry across the benchmark and ETF collection made a decidedly negative shift this past week as some ETF subsectors and industry groups see setbacks in the market and some earlier periods of the risk rally and curve shift drop out of the measurement timeline.
The curve was very unfriendly for duration this week, tech was volatile and biased toward the red, and regional banks and interest rate sensitive sectors are getting fresh rounds of second-guessing.
Energy is trying its latest comeback with oil back above $80 WTI while Financials, Builders, and Industrials are still holding in along with some other cyclicals.

The above chart updates the returns for the high-level debt and equity benchmarks we watch. In a week when inflation mildly disappointed again in the CPI and PPI releases, the stock and bond markets both show the Fed anxiety factor.
Duration was a loser on the week as we cover in our separate Footnotes publication on yields (see Footnotes & Flashbacks: State of Yields 3-16-24). The consumer news of late has been mixed, but the weight of consumer indicators is net positive for economic growth. It is hard to throw a panic on GDP without PCE contraction.
Manufacturing does not instill much confidence for GDP heating up, but numerous bellwether industrials are not too supportive of the UST bulls either. The sequential moves in industrial production the past week showed a modest firming in manufacturing despite weakness vs. stretches of 2023.
Among notable problem areas ahead of the auto spring selling season is the increasingly dark tone on EV demand, related capex, and possibly scaling back on aggressive plans as already seen in some quarters. The “I hate EVs” election plan by Trump to counter the Biden EV optimism will raise the visibility on any signs of weakness in EVs.
Tech equities felt a case of nerves this week. The Magnificent 7 rang up more negative than positive and tech was slightly bruised. We look in more depth at the mix of narrow industries and 31 benchmarks/ETFs that we track in the weekly metrics further below in this commentary.
An adverse yield curve shift on the week hit bond returns. The inversion is still extreme from 3M UST to any maturities you choose, and that has been the case since the tightening cycle was hitting its peak. We cover the inversions in historical detail in the Footnotes publication for yields.
The UST inversion as a predictive metric for cycles can often shift into the “correlation vs. causation” debate and whether the UST curve is “a cause or symptom.” There is no question that higher rates can be a fundamental problem for leveraged corporations with floating rate debt and for indebted households, but a low UST curve that is upward sloping does not help consumption if you are unemployed. “Credit availability” and credit contraction are critical variables in the growth picture even if rates are higher.
This latest cyclical backdrop includes the first major inflation fighting battle since Volcker, but the current interest rate backdrop also came with supplier chain distortions and supply-demand imbalance. These imbalances were unprecedented in the postwar economy on such a scale (i.e., oil embargoes were painful in 1973-1974 and 1979 but narrow in range), and the economy is proving diverse enough to push through the current pressures even at the cost of inflation.

The above chart updates the 1500 and 3000 series as the Energy sector is now the only one turning in strong numbers for the trailing 1-month period. We still see an impressive set of numbers for the rolling 3 months with the notable exception of Real Estate with the curve going the wrong way and asset quality in some major subsectors getting more than their share of bad headlines.
We line the asset returns up in descending order of 1-year total returns with a very good year in the rear view mirror and the divergence in returns showing up after the UST curve started to swing around and oil prices were increasingly volatile after the wild times from Russia-Ukraine.
The rolling return visual
In the next section we get into the details of the 31 ETF and benchmarks for trailing periods. The collection of four time horizon charts below has broken with recent Footnotes publications with the negative return side of the scoresheet exceeding the positive side for the past week.
As more weeks tick off in 2024, we see more of the bull run to end 2023 start to give way to more measurement periods that include adverse UST moves hurting duration and some limited but important negative news flow in such major areas as EVs, regional banks, and some asset quality weakness in real estate.

The above chart is starting to show a dose of adverse shapeshifting away from the positive return symmetry seen in prior weeks. For the 1-week period, we see a setback in performance in our group of 31 with 9 positive and 22 negative total returns after 25 positive and 6 negative last week. That compares to a winning streak across the prior weeks at 23-8, 29-2, 16-15, 18-13, 21-10 and 26-5 for the remainder of the rolling 8 weeks.
This past week had the worst “Win-Loss” score since the first week of 2024 when it weighed in at 6-25. After mixed weeks in January, the positive bias had been steady until this past week. The FOMC is likely to drive this week’s results with PCE not reported until the following week.
The 1-month time horizon posted only 1 negative last week and the 3-month had all positive and no negatives, so the needle is moving against the recent pattern as curve forecasts shift and valuation challenges bubble up in the market. On a positive note for the LTM period, we see only 3 negative return lines above when last week had posted 4 negative.
The Magnificent 7 heavy ETFs…
Some of the benchmarks and industry ETFs we include evidence issuer concentration elements that leave them wagged by a few names. When looking across some of the bellwether industry/subsector ETFs in the rankings, it is good to keep in mind which narrow ETFs (vs. broad market benchmarks) get wagged more by the “Magnificent 7” including Consumer Discretionary (XLY) with Amazon and Tesla, Tech (XLK) with Microsoft, Apple, and NVIDIA, and Communications Services (XLC) with Alphabet and Meta.

As noted earlier, the 1-week time horizon finally revisited some net negative scores as we saw in January with 9 positive and 22 negative. The past week was a negative one for the Mag 7 collection overall and TSLA notably in the red on the week.
We see numerous benchmarks and broad market ETFs in the red including the S&P 500, the Equal Weighted S&P 500 (RSP), NASDAQ (IXIC), Mid Caps (MDY), the Equal Weighed NASDAQ 100 (QQEW), and the small cap Russell 2000 (RUT). That is a wide swath of companies across that mix of benchmarks when we drop in the equal weighted benchmarks for the large cap indexes.
Regional Banks (KRE) was sitting on the bottom again the past week, the long duration 20+Year UST ETF (TLT) was next to last, and the rate sensitive (and in some cases quality-questioned) Real Estate ETF (XLRE) was third off the bottom. The 6 bond benchmarks were in the red.
The limited group of winners within the top quartile included 3 energy-related ETFs with Energy (XLE) closely followed by E&P (XOP) at a healthy margin ahead of the group and Midstream (AMLP) at #6. Seeing Materials (XLB), Base Metals (DBB), Financials (XLF), Builders (XHB) and BDCs (BIZD) in the positive range was not a cyclically bearish signal.

The 1-month horizon moved from only a single line item in negative zone last week (Transport XTN was barely negative last week) to 22-9 this week. The performance was tied in part to pockets of tech weakness (QQEW) and Mag 7 heavy ETF weakness (XLC, XLY) and the yield curve shift sending 3 bond ETFs into the red across AGG, TLT and GOVT. Small caps had a mild sell-off and Regional Banks (KRE) were under the headline gun again.

The biggest shift is the 3-month with a move from no negative returns to 8 of the 31 in the red. We see 4 bond ETF returns in the red for 3 months and Regional Banks (KRE) again getting pummeled. The long duration UST ETF (TLT) was hit harder on the UST move than LQD, GOVT, and AGG. We see Real Estate (XLRE) again penalized by the UST move.
The winners over 3 months now see AMLP on top ahead of Builders (XHB) on the moving timeline and the late 2023 shift in the starting point. The top quartile shows some reasonable diversity beyond the Mag 7 influence with Builders (XHB), Financials (XLF), Mid Caps (MDY), the typically volatile Energy peers (AMLP, XOP, XLE), and Health Care (XLV) with Industrials (XLI) at #9 in the mix.
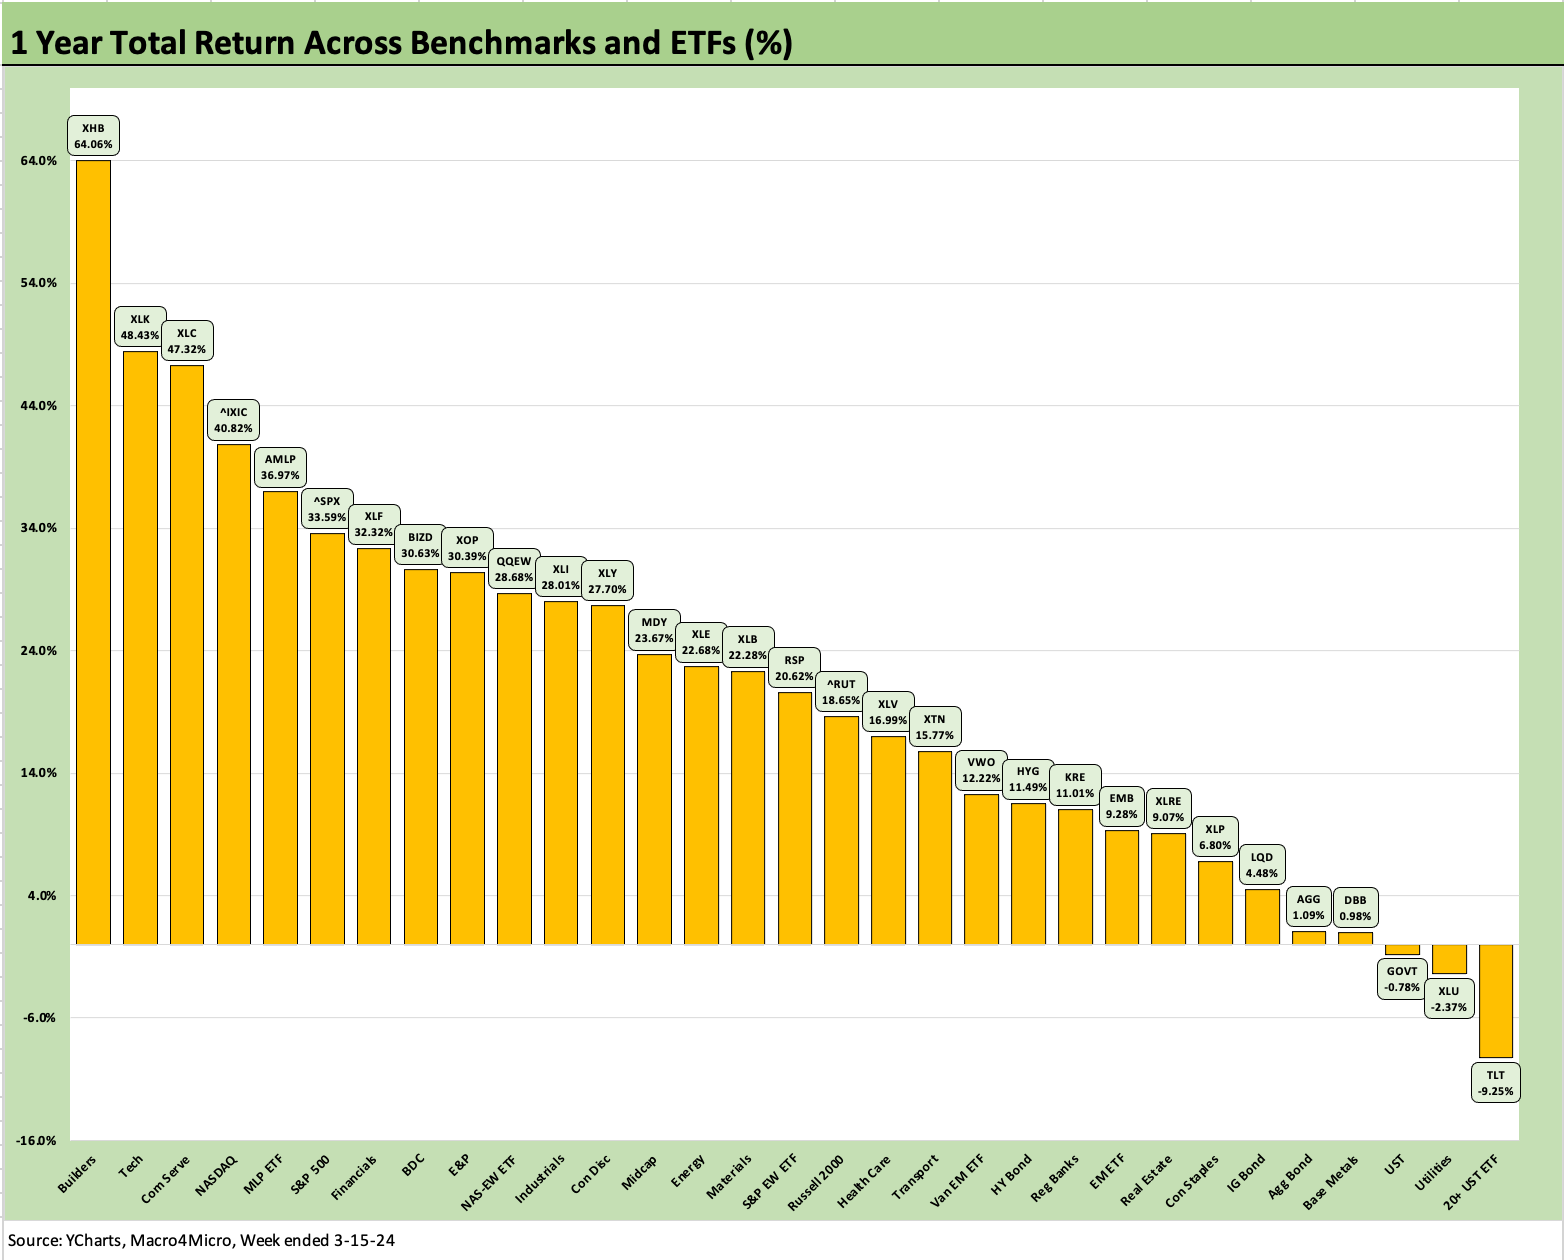
The trailing 1-year has not realigned too notably with only 3 in the red after last week showing just 4 in negative range. For this week, the changes in the start date within March 2023 took the peak of the regional bank crisis out of the measurement and allowed Regional Banks (KRE) LTM return to jump out of last place and move well up the rankings. The bottom 3 above include the long duration 20Y+ UST ETF (TLT) in last place with the GOVT ETF 3 off the bottom in a small group with the interest rate sensitive Utilities ETF (XLU).
We see a big week ahead with the FOMC decision and forecasts likely to generate a lot of strong opinions for or against the UST status quo (or for or against the FOMC members!)
See also:
Industrial Production: Capacity Utilization Shows Manufacturing Edging Higher 3-15-24
Retail Sales: Consumers Will Stop Shopping…Someday 3-14-24
CPI Feb 2024: Extra Innings 3-12-24
Employment: Real Numbers vs. Fictitious Dystopian Hellscapes 3-9-24
Payroll Feb 2024: Record, Revisions, Reality 3-8-24
JOLTS Jan 2024: Holding at “High” Even if Well Down from the Peak 3-6-34
Inflation Gut Check Jan 2024: PCE Prices, Income, and Outlays Help the Story 2-29-24
4Q23 GDP: Second Estimate, Moving Parts 2-28-24
Banks: Leveraged Loans, Classified, Special Mention Mix 2-28-24
BB vs. CCC: Quality Spread Differentials, Yield Relationships, Relative Returns 2-20-24
HY vs. IG Quality Spread Differentials and Comparative Returns 2-6-24
BBB vs. BB: Revisiting the Speculative Grade Divide Differentials 2-5-24
Histories: Asset Returns from 2016 to 2023 1-21-24
Credit Performance: Excess Return Differentials in 2023 1-1-24
Footnotes & Flashbacks: Asset Returns 1-1-24
Footnotes & Flashbacks: State of Yields 1-1-24
Return Quilts: Resilience from the Bottom Up 12-30-23
HY Refi Risks: The Maturity Challenge 12-20-23
Coupon Climb: Phasing into Reality 12-12-23
HY vs. IG Excess and Total Returns Across Cycles: The UST Kicker 12-11-23
HY Multicycle Spreads, Excess Returns, Total Returns 12-5-23