
Housing Starts March 2024: The Slow Roll and Ratchet
Uneven Sequentially but Higher YoY is the Theme in Residential Construction.


Permits and starts move higher YoY in single family with more erratic MoM moves in 2024 as the major South and West regions drive a material rise in single family.
Units under construction sustain a consistently high rate of activity (SAAR and NSA) in single family and multifamily even as multifamily starts see a swan dive.
Completions tail off for March in total with multifamily down sharply sequentially from banner numbers in Jan and Feb as supply rolls into the market.

The Home Starts data did not rattle any cages this month, and single family volumes are still running ahead of the long-term median despite brutal mortgage rates showing average conventional rates on 30Y in the mid-7% range (source: Mortgage News Daily). The +21.2% YoY move in March 2024 still tells a favorable story for builders even with starts tailing off by -12.4% MoM from Feb 2024. Not seasonally adjusted March 2024 starts rose from Feb 2024 and single-family YTD starts NSA are at +27.1%. Homebuilder equities have performed well for a reason.

The above chart updates total monthly “not seasonally adjusted” Starts and Permits and the same for single family. Both were higher for starts and both higher for permits. That is enough to make it good news as challenges around mortgage rates and consumer risk appetites play out in the peak selling season ahead.

The above chart updates single family starts by region on a not seasonally adjusted basis. The good news is the 3 largest regions all rose sequentially with only the smallest Northeast region posting a small decline.
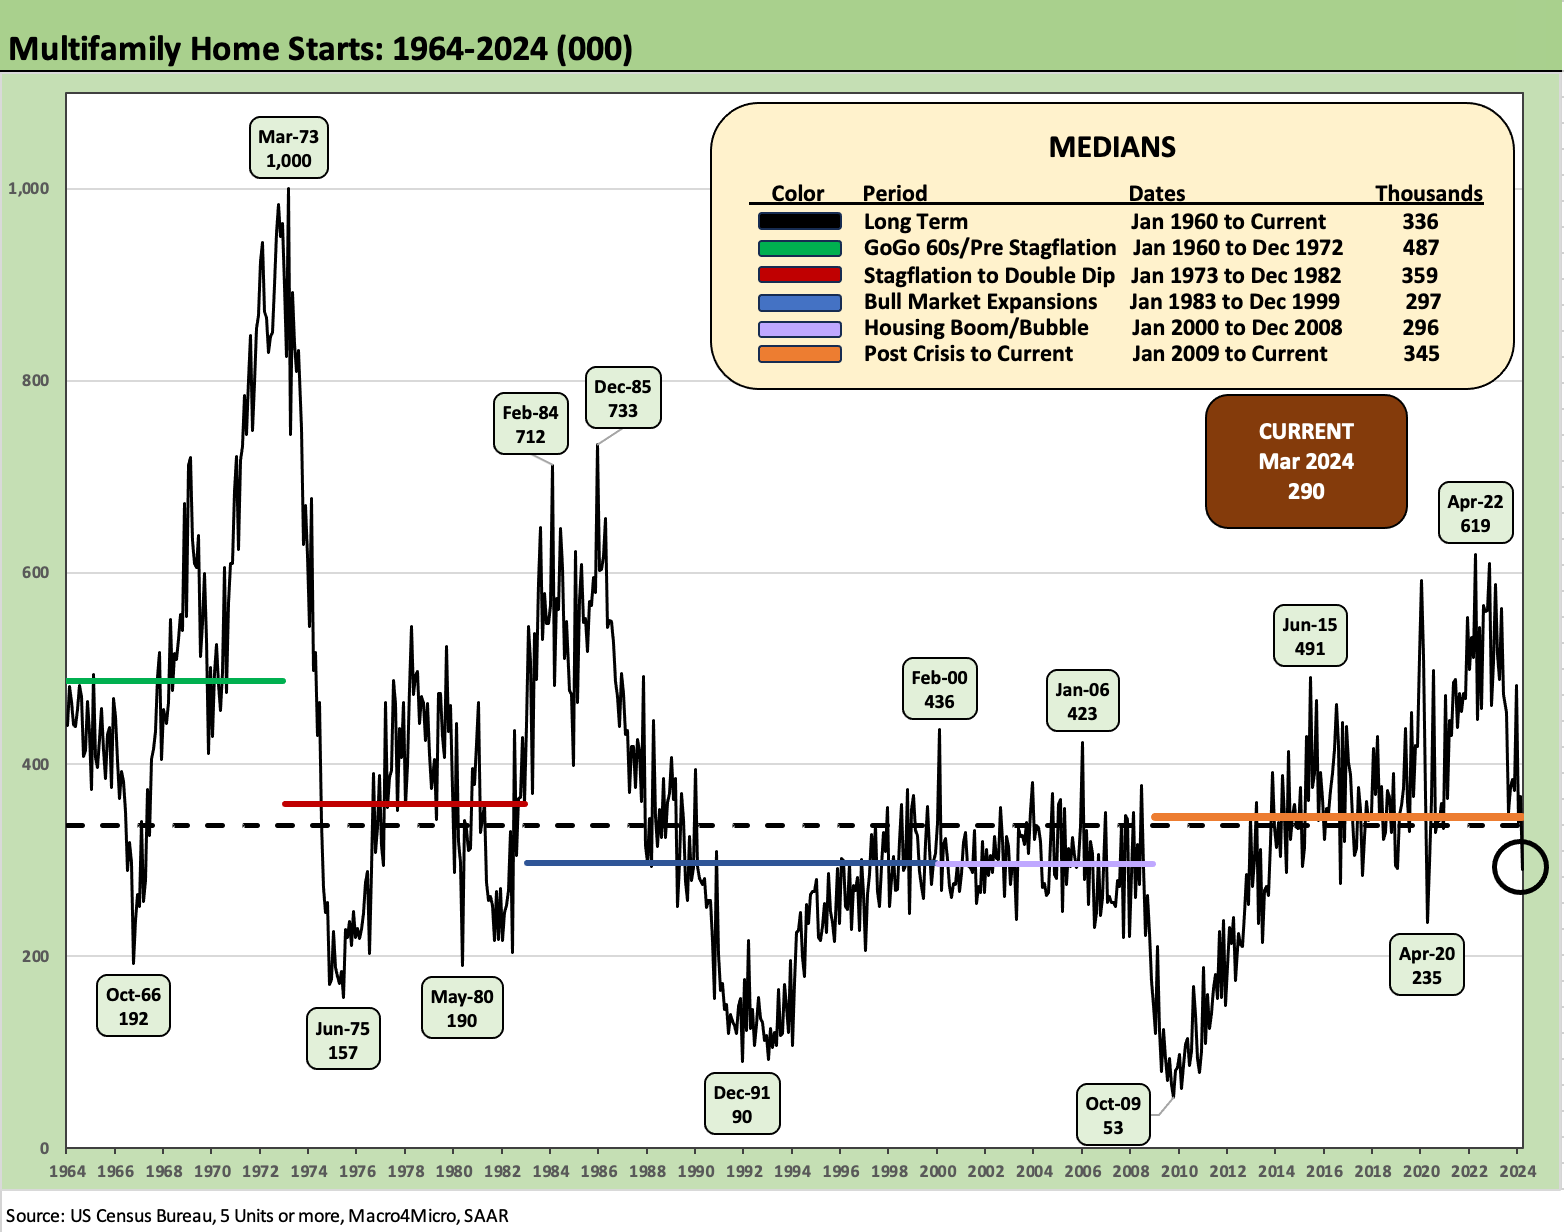
The above chart updates Multifamily starts on a SAAR basis, and we see a sharp decline of -20.8% sequentially and -43.7% YoY. More supply keeps rolling into the market from “under construction” to completion but the new construction activity is pulling back after a banner stretch. The current starts number for Multifamily construction is now below all the medians listed in the box above.

Multifamily permits have held up better than starts as detailed above with the MoM deltas at 0.0% even with the YoY change at -22.1%. The multicycle cyclical expansion is generally seen as over with “under construction” still running at -1.8% MoM and YoY at -1.6%.
See also:
Footnotes & Flashbacks: State of Yields 4-14-24
Footnotes & Flashbacks: Asset Returns 4-14-24
Consumer Sentiment: Do You Think Scary Thoughts 4-12-24
CPI March 2024: The Steeplechase Effect 4-10-24
Credit Markets Across the Decades 4-8-24
Credit Cycles: Historical Lightning Round 4-8-24
Payroll March 2024: Payroll Spike Brings a Political Theme Shift 4-6-24
PCE Prices, Personal Income & Outlays: Sideways Tone 3-29-24
New Home Sales Feb 2024: Hope Springs Eternal, but Demand Seasonally 3-25-24
Existing Home Sales Feb 2024: Surrendering to Mortgage Market Reality 3-21-24
Housing Starts Feb 2024: Rites of Spring on the Doorstep 3-19-24