
Existing Home Sales March 2024: Not Something Old, Something New
We look at existing homes sales for March with mortgages biting both potential sellers and buyers while homebuilders keep feeding the buyers.


Selling like hot cakes…
On a day when the largest US homebuilder reported strong numbers for the March quarter, existing home sales fade as the US curve flows into more mortgage pain and affordability headwinds keep life difficult for transaction volumes.
Only the higher price tiers showed increases this month with 4 of the 6 tiers lower including the sweet spot in the $250K to $500K area off by -8.1% accounting for 45% of the market.
The two price tiers that rose account for just under 20% of the market with $750K+ and $1M+ range.

The above chart updates the running LTM timeline for the existing homes sales variances YoY. The chart shows the shifting YoY changes in existing home sales volumes as the tightening cycle inflicted maximum damage during 2023 at a lag. The running trends in the post-tightening cycle period had turned positive on balance but this month moved back to negative for 4 of the 6 price tiers tracked. We also detail the price tier deltas in the final chart in this commentary.
The ability to find the right mix of economics for many homebuyers has sent more into the new home market as we have been covering in our housing research and in the single name work on the builders.
It is not a surprise that the worst damage has been done to the lowest price tiers since that is where the mortgage rate affordability strain would be hitting the seller and the buyer harder. Mortgage repricing is a headwind for many sellers of lower price homes and the past week saw a wide range above 7% (higher and lower subject to down payment and borrower quality).
The existing home seller may be looking for a move-up trade, and their dollar buys “less house” if they also need a new mortgage. They potentially carry a sub-4% handle mortgage rate, and that encourages waiting (and hoping) for a friendlier UST curve or a market that is not demanding such high mortgage spreads.

The above chart updates the inventory levels that have been a critical X-factor in supporting home prices (existing and new) in the face of the radical repricing of mortgages across 2022 into 2023 with a few touches at 8% for 30Y mortgages before moving back into the 6% range and now once again seeing 7% handles showing up in 2024. Strong demand and constrained supply have generally favored home equity values and kept valuations well above pre-tightening levels.

The above two-sided chart plots the existing home sales against new home sales volumes and frames them against long term medians. As we cover each month with the “new homes sales” release” (which always follows starts and existing home sales in the monthly sequence), the homebuilders have been picking up share in this tightening cycle. We get the final new home sales stats next week (Tuesday).
The demand profile for buyers is favorable in broad terms on demographics, but the affordability and timing of decisions has been a challenge. The starts for March were solid YoY (see Housing Starts March 2024: The Slow Roll and Ratchet 4-16-24). Supplier chains are mostly back to normal (not fully for some), so the builders have cited their ability to sustain strong margins even in the face of incentive costs and modest price erosion in their offerings.
Meanwhile, D.R. Horton’s 2Q24 release this morning (DHI is a Sept fiscal year) is a reliable empirical gut check since it is the #1 homebuilder with the lowest average selling price level among the Top 10 public builders. Like other builders, DHI has the latitude to offer incentives from fee relief to mortgage buydowns.
On their conference call this morning, DHI cited their continued the use of “buydowns” as they reported a quarterly bottom line of $1.2 bn vs. $942 million in 2Q23. We will get more color on incentives during reporting season in the coming days, but the builders are charging ahead as evidenced in their running stock performance over the past year.

The above chart breaks out the timeline for single family alone vs. total existing. We see existing home sales of 4.19 million, which is well below the long-term median (from Jan 1999) of 5.25 million. The mortgage rate shock brings obstacles in terms of weaker affordability and nasty upward moves in monthly mortgage payments, but the new home sales level is still above median despite the mortgage shock.
The lower line is ex-condo/ex-co-ops. Total single family ex-condos/co-ops declined sequentially to 3.8 million from 3.97 million. We saw 390K in condos and co-ops, down from 410K in Feb 2024. The single family supply is running at 3.1 months and condo/co-ops at 4.2 months as of March. That blends into 3.2 months overall in the face of slower selling rates. Those “inventory months” always come with the asterisk of regional and price tier mix.
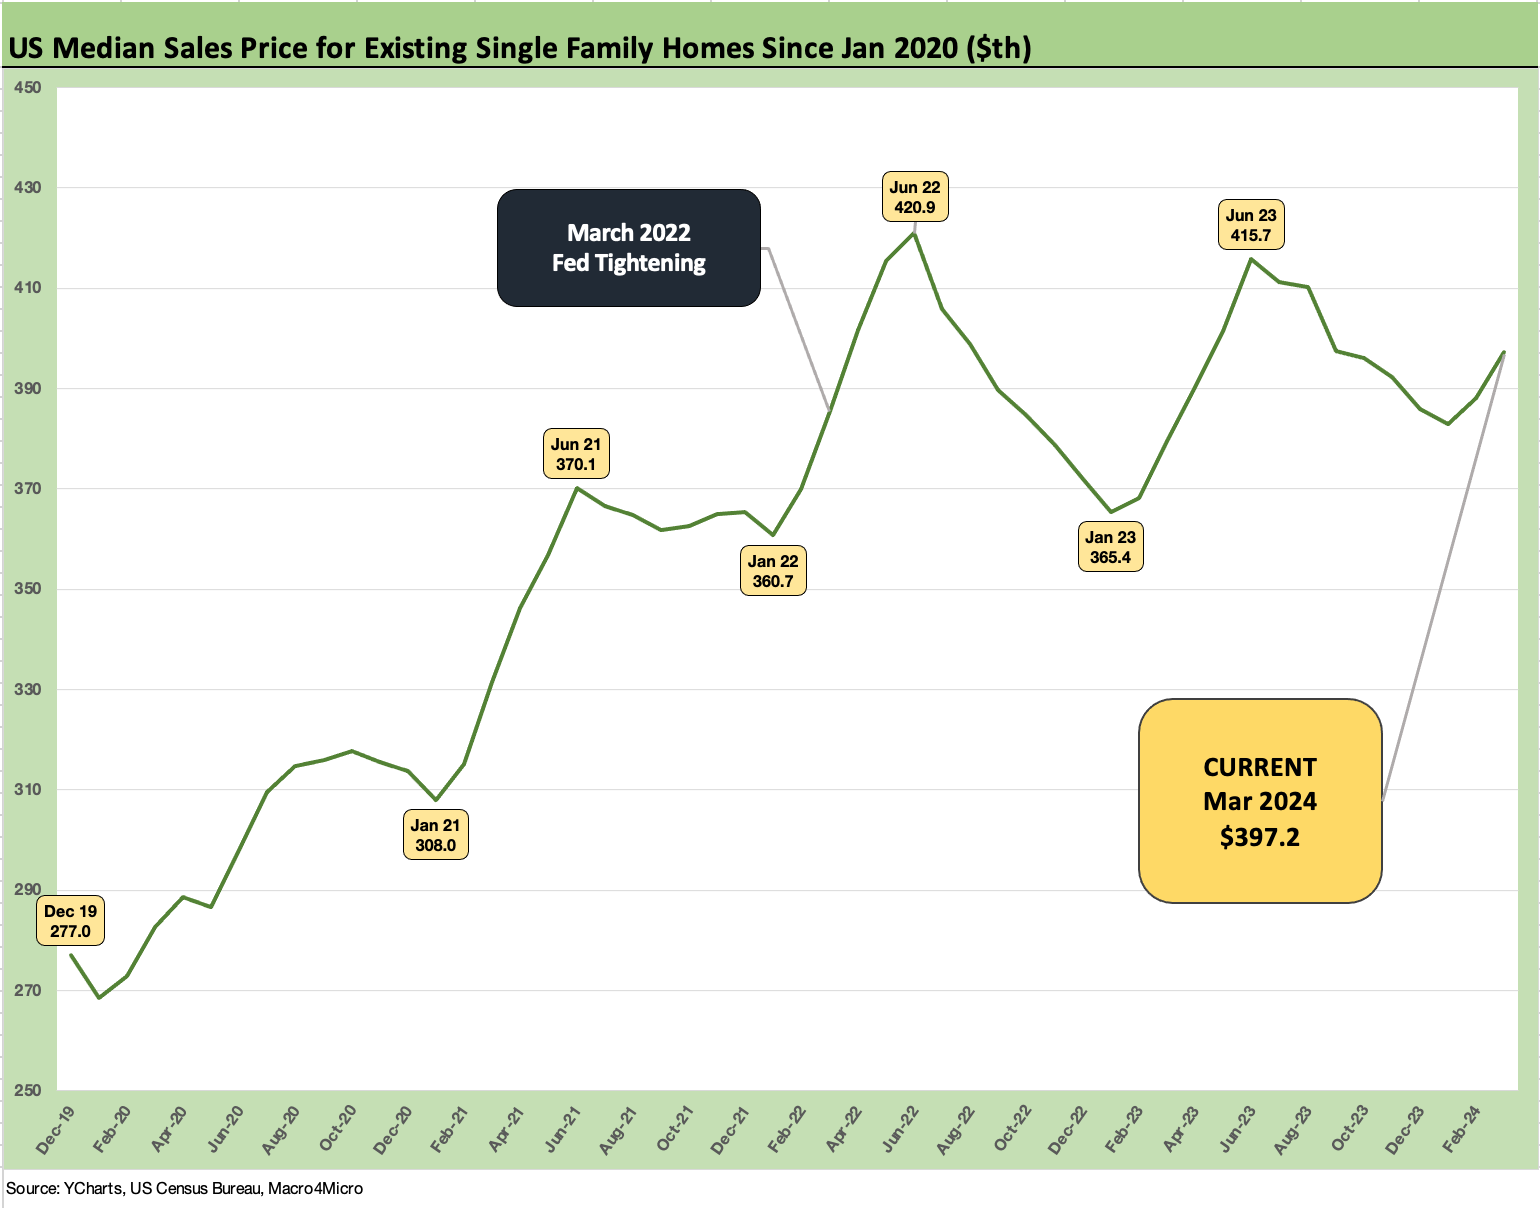
The above chart plots the median price for existing single family homes, and we see an increase in the price to $397.2K for a +4.7% increase YoY. For all existing single family homes including co-ops, we see a slightly higher 4.8% increase to $393.5K with median co-op sales alone posting a +5.8% rise to $357.4K. Rising prices with lower volumes and higher mortgage rates are marching to their own beat by region on supply-demand dynamics. Demand remains strong but affordability is having mixed effects on sellers and buyers rolling up from the individual household level.

The above chart updates the monthly history from Jan 2021 through March 2024. We are above the COVID lows of 4.07 in May 2020 and further above the high 3-handle lows of the fall and the end of 2023.

The above chart updates the most current YoY change for March by price tier. We see 4 of 6 in negative range as noted earlier with the high price tiers in positive range.
See also:
Housing Starts March 2024: The Slow Roll and Ratchet 4-16-24
Industrial Production: A Healthy Sideways 4-16-24
Retail Sales March 2024: Until You Drop 4-15-25
Footnotes & Flashbacks: State of Yields 4-14-24
Footnotes & Flashbacks: Asset Returns 4-14-24
Consumer Sentiment: Do You Think Scary Thoughts 4-12-24
CPI March 2024: The Steeplechase Effect 4-10-24
Credit Markets Across the Decades 4-8-24
Credit Cycles: Historical Lightning Round 4-8-24
Payroll March 2024: Payroll Spike Brings a Political Theme Shift 4-6-24
JOLTS Feb 2024: Steady and Sideways 4-2-24
PCE Prices, Personal Income & Outlays: Sideways Tone 3-29-24
4Q23: Final Cut, Moving Parts 3-28-23
Durable Goods: A Small Boost for Manufacturing Sentiment 3-26-24