
CPI May 2026: The 4% Rubicon
The market now faces CPI above the long-term median and negative real fed funds to go with negative real wage growth.


All we need now is a major Iran escalation and more tariffs.
Headline CPI of +4.2% gets us into a new zone while Core at 2.9% is still not “core” to what is causing consumer headaches at the pump and in the aisles. Meats at 7.6% include beef and veal at 12.9% and fish and seafood at 6.5% while fresh vegetables weighed in at 11.9%. Coffee CPI was 17.5%. If you want to die young and smoke with that coffee, cigarettes are at 8.7% (I was on a long EU road show with the CFO of Philip Morris once in the 90s, and I think that shaved 5 years).
To quote Trump on Meet the Press: “Prices are down on groceries.” Not really… unless you are on an all-cheese diet (-6.0% for cheese) and drink tap water. Just scan the YoY column in Table 2. Then again, you use gas in the tank driving to the store and disposal/waste services costs are rising. So is the gas or electricity from the stove if you want that cheese grilled since utility costs are rising (also for the tap water). If the high cholesterol diet from the cheese and stress from caffeine withdrawal kills you, at least funeral CPI only rose 3.4%. The multiplier effect is alive and well.
In other household joy moments, Apparel is now at 4.8% and Footwear at +5.2% with the latest round of Section 301 trade actions unlikely to offer relief. Under “Recreation services” we are seeing some sharp moves in subscription and rental quietly sneaking up 14.2% YoY and 6.1% for the broader bucket. Music subscriptions were +7.2%. For some basic items, we see such items as “water and sewage services” at +4.7%, dental services at 8.5%, pet services at 7.0%, postage and delivery 14.7%. This can be framed at the household level where real wage growth is now underwater.
Looking at some special aggregate indexes, we see 4.7% for “All items less shelter” to go with 4.4% for “All items less food” and 5.2% for “All items less food and shelter.” Other adjusted lines such as Commodities at +5.5% and “Commodities less food” at 7.0% will get some attention (except from Hassett or Bessent).
Nondurables at 8.0% CPI have a CPI index weighting of 2.5x Durables with its -0.1% CPI. That low Durables CPI raises questions around the ability of many subsectors and industries to offset tariffs with the USMCA about to see a fresh round of upheaval. As we go to print, Trump has indicated he will not renew the USMCA. That is a very big topic for another day.
Services at almost 2/3 the CPI index is stubborn at 3.5% with some notable lines including Hospital Services at +5.7% and Electricity at 5.9% in the “Energy Services” bucket. Financial services have posted a sharp rise the past two months and now stand at 6.8%.
The Iran “ceasefire” is seeing more military action (as “ceasefires” go), with just the past few days swinging from an imminent deal yesterday to Iran will “pay the price” for delay overnight. That could mean hikes on the short end of the UST curve in 2026 and higher long rates regardless of the Fed.
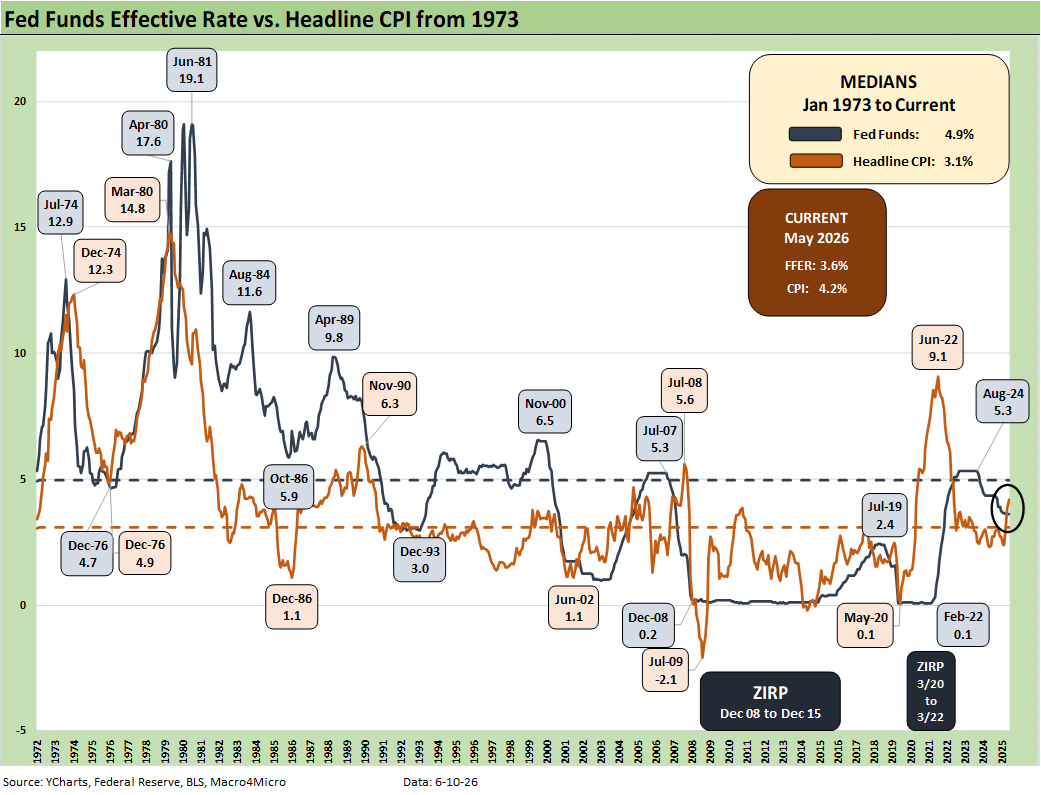
The above chart plots the historical time series for fed funds vs. headline CPI, and the headline CPI keeps moving higher and crossed the 4% threshhold after ending 2024 below the 3% line. We also include the long-term medians, which underscores that this is “not normal.” We reiterate that you can tell the consumer that “core is all that matters” for inflation but just don’t do it while he is filling up his gas tank on the way to the grocery store.
Oil prices also will clearly matter to FOMC voters who cut their academic teeth studying the disaster of the 1970s (notably 1974-1975) and the 1980-1982 stagflation double dip (Iranian oil crisis in 1979). The common features of Mideast conflict and embargos and supply disruption cannot be ignored. The most dramatic difference is that the US is now a record oil producer exporting record volumes at high prices. If oil exports were banned, prices would plunge in the US. That said, Trump knows where is meal ticket is.
“Core” CPI (or PCE) may be more significant to the debate around inflation (as defined by economists and monetary junkies), but the purchasing power and the relative affordability of the household basket is about real wages and what in that basket may have to change. The negative real wage growth and household cash flow strain is a topic you cannot hide from. Something has to give on Iran or in wages if this keeps up with higher financing costs also a reality in monthly payment stress (durables funding and mortgages). Household cash flow dilution has already taken savings rates back to 2Q22 levels (see PCE Inflation: Income and Outlays April 2026 5-28-26).
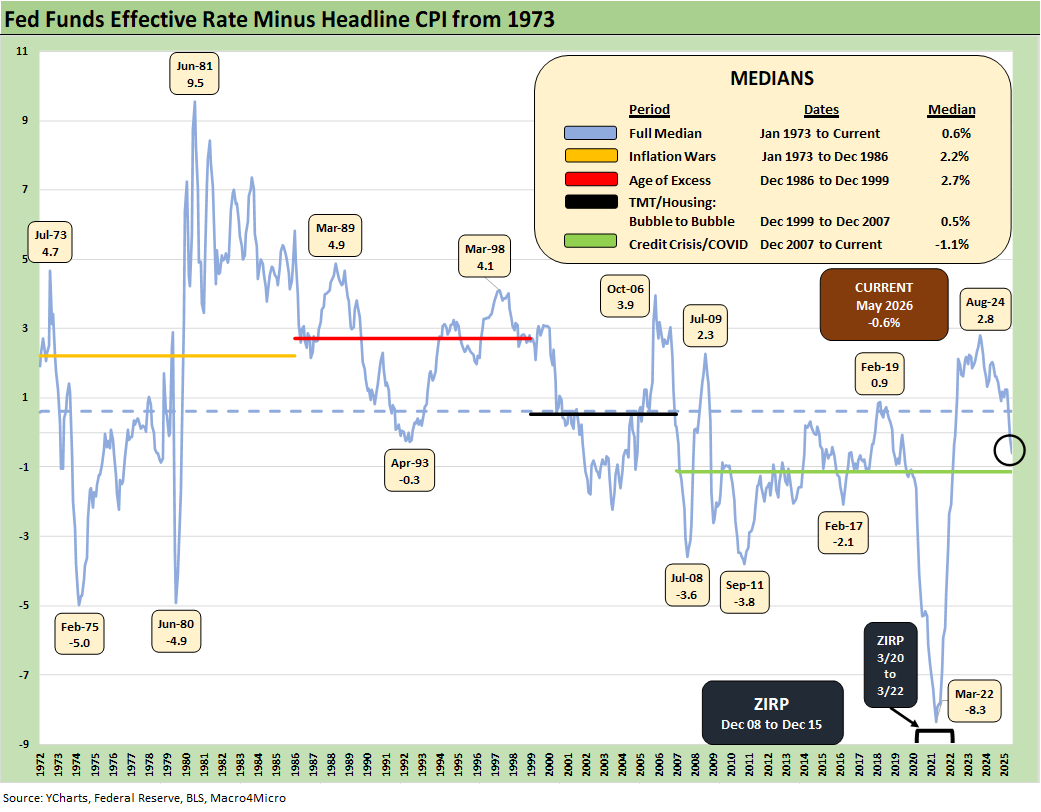
The above chart frames fed funds vs. CPI. It is now negative at -0.6. vs. the long term median of +0.6%. In the world of very basic theory, that is accommodation. So, the walk from here to an easing policy will need more than trimmed CPI. That would require more than a trim but would need a chainsaw to remove economic reality and abandon the household sea level experience.
As we go to print, the Vegas odds (CME FedWatch) show the odds of 1 fed cut by the Dec 2026 FOMC meeting stands at 1.2% vs. the odds of 1 hike at 42.5%. The odds of “No changes” in fed funds is 32.3%. That “unchanged” probability is lower than the 1 hike odds. The odds of 2 hikes by Dec 2026 is 19.9% while the probability of 3 hikes at 3.8% is higher odds than 1 cut at 1.2%.
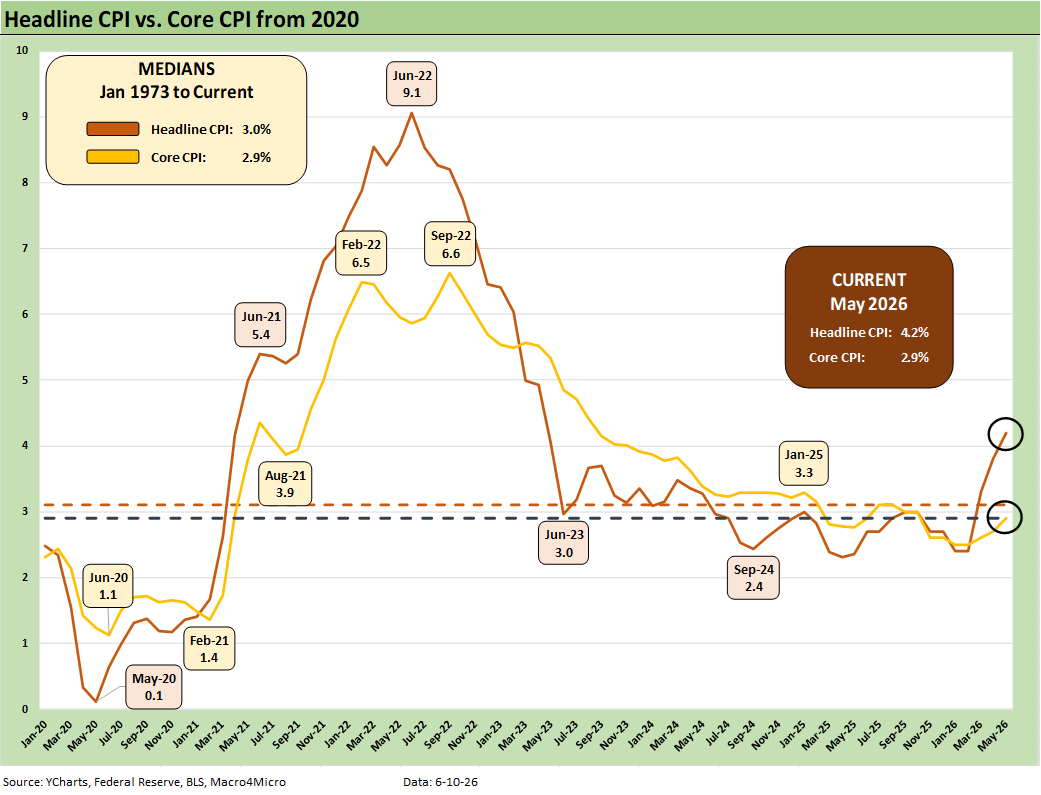
The above time series for headline CPI vs. Core CPI highlights the divergence of the two in this market backdrop. We see some of the highs and lows of the post-COVID timeline with the 2.4% Sept 2024 headline level that should call for treating the Powell legacy with a little more respect rather than giving him (and the collective FOMC) the electric chair (which now costs much more to operate).
We don’t see Trump, Hassett, or Bessent using such images in their sales pitches. They sure would not post them. After all, facts make noise while the theme music is playing. The idea of CNBC delivering a tough factual follow-up question like “Is inflation higher or lower than late 2024?) would make guests mad and be less likely to come back on. The constant focus on June 2022 by Trump and team takes away from the reality of the starting point of Jan 2025.
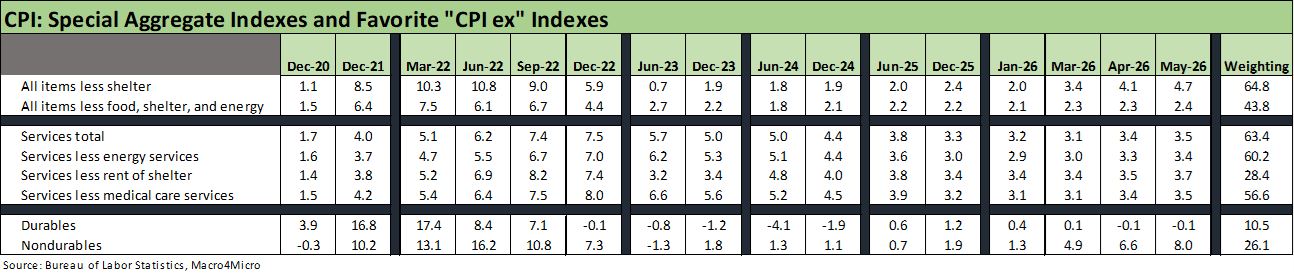
As we covered in the bullets, the customized CPI benchmarks posted in Table 3 of the BLS release are troubling in historical context. These detailed above are our favorites, but there is a long list worth reviewing. All items less shelter has been our top pick across time as we have cited in prior research since “Shelter CPI” comes with too many asterisks and derived numbers that do not fit the typical household reality (or even close).
The chart shows “Services” still stubborn. It also drives home the stark differential between the Durables CPI trend and the much larger Nondurables line. The ability (or desire) to pass through tariff costs has not hit Durables CPI yet.
The 4.7% for this “ex-shelter” metric in May is a material contrast with the sub-2% levels of 2024 including 1.9% in Dec 2024 (Biden’s last month). In mid-2023 the level was +0.7%. The FOMC was doing its job the right way by then, and the payroll adds of those 2023 days crushed what was posted on Friday (see Employment May 2026: Big Rebound, Low Multiplier Bias 6-5-26). Friday’s payroll additions were only around the median posted since the start of 2009. It was only very strong compared to the weak 2025 numbers.
One line that caught our attention this month in the special aggregates was “Utilities and public transportation” CPI at 6.0% (not shown above) along a CPI line with an 8.0% CPI index weighting. Total transportation CPI in Table 3 was 9.3%, which includes “private” transportation CPI of 8.6%.
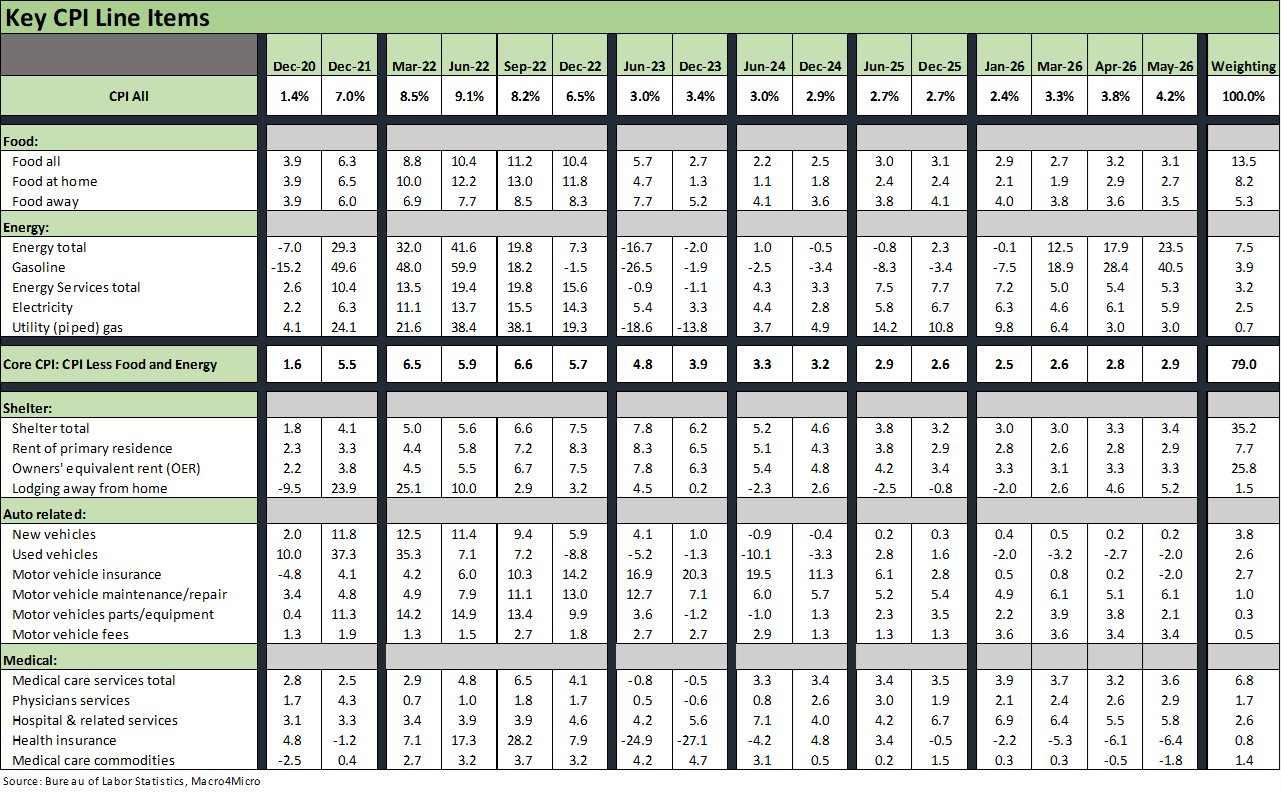
The above table details our Big 5 subsectors for CPI. These roll up to around 75% of the CPI index, so overall this mix of 5 broad categories is the main event even if there are plenty of line items outside this group that matter a lot to consumers.
We will not give much space to our long-held view on the low value of the lines that are derived and inconsistent with the household “checkbook experience” and household cash flow (notably shelter and the steep deflationary number of -6.4% for health insurance). Some of those lines speak for themselves at a time when such items as ACA premiums have soared and the deductibles offering are shifting the mix in the wrong direction. Too many people have had to drop coverage or see deductibles spike to find “affordable” health care.
The energy and food at home buckets show adverse moves. The higher costs of housing is also ugly when including financing and the monthly payment pain even if the CPI metrics do not capture that. Mortgages and the cost of financing do not get factored in the product line CPI and mortgages and auto financing are clearly going in the wrong direction.
With many households crushed by health care premiums (notably the ACA), the consumer is certainly not “feeling the deflation” in health insurance seen in the table. Those that struggle with coverage then get held hostage to the rising costs of services as broken out. The 5.5% for “hospital and related services” rose by +0.7% MoM and is high by any measure with 6.4% for the outpatient subset.
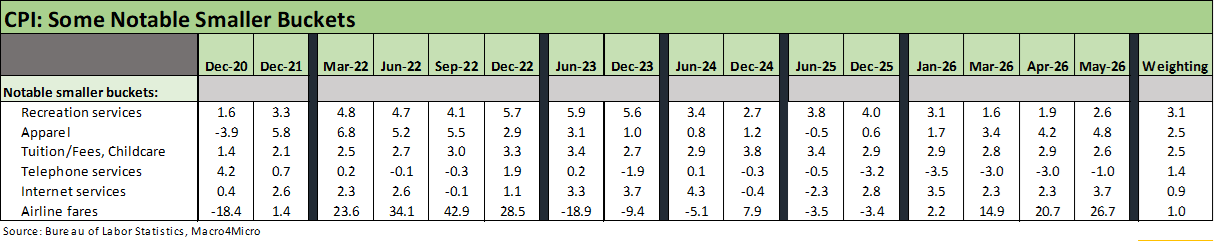
The above table updates some of the lines near and dear to households. Airline fares are heavily tied to jet fuel costs and that gets back to the K recovery debate on who can eat those price increases. These lines are a mixed picture with divergences across lines within these buckets.
The Apparel CPI is starting to look more rational relative to the pain Trump looked to inflict on the low-cost Asian countries. He lost on IEEPA and is now using the Section 301 “forced labor” strategy to raise tariffs (10%, 12.5%) on essentially all trade partners. Total apparel at 4.8% included 4.1% on Women’s and Girls Apparel but with the total Footwear line at 5.2% (Women’s Footwear at 6.2%). Jewelry CPI was 21.4%.
See also:
Market Commentary: Asset Returns 6-8-26
Remembering D-Day: June 6, 1944
Employment May 2026: Big Rebound, Low Multiplier Bias 6-5-26
The Fall of CBS 6-3-26
JOLTS April 2026: A Modestly Positive Turn 6-2-26
Retail Signal Read Part Deux 6-1-26
Market Commentary: Asset Returns 5-31-26
New Home Sales April 2026: Slow Start to Spring 5-28-26
PCE Inflation: Income and Outlays April 2026 5-28-26
GDP 1Q26 Second Estimate: Shrunk in the Dryer 5-28-26
Retail Equity Comps: Looking for Signals 5-26-26
Housing Starts April 2026: Soft Starts in Single Family 5-22-26
D.R. Horton: Financial Powerhouse Despite Cyclical Softening 5-20-26
Taiwan: Stakes are High, US Awareness is Low 5-17-26
Industrial Production April 2026: Bringing a Lift 5-15-26
Existing Home Sales April 2026: Steady or Clinging? 5-14-26
Producer Price Index April 2026: Heat Rising on Cost Inputs 5-13-26