


I have in my hand a list of 20 million Communist illegal immigrants who voted for Joe Biden in 2020. I will disclose it in two weeks. Maybe.
The pain in semiconductors comes with some continued second-guessing around valuations for the AI ecosystem names. The stunning YTD numbers for numerous critical tech sectors will get fresh tests on data center uncertainty. The software and SaaS names are gross underperformers in 2026 but some are starting to creep back.
As data centers come under siege by environmental interests, state and local legislative challenges, and community activists, the market could see more concerns in funding appetites (debt or equity). We will see what comes out of guidance in the earnings season and any revised growth rates getting framed for the intermediate term.
The performance of semiconductor equities was shaken again this past week with inflation not helping a consumer story that faded in 1Q26. While resilient, consumers are still on the wrong end of negative real wage growth after the wave of June macro releases.
Earnings kick into gear with the big banks the week of the 13th, and the pricing and volume questions for companies broadly could bring more signals by industry. Questions include how materials and power costs have flowed into cost structures with Canada and Mexico in the crosshairs on the tariff front. Mexico is a critical low-cost supplier for labor intensive inputs while Canada is a key resource provider even as it ranks as the #1 export market for around 3 dozen US states.
The UST curve steepened on the week given the balance of factors as the market seems to be looking past Iran to a happy ending and ignoring the weaker jobs numbers and downward revisions as influencing the FOMC soon or materially improving inflation expectations.
The CME FedWatch odds as of midday (Sunday) still see 0% chance of 1 cut by the Dec 2026 FOMC meeting set against 41.9% odds of 1 hike, 26.7% for 2 hikes, and 7.2% for 3 hikes. The odds of “no change” stand at 23.4%. Those odds will continues to gyrate on events (see Employment Situation June 2026: Back to a Crawl 7-2-26, JOLTS May 2026: Openings Flat, Hires Down, Layoffs Up 7-1-26).
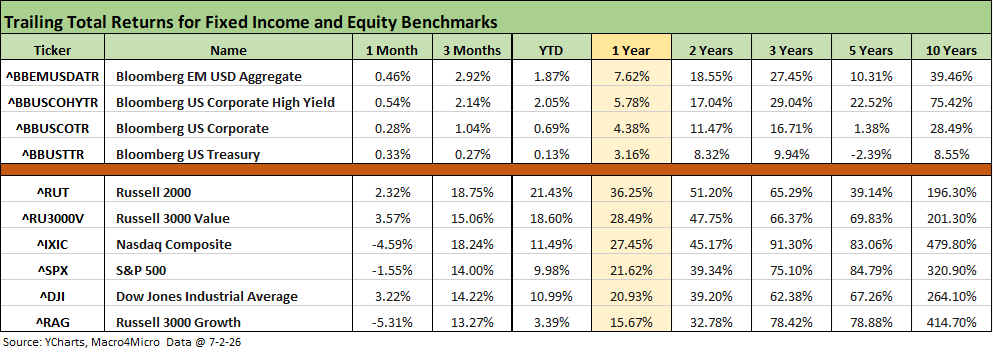
The above chart updates the running timeline returns for the debt and equity benchmarks we monitor. Debt returns are again all positive despite the adverse curve moves. Credit spreads for bond benchmarks have been steady in the midst of all the private credit headlines. Those headlines have weighed more on select financial market equities and subsectors (e.g. BDCs, private equity managers).
Equities are showing the pressure of the tech sell-off in the 1-month numbers, but 3-month results still show the tech leadership with some constructive performance numbers outside tech. We look at those in the ETF charts further below.
The 1-year time horizon shows a very special year for Russell 2000 small caps. Large caps have also been stellar YTD, but recent weeks have been flagging with some downside volatility.
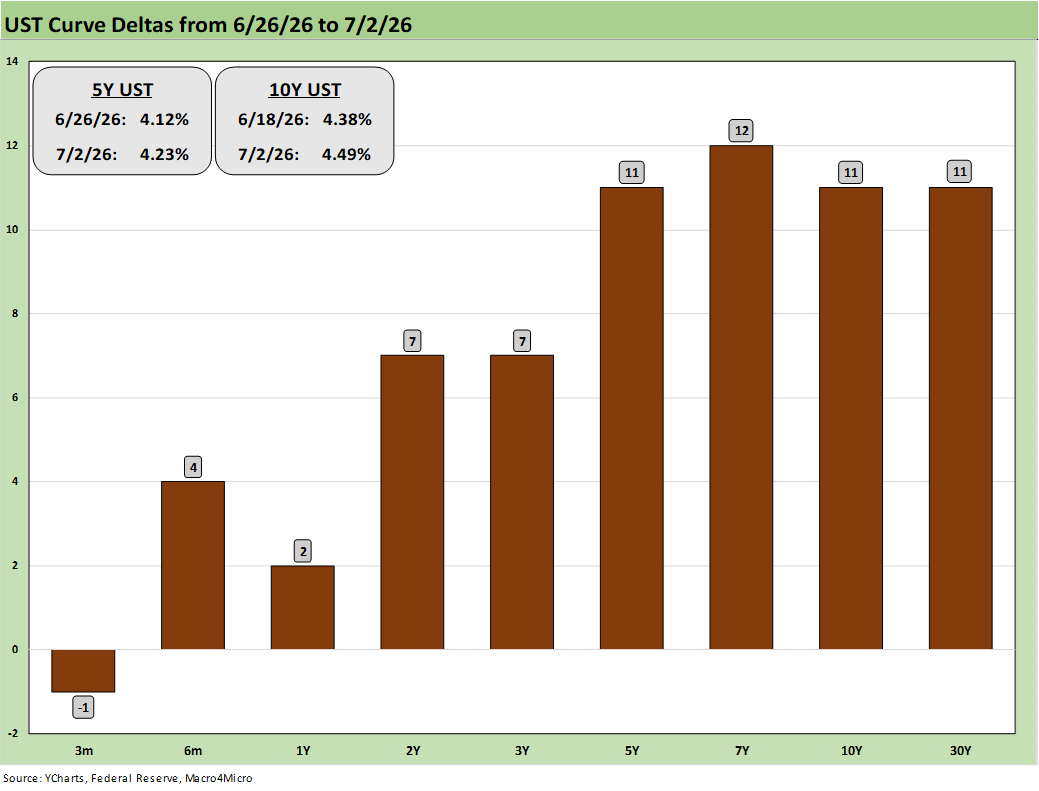
The above chart updates the 1-week UST deltas as the curve steepened despite the recent adverse trends in inflation metrics. Payroll numbers were weak (but not that weak) with the JOLTS numbers reflecting more favorably on prospects than the pace at which they are being filled. Both the ADP and the BLS payroll reports show the main drivers are still in services with additions to goods or manufacturing still light.
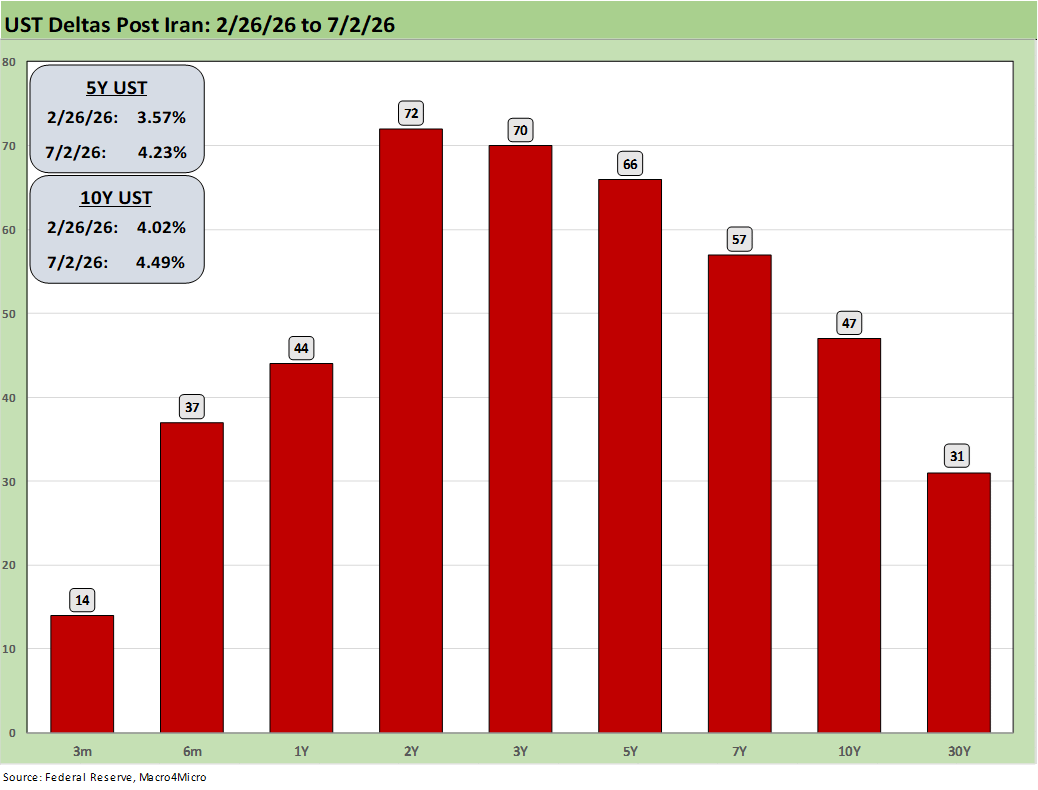
The above chart updates the post-Iran UST deltas (bombing began on Feb 28) as a bear flattener unfolded from the 2Y. The 2Y shows the biggest move as a reflection of how the market is looking at FOMC policy on the front end.
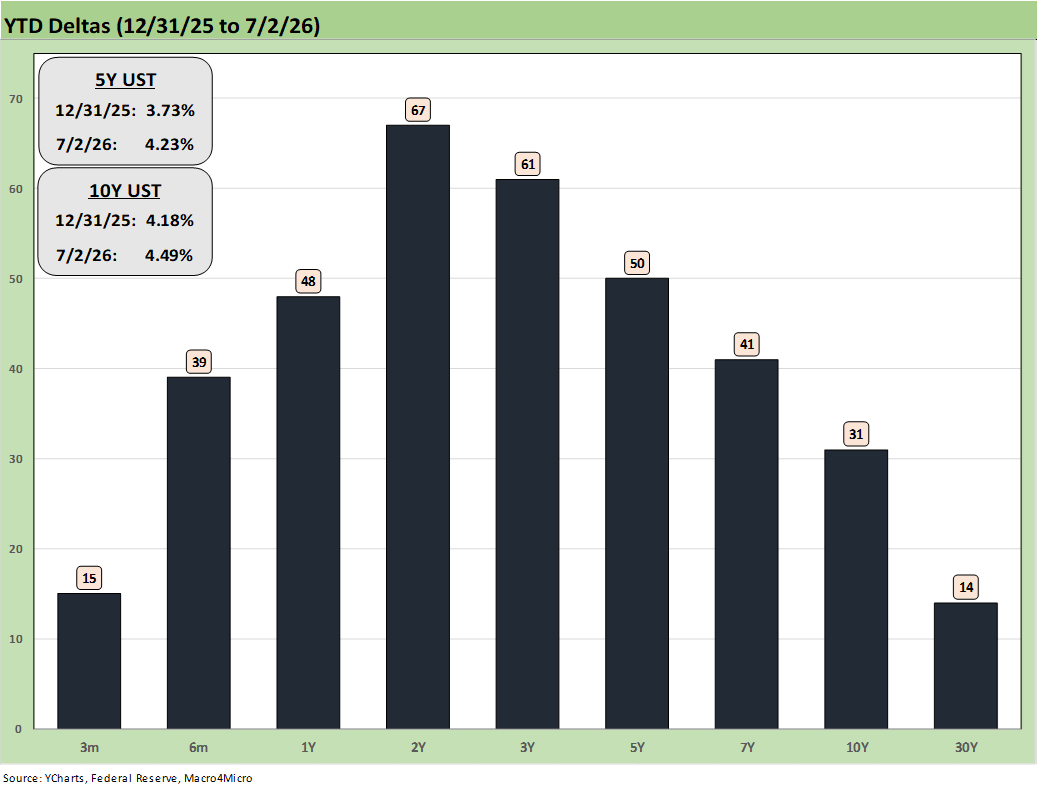
The YTD UST deltas reflect the bear flattener effects that played out across Iran, oil, adverse inflation metrics, and how that has all flowed into inflation expectations. The muted stagflation fears have further eased with progress (but not a firm resolution) on Iran.
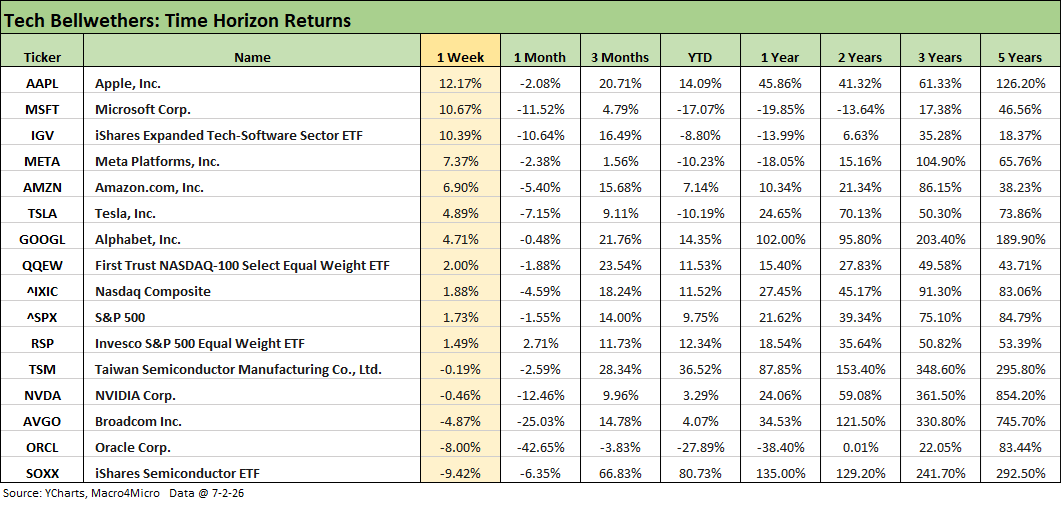
The tech bellwethers above show another week of big winners and losers but this time with the software names and 6 of the Mag 7 winning and semiconductors losing. We see Apple ranked #1 at +12.2% with Semiconductor ETF (SOXX) in dead last at -9.42%. In contrast, the Software ETF (IGV) hit positive double digit returns at +10.39%. We look at a broader mix of tech benchmarks and ETFs and single names in other charts further below.
We see the tech heavy NASDAQ and S&P 500 just below the median slot with 1% handles for each. The notable trend in the weekly numbers was “software wins and semis lose” with some exceptions such as the always volatile Oracle (ORCL) in 2nd to last at -8.0%. The Equal Weight NASDAQ 100 (QQEW) was in the middle just above NASDAQ.
The 3-month and YTD timeline retells the interesting story of big winners and big losers across the tech subsectors as we present in more detail below, where we break out more software and SaaS single names. Microsoft at -17.1% and Oracle at -27.9% YTD make a broad statement just in those two narrow cases.
The following is a cut/paste from our weekend LinkedIn posts with minor edits.
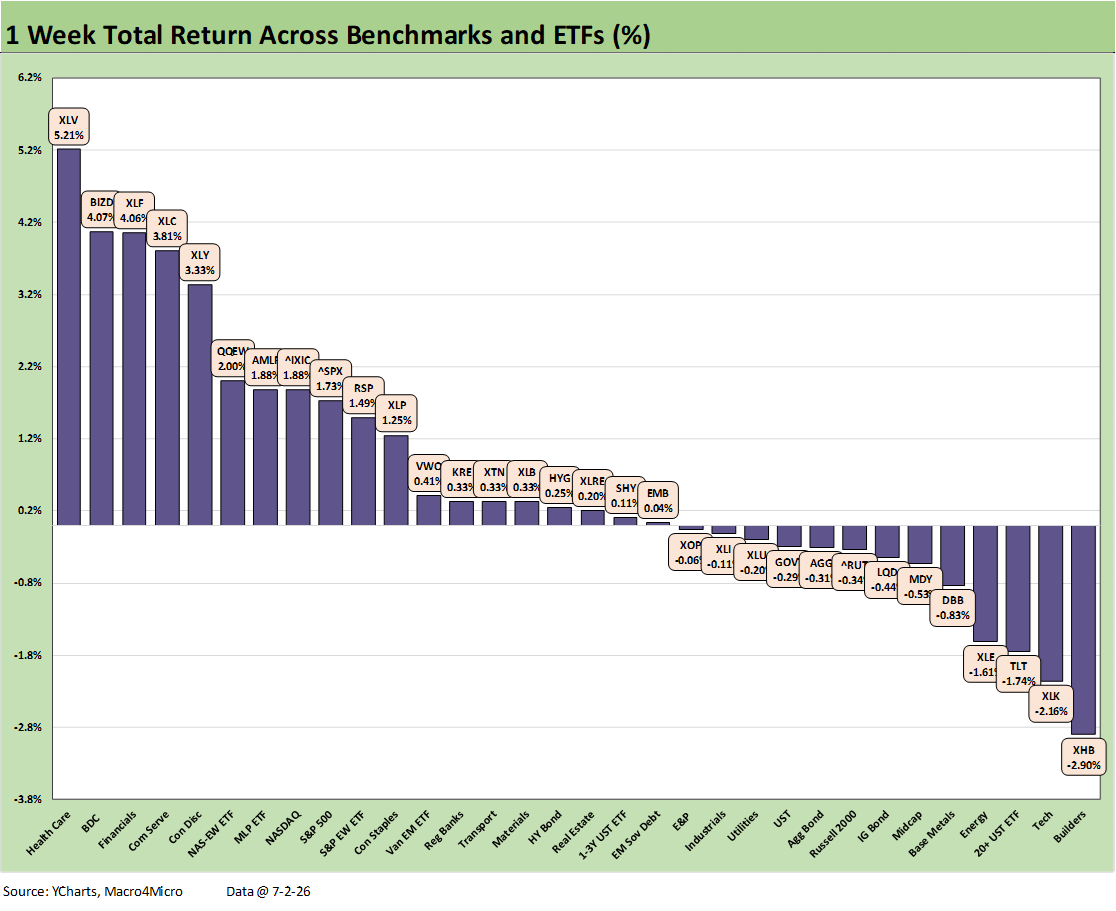
The week was shortened by the July 4 holiday, but the major equity market benchmarks have been looking past the inflation headlines, the slower PCE growth from the consumers seen in 2026 and waiting for a final (a real “final”) settlement with Iran. The S&P 500 and NASDAQ were positive on the week with Russell 2000 and Midcaps (MDY) both negative.
The score for the 32 asset lines was 19-13. Winners include Health Care (XLV) at #1, BDCs (BIZD) at #2, Financials (XLF) at #3, Communications Services (XLC) at #4, and Consumer Discretionary (XLY) rounding out the top 5.
The “rotation” theme returned with semiconductors and SOXX ETF taking a beating while the Tech ETF (XLK) was 2nd to last above (see our separate “Tech Check” commentary). In contrast, software and SaaS names bounced back. The Equal Weight NASDAQ 100 ETF (QQEW) still made the top quartile.
The weak payroll numbers this week (in theory) could offer some reassurance to those focused on the curve, but rates drifted higher and the 2Y to 10Y steepened. Duration took a hit with the long duration UST 20+Y (TLT) 3rd from last. Homebuilders (XHB) were last in part on mortgage worries and weak residential hiring. Negative real wage growth seen in the BLS release raises the risk of wage pressure with household basket affordability in a bad place now.
Weak jobs will not help housing, and the UST setbacks saw 6.6% to end week in the Mortgage News Daily survey. The 6.43% for Freddie Mac’s weekly update (on Thursdays) was down modestly from the prior Thursday and down vs. 6.67% at this time last year.
The S&P 500 near highs are reassuring as long as we keep in mind that the S&P 500 hit 70 record high days in 2021 and 57 in 2024 before the 39 in 2025 and 24 in 2026 (Source: Seeking Alpha). New highs come and go, but the trick will be steady optimism around recession avoidance (for now, steady-as-she-goes on that topic) and stabilization of the consumer. At current PCE levels (+0.5% in 1Q26), that is a very low bar, and the spring PCE monthlies have been resilient.
The Iran wildcard to this point reflects optimism for a good result but predicting Iran’s and/or Trump’s behavior is a tricky variable to price. The direction of refined products has been questioned by the White House as if inventory costs do not matter, but more success on Iran should flow into energy costs at a lag even if not in the case of electricity.
We are entering June quarter earnings season with more guidance ahead and a greater sense of how some industries are dealing with inflation and the risks associated with the USMCA review process and potential EU trade tension. Trump again threatened 100% tariffs on the EU and is yet to admit that the buyer writes the check for the tariff. On tariffs, it is tough to discern the distinction between what he knows (or cannot retain or admit) vs. what he says. The choice is disinformation or ignorance.
The following is a cut/paste from our weekend LinkedIn posts with minor edits.
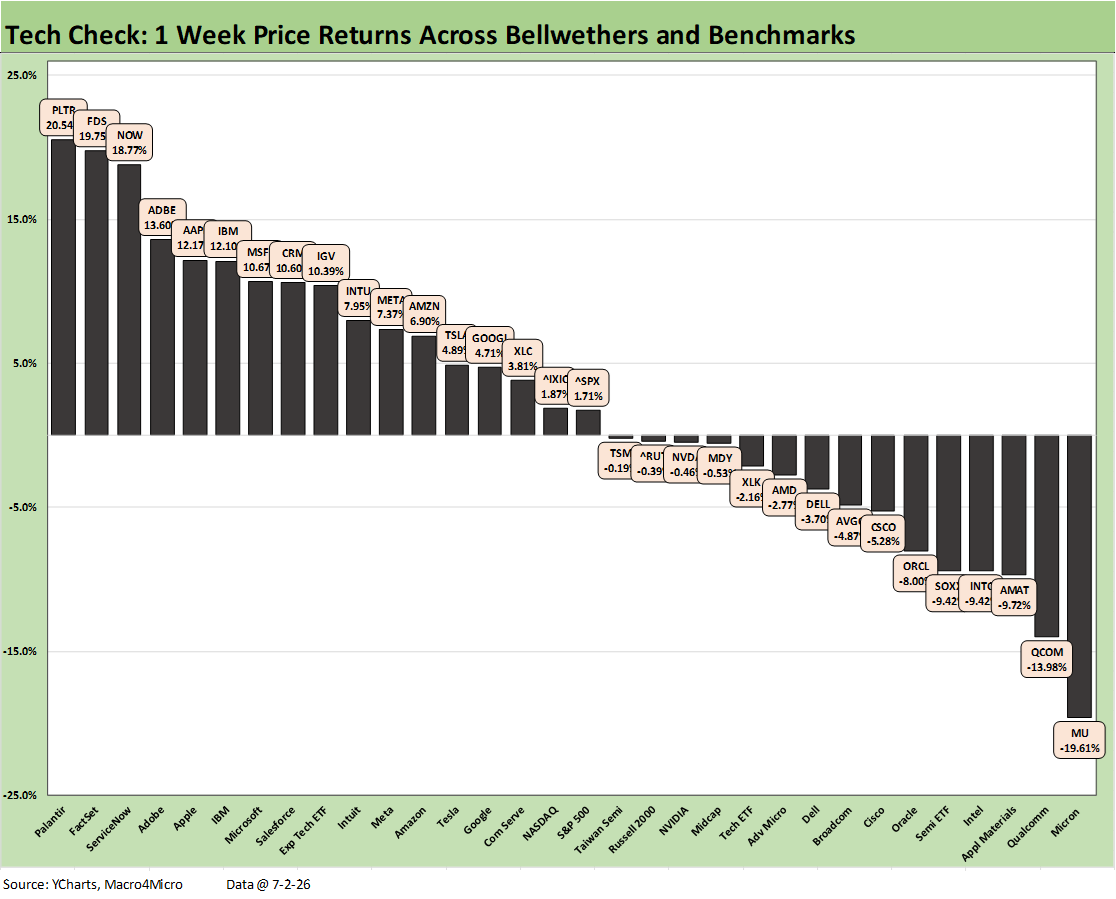
The chart shows a wild week in tech equities across single names, ETFs, and techcentric benchmarks. The semiconductor subsector and software and SaaS based names reversed relative trends in stark fashion. The Software ETF (IGV) posted +10.4% and the Semiconductor ETF (SOXX) was down by -9.4%.
The tech-heavy NASDAQ and S&P 500 were sitting in the middle of the pack of 32. NASDAQ and the S&P 500 posted 1% handle returns in a week that showed dispersion but nothing like the gaping Hi-Lo range often seen in recent months between semis and software. The Russell 2000 small caps and Midcaps (MDY) were slightly negative in the 3rd quartile.
The bottom quartile mix is clear enough with 6 of 8 directly tied into the semiconductor subsector. We also see legacy tech leader Cisco (CSCO) with its heavy exposure to the AI ecosystem and related capex boom. Oracle (ORCL) is housed in the software ETF (IGV), but also ties directly into the needs of AI buildouts and data centers. ORCL took a swoon with the benchmark AI plays.
The bottom quartile ran from -19.6% in last place with Micron (MU) up to the leader of the low quartile, which was Broadcom (AVGO) at -4.87%. In the overall mix of 32, we see a Hi-Lo range of over 40 points, and it took over 10% to make the top quartile on the week.
In the top quartile, we see many of the names which had been taking a beating YTD as recent weeks saw semiconductors soaring. Palantir (PLTR) weighed in at #1 with a +20.5% price return followed by FactSet (FDS), ServiceNow (NOW), Adobe (ADBE) and Apple (AAPL). Salesforce (CRM) also worked its way back into the top quartile with Microsoft (MSFT) and the more consistent IBM.
The MAG 7 had a very rough June as we covered in our weekly asset return commentaries along the way. This transition into July shows a partial comeback this past week with Apple (AAPL) and Microsoft (MSFT) back in the top quartile with only NVIDIA (NVDA) in the red in the 3rd quartile. Meta (META), Amazon (AMZN), Tesla (TSLA), and Alphabet (GOOGL) were clustered in the 2nd quartile.
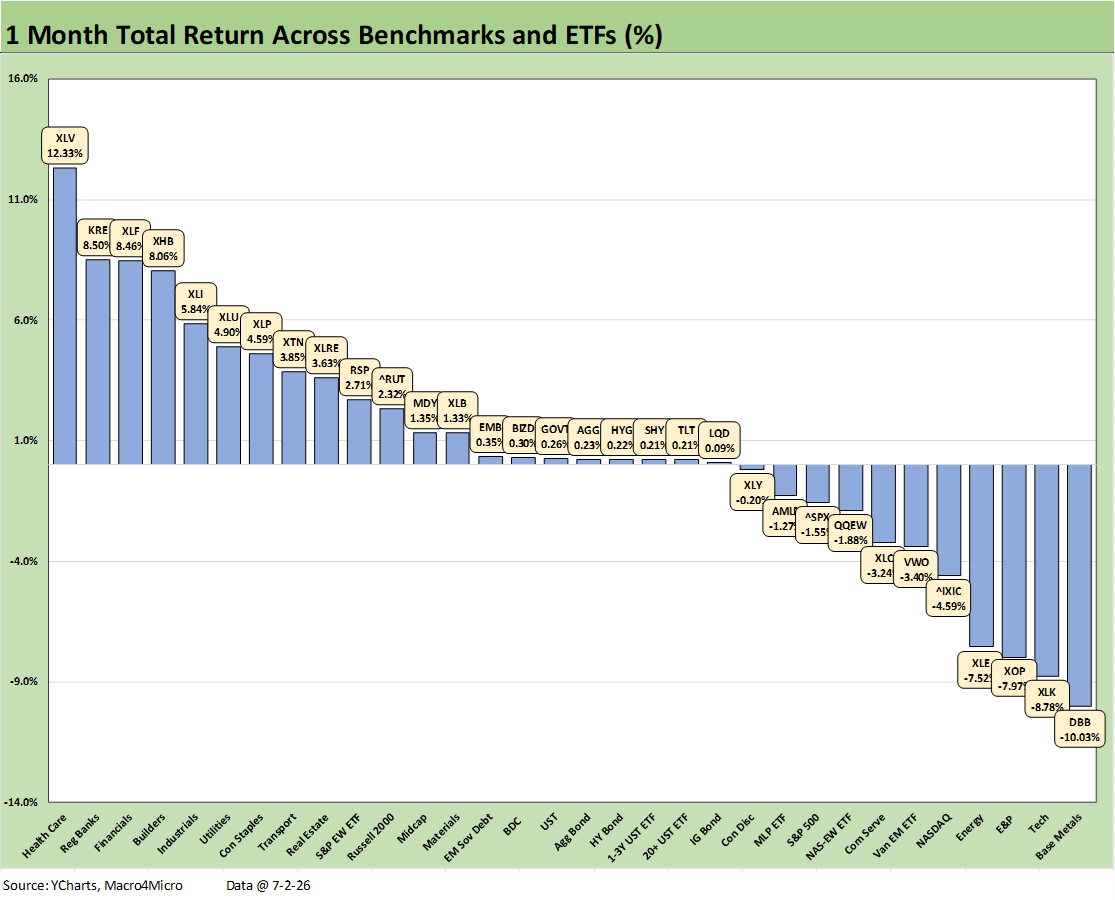
The 1-month scoreboard weighs in at 21-11 for positive-negative returns with the tech, energy, and metals backtrack on display in the low quartile. We see the upstream energy exposure (XLE, XOP) underperform. Base Metals (DBB) sits on the bottom after a sharp decline from the peak. That seems to signal that markets are looking past Iran in oil and notably aluminum supply from the Strait of Hormuz along with pressure off copper supply expectations.
The main story is still tech selloffs with the Tech ETF (XLK), NASDAQ, and the Equal Weight NASDAQ 100 (QQEW) in the bottom tier. The tech-weighting of the S&P 500 left that broad market benchmark in the red sitting on the bottom of the 3rd quartile.
The mix in the top quartile reflects well on how the market sees macro fundamentals stabilizing. While Health Care at #1 is consistent with the big pharma rallies, the Regional Banks ETF (KRE) at #2 and Financials ETF (XLF) at #3 is a vote of confidence with Homebuilders (XHB) and Industrials (XLI) rounding out the top 5.
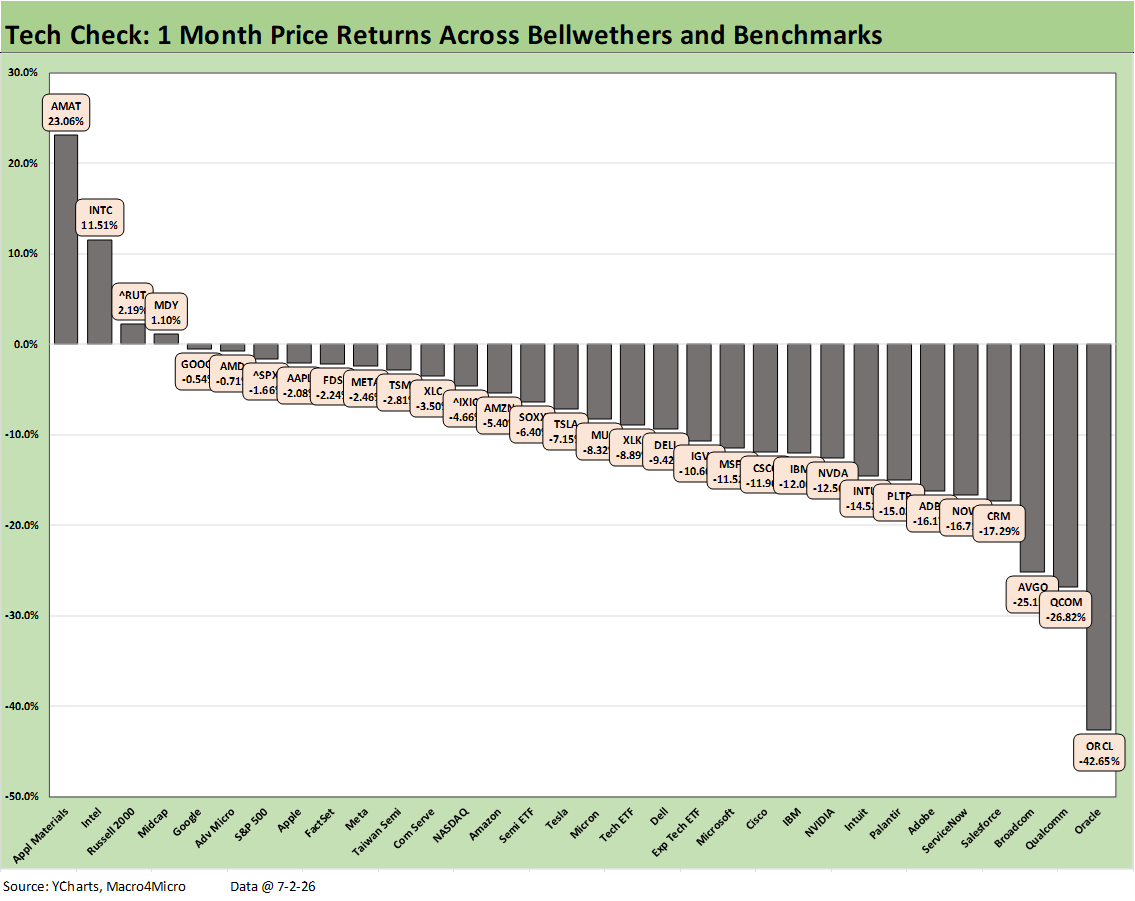
The 1-month timeline for the Tech Check mix certainly tells a clear story with only Applied Materials (AMAT) and Intel (INTC) in positive range among the tech single names detailed. We see major declines in Oracle (ORCL) at -42.7%, Qualcomm (QCOM) at -26.8% and Broadcom (AVGO) at -25.1% in the bottom 3.
For the other 5 in the bottom quartile we see the software and SaaS-based names (CRM, NOW, ADBE, PLTR, INTU) that had been getting trounced since the onset of the AI panic around business models. Those 5 names are all posting negative returns YTD as we detail further below.
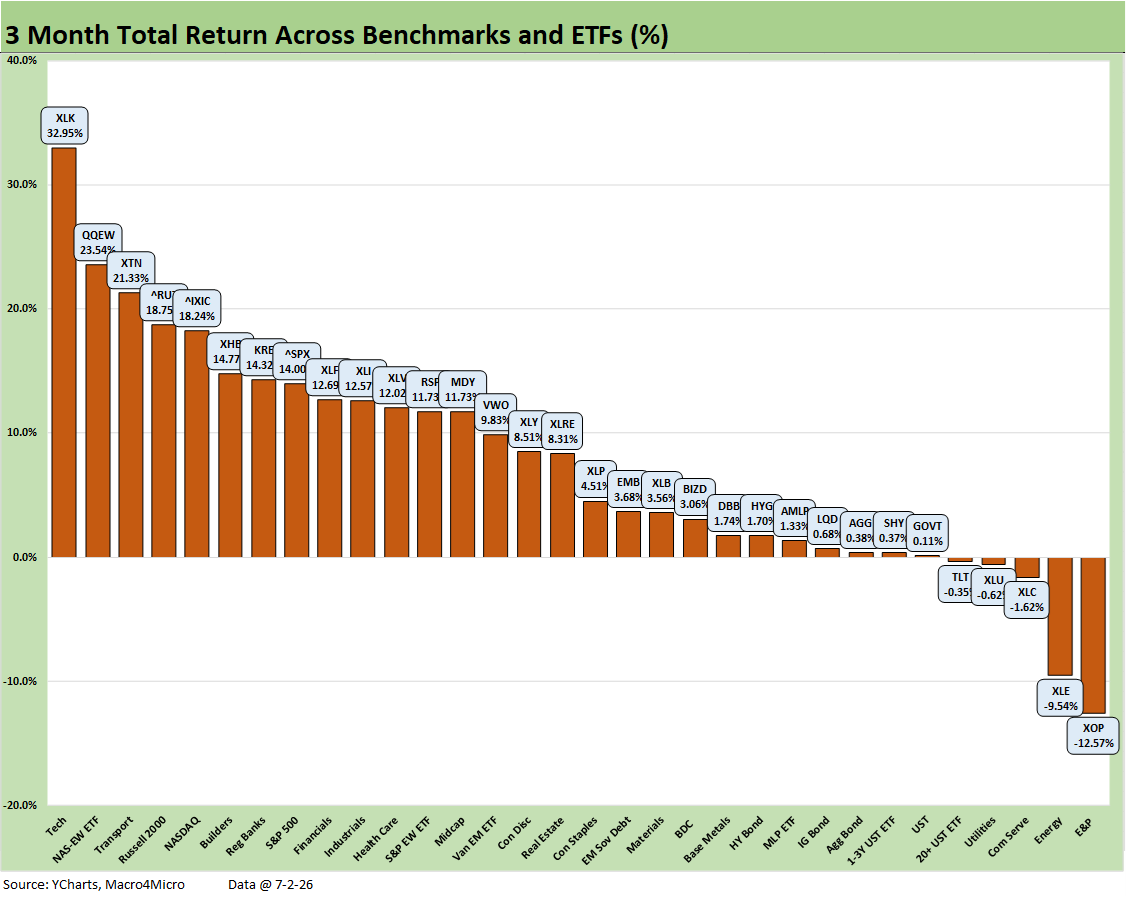
The 3-month timeline returns for the broader group of 32 benchmarks and ETFs shows a score of 28-5. All the tech names are in positive range with the winner of the pack being the Tech ETF (XLK) at #1. The top 5 also include the Equal Weight NASDAQ 100, NASDAQ, and the tech-heavy S&P 500. The Russell 2000 also made it into the top quartile.
Energy was beaten back for the rolling 3 months with E&P (XOP) and diversified Energy ETF (XLE) in the bottom two after the explosive rise on oil and LNG faded sharply around the Strait of Hormuz “almost-deal.” That would correct the supply shock risk premium if it stays on track.
That oil relief gave a boost to Transports (XTN) in the top ranks. The erratic performance of Homebuilders (XHB) can get wagged over the short term by the UST curve, but the short term core outlook for builders remains poor at this point in margins and pricing. That said, homebuilders have very resilient cash flow dynamics.
In terms of the UST curve and bond ETFs, we see the long duration UST 20+Y ETF (TLT) in slightly negative range. The UST and high quality bond ETFs (GOVT, SHY, AGG, LQD) posted minimal positive returns. The riskier duo (HYG, EMB) performed slightly better with credit spreads very unflappable given the scale of the Iran headlines and related macro noise.
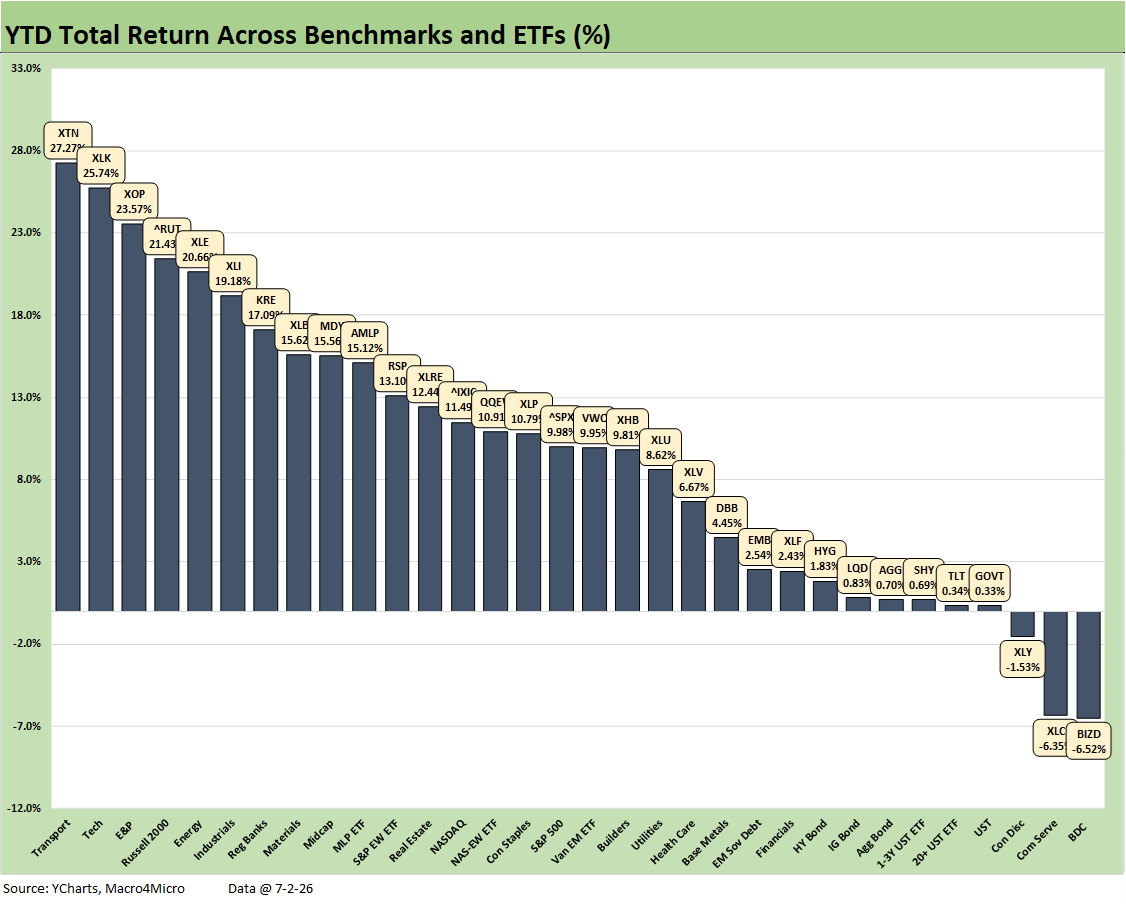
The YTD returns for the broader mix of 32 shows a score of 29-3. The bottom tier shows BDCs in last place with a moderate negative total return of -6.5% as high dividend rates cushion the blow of private credit nerves and some bad, excessive underwriting in the private credit space.
We see weak results in Communications Services (XLC) where numerous top holdings have generated very weak returns (most negative). XLC was dragged down by Meta (META), Netflix (NFLX), Comcast (CMCSA), Disney (DIS), and T-Mobile (TMUS).
The winners in the top quartile show some diversity outside of tech with Transports (XTN) on top ahead of the Tech ETF (XLK) with two energy ETFs (XOP, XLE) and the Russell 2000 rounding out the top 5. The top quartile also included Industrials (XLI) and Materials (XLB) for some cyclical optimism along with Regional Banks (KRE) for some optimism on asset quality.
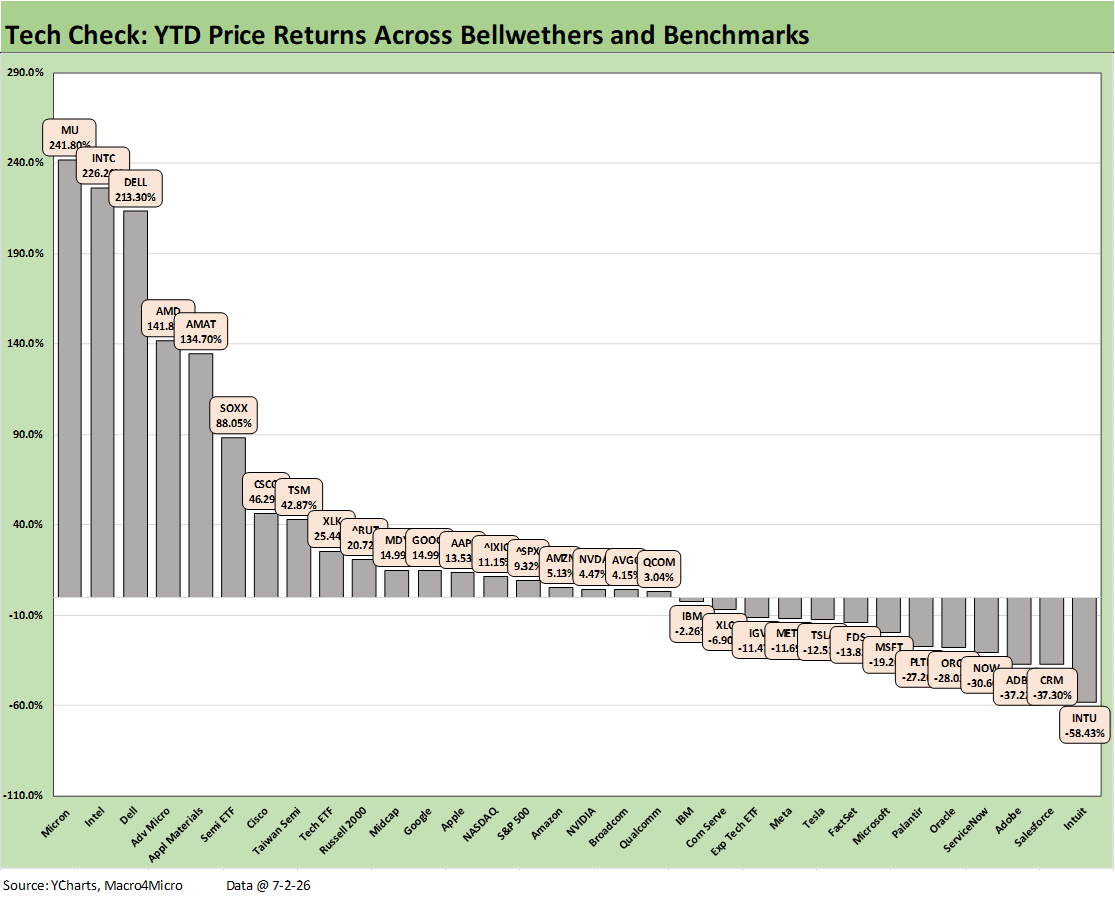
The YTD Tech Check return profile at a score of 19-13 is a case study in subsector return divergence with the semiconductor and AI ecosystem contrasting with a very different zone seen in the software and SaaS services operators. The Hi-Lo range starts with Micron (MU) at 241.8% and runs through #32 Intuit (INTU) at -58.4%.
Even with the steep selloffs of the past month, entry into the top quartile still required a 42.9% return. We see triple digit returns from #1 MU down through #5 Applied Material (AMAT). At #6, we see the Semiconductor ETF (SOXX) at 88.1% or over 100 points ahead of the Software ETF (IGV) with -14.1%.
The bottom quartile is all software and SaaS running from Intuit (INTU) in last place at -58.4% up to FactSet (FDS) at -13.8% at the top of the low quartile. The Mag 7 YTD weighed in with 4 positive and 3 negative returns spread across the 2nd, 3rd, and bottom quartile.
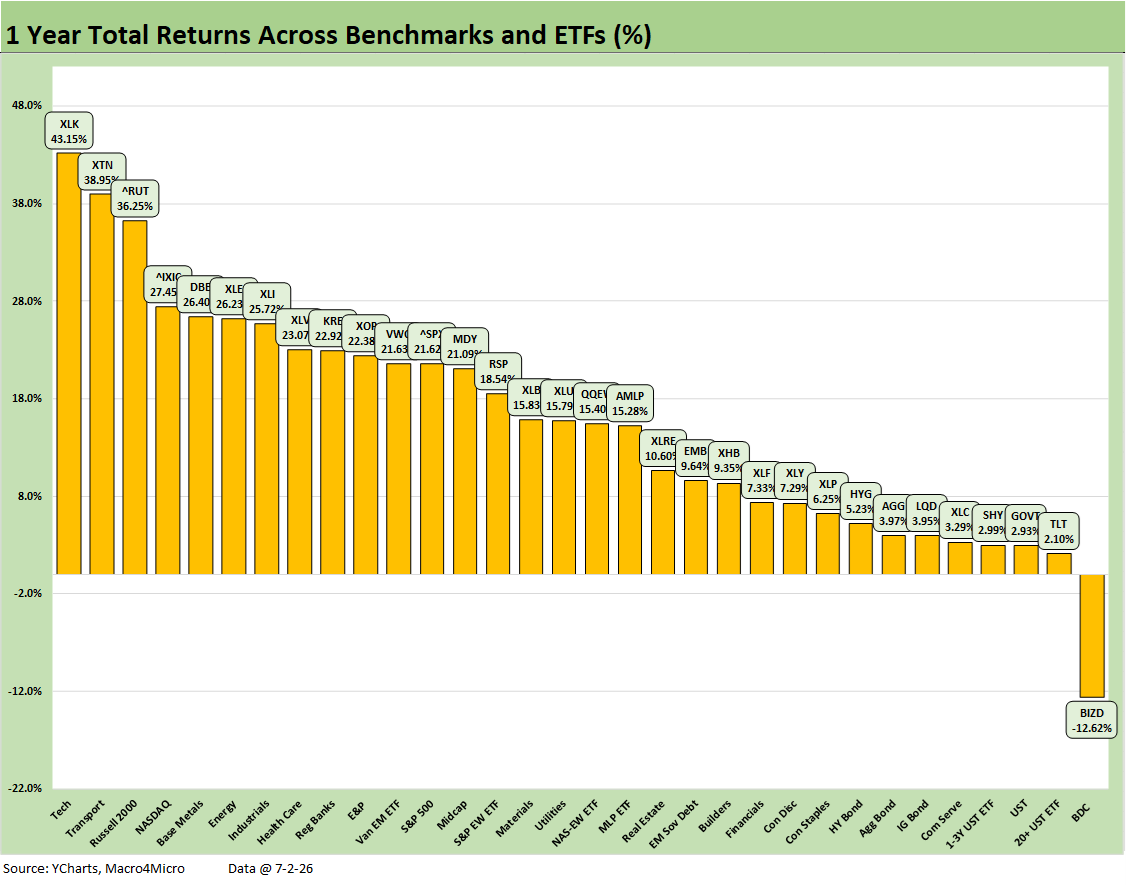
The score seldom changes for the trailing 1-year period with such a strong 2026. We once again see 31-1 with only the BDCs (BIZD) in the red at -12.6%. We see 6 of the 7 bond ETFs in the bottom quartile with EM Sovereign debt making the 3rd quartile.
In the top tier, tech is unsurprisingly on top with XLK followed by Transports (XTN), Russell 2000, NASDAQ, and Base Metals (DBB) in the top 5. Energy (XLE) joins DBB as side effects of the Iran crisis with Industrials (XLI) and Health Care (XLV) joining a diversified mix in the top tier.
See also:
Happy 250th Birthday America 7-3-26
Employment Situation June 2026: Back to a Crawl 7-2-26
JOLTS May 2026: Openings Flat, Hires Down, Layoffs Up 7-1-26
Music to Ponder: Hope Rising or Blood Simmering? 6-30-26
The Election Gambit: Economic Risk and Policy Uncertainty 6-29-26
JD Vance and Nixon History: Clueless 6-27-26
Personal Income & Outlays May 2026: Bad Inflation, Balanced Spending 6-26-26
New Home Sales May 2026: Weak Volumes, Stable(ish) Prices 6-25-26
GDP 1Q26 Final: PCE Growth Plunge 6-25-26
Trade Deficits: The Moving Parts and Macro Goals Matter Most 6-24-26
The FOMC Dance: Will Warsh and Trump Find a Rhythm? 6-17-26
Housing Starts May 2026: Weaker for both Single Family and Multifamily 6-16-26
Industrial Production May 2026: Steady, Balanced Utilization Levels 6-15-26
Geopolitical risk: Trump’s Nuclear Saber Rattling? 6-14-26
Producer Price Index May 2026: Too Many “Since 2022” References 6-11-26
CPI May 2026: The 4% Rubicon 6-10-26
Remembering D-Day: June 6, 1944
Employment May 2026: Big Rebound, Low Multiplier Bias 6-5-26
The Fall of CBS 6-3-26
Retail Signal Read Part Deux 6-1-26