
New Home Sales May 2026: Weak Volumes, Stable(ish) Prices
While homebuilder equities had a strong week, new home volume remains weak and builder margins squeezed.


The top-down macro picture for new home sales still shows weakness, mortgage rates are high and buyer confidence is low. The derailed housing legislation this past week was more for political value than a material near term catalyst, but homebuilders saw a rally regardless with KBH earnings offering some guidance reassurance even with YoY margins lower.
The single family new home sales trends in May posted -7.3% MoM and -6.8% YoY. The results show both the South region (60% of sales volume) and the West (20% of total) down MoM and YoY. The Midwest (14% of total) was positive MoM but down YoY with the small Northeast market (6% of total) in the positive range. The median sales price of $424.9K shows the stubborn and resilient home price backdrop with an increase MoM from April’s $416.5K and $424.8K in May 2025.
The free cash flow generation strength of homebuilders did not escape the notice of Berkshire Hathaway (BRK) when it acquired Taylor Morrison. BRK also owns a major real estate brokerage leader with HomeServices of America. We have seen Japanese building companies acquiring major US builders/suppliers such as M.D.C. Holdings and Tri Pointe. The US is in a weak part of the housing cycle but with a favorable secular outlook.
The builders are at a crossroads at this point where mortgages are in part tied to oil and yield curve steepening risk while inflation trends see many equity players looking past the current slowdown and the 6.5% mortgage rates. The seasonal peak will pass by quickly. A big question is “Will inflation threats ease? (see Producer Price Index May 2026: Too Many “Since 2022” References 6-11-26, CPI May 2026: The 4% Rubicon 6-10-26).
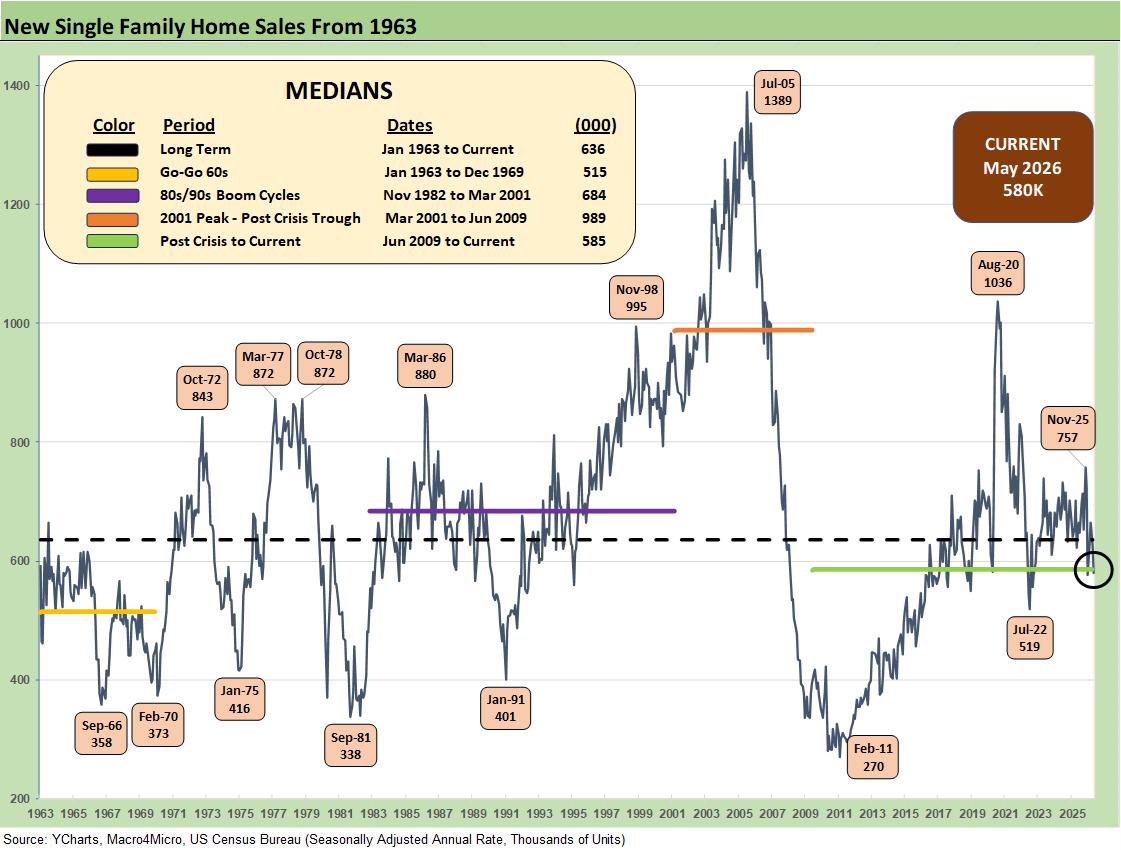
The above chart updates the new single family home sales series from 1963, and the current 580K (SAAR) is only slightly better than the grim Jan 2026 number (576K revised). The 580K is the second worst number over the past year with only Jan 2026 worse. The volumes are below the long-term median but materially below the 1980s/1990s.
The median of 989K in the housing boom/bust cycle from 2001-2009 is almost 70% higher. As we look back to the peak of the housing bubble, we see 1389K in July 2005 at well over 2x the May 2026 volume. The COVID panic buying and relocation spree in Aug 2020 saw sales of 1036K as a wild period for new home sales and home starts in a ZIRP market with very low mortgage rates.
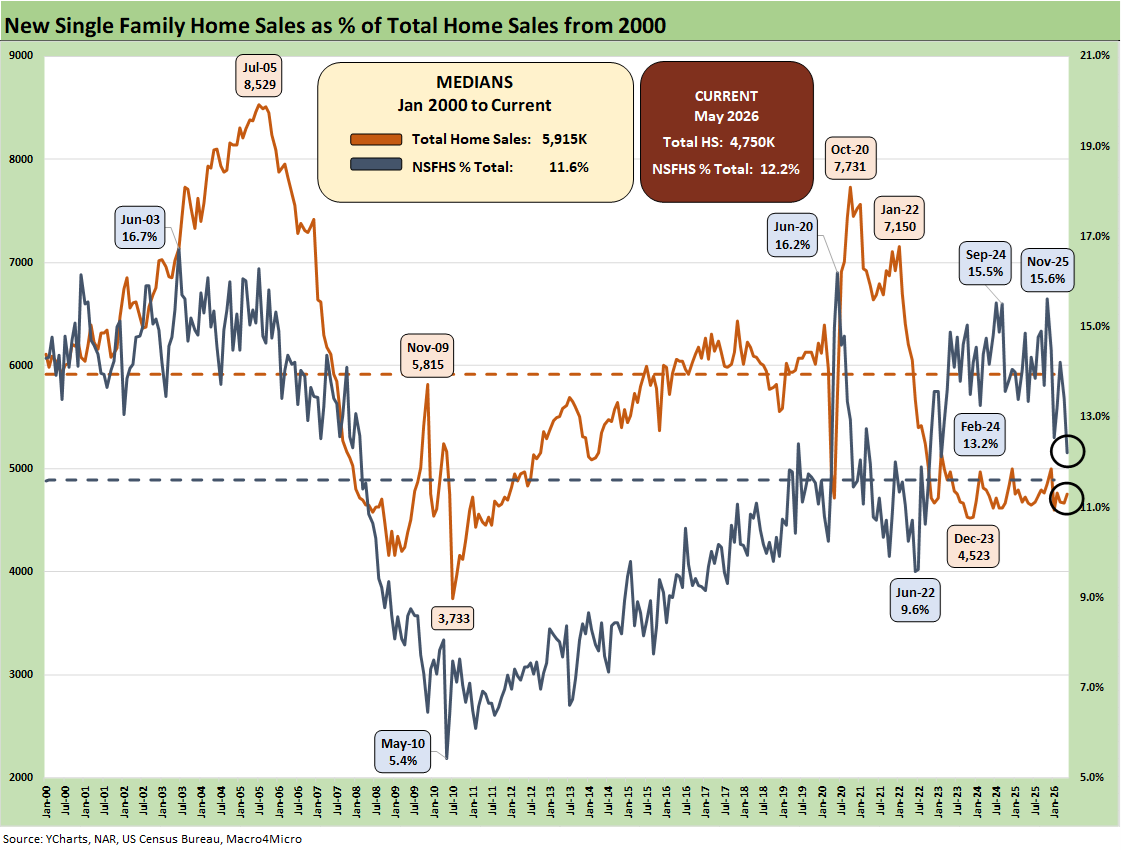
The above chart plots the share of total home sales (new + existing) that were captured by the “new home” builders. We see the share is now at 12.2% vs. the long-term median of 11.6%. When inventory is scarce, the right home at the right price wins. The challenge overall for new home sales has been mixed for builders by region. Major homebuilders generally continue to report gross margin compression in 2026 and guide to similar expectations for the year.
The market edge favors builders vs. existing home sales (note: existing is still the vast majority of sales volume). The homebuilder has the ability to use incentives and financing support (see Existing Home Sales May 2026: Slow Rise Despite Rates 6-11-26).
Given the mortgage rate headwinds undermining volume in the existing home sales market whether “golden handcuffs” or a challenging monthly payment bar to clear for many, the shortage of existing housing inventory at economic all-in costs (price and mortgage rates) has been a recurring drag in that side of the home sales tally. In new home sales, the gap between the expectations of the seller and buyer is easier to bridge through the incentive programs or the ability to offer variations in home design and specs to make a transaction work.
D.R. Horton as the #1 US homebuilder offers a useful microcosm of the new home challenges (see D.R. Horton: Financial Powerhouse Despite Cyclical Softening 5-20-26). The 6% handle mortgage rates have been a struggle and had moved briefly as high as 6.75% before easing back to the current 6.5%.
The new home sales volumes are softer even if that can vary by region and product tier. On the other hand, the prices posted this month looked to be in a stall which is modestly out of line with some of the color we hear from major builders on prices with KB Homes and Lennar. Those two bellwethers posted lower prices for the recent quarter. Average Selling Prices at the builder level come with the asterisk of product mix and region. The builders face the reality that incentives are still a material part of the builders’ selling strategies.
The mid 6% handle mortgage rates are not offering relief on monthly payment pressures and affordability and leave some marginal buyers on the wrong side of the divide. This week saw 30Y mortgage rates in the 6.5% area (Mortgage News Daily).
The 10Y UST is the key benchmark for the direction of 30Y mortgages and that has been moving in the wrong direction YTD. The oil wildcard could ease pressure on the longer end but the CPI, PCE and PPI inflation metrics – including this week for PCE and the 1Q26 quarter 4% handle PCE inflation – are still showing sustained inflation pressure (see GDP 1Q26 Final: PCE Growth Plunge 6-25-26).
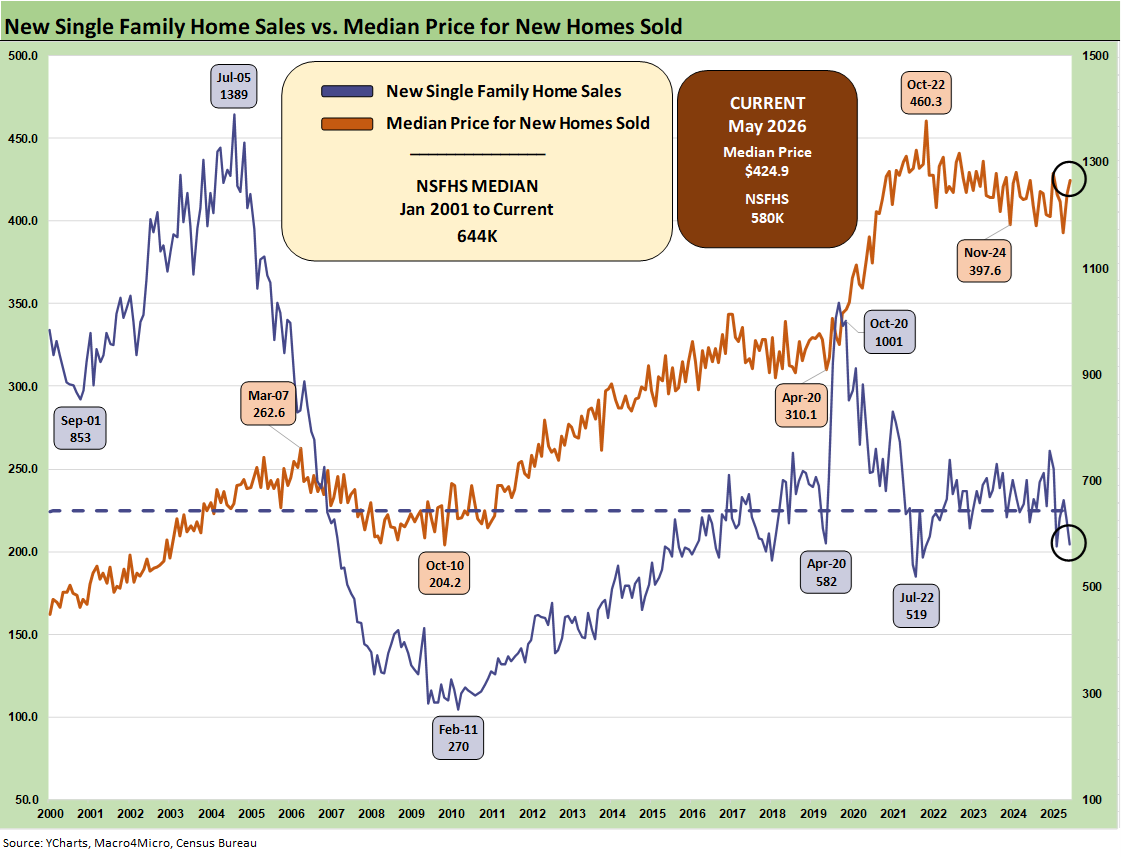
The median home price time series above tells a simple story that prices had been under modest pressure after a period of record highs and a long stretch over the $400K threshold with a few dips below the $400K line.
As noted above, the move higher to $424.9K in May 2026 rose off the $416.5K April price. Lower average selling prices were seen in the first and second quarters for a sampling of major builders as well as in the new home sales releases. The trend could be explained in part as a matter of geographic mix given the South’s lower ASP mix, but the “South” by itself has a very wide range as well. Meanwhile, the West rose with its traditionally higher ASP mix which can shift around California share.
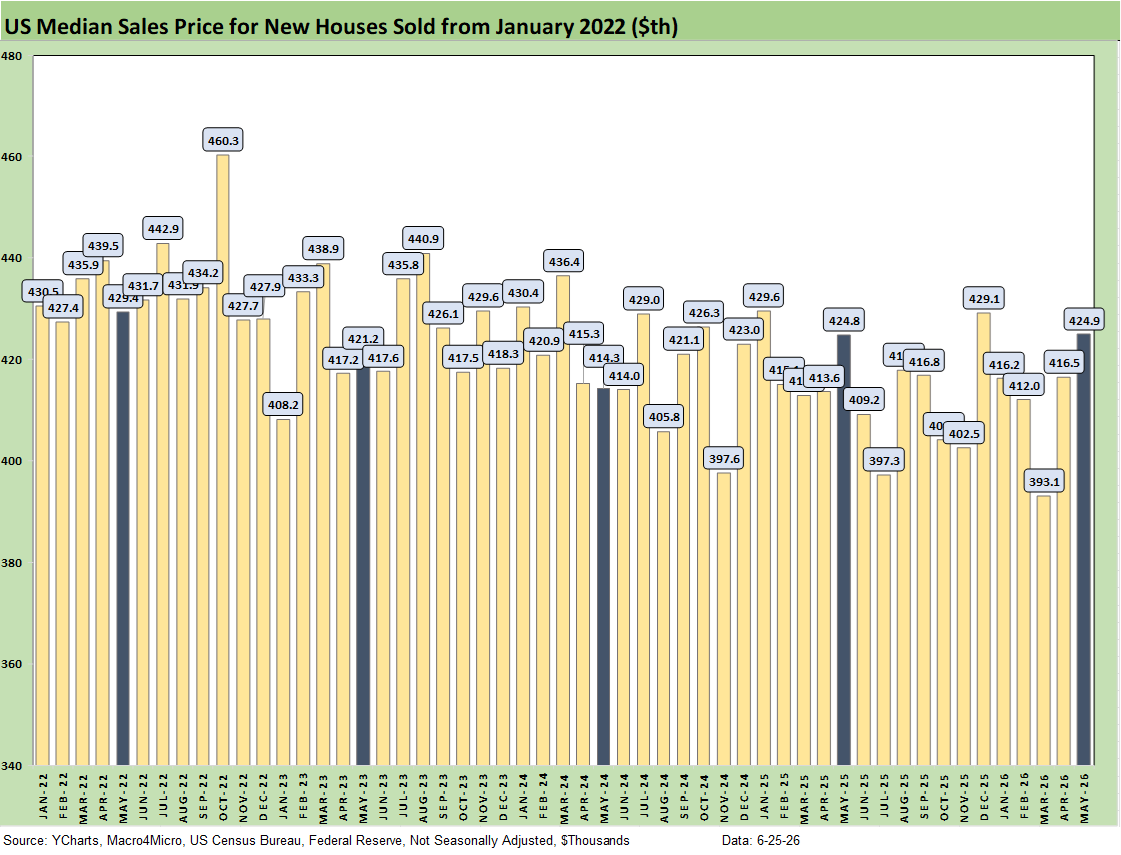
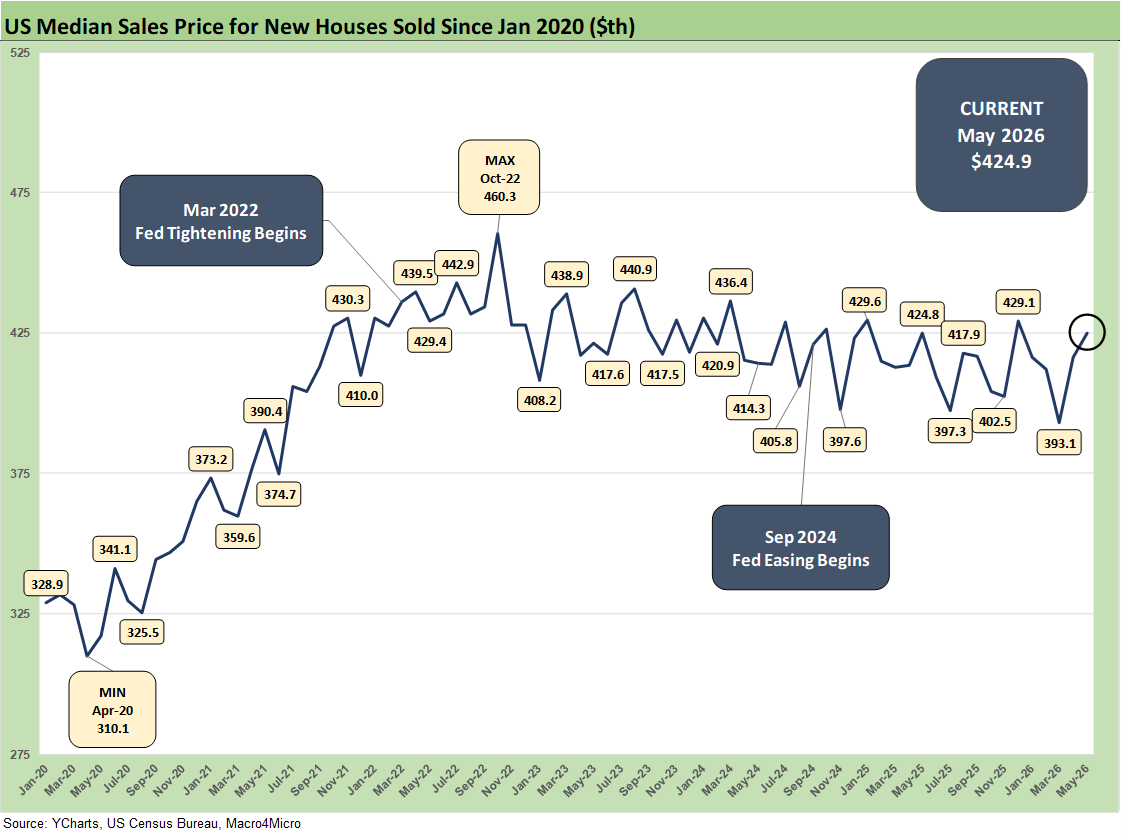
The above chart gives a different visual angle on the median new home sales prices from early 2022. That is a lot of $400K handles with some sub-$400K outliers. The current $424.9 K posted is well above the $393.1K in March.
The price metrics can shift with regional mix as well as home price tiers and related supply issues. The affordability question is still intertwined with the monthly payment pressures from mortgages. It is about more than price.
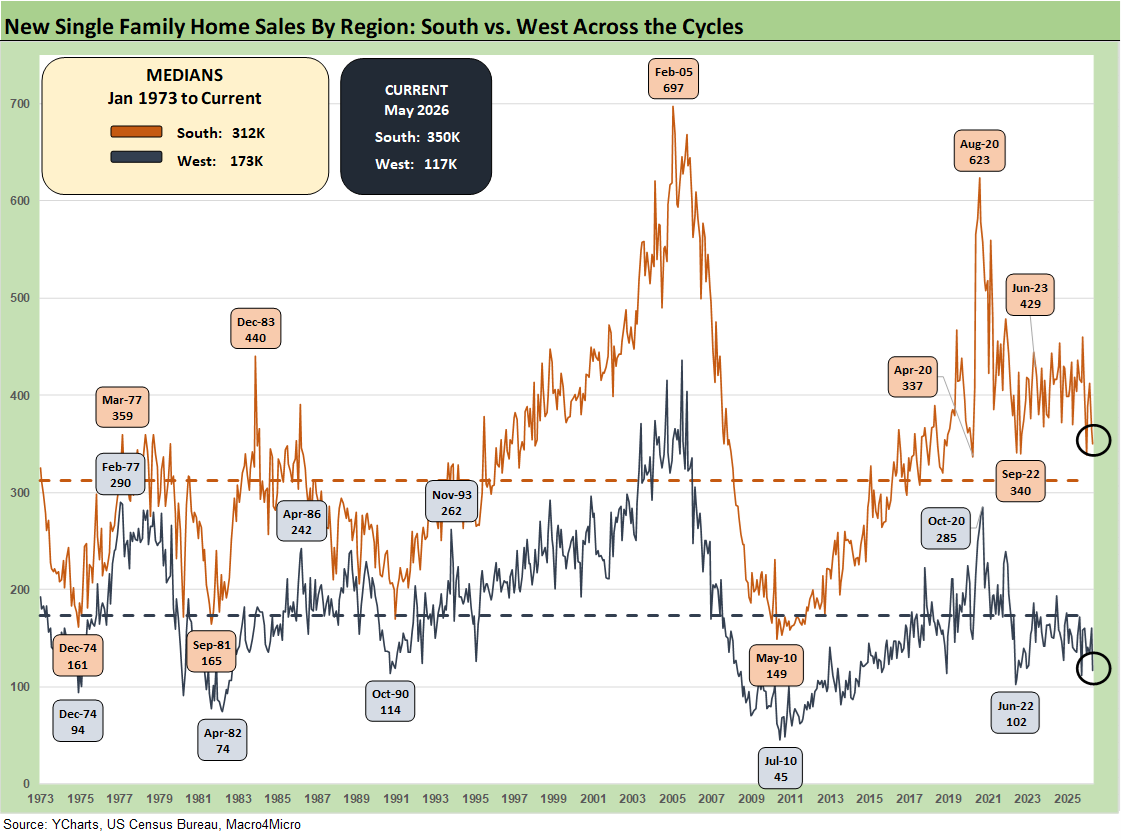
The time series above updates the new single family home sales across the cycles since 1973 for the #1 and #2 regions of the South and the West. The 350K for the South is around 60% of the total of all single-family new home sales (SAAR) and marks a sequential decline of -4.1% from April 2026 and is down by -5.4% YoY. The West at 117K is 20% of the total. For the month, the West was down by -26.9% sequentially and by -17.0% YoY.
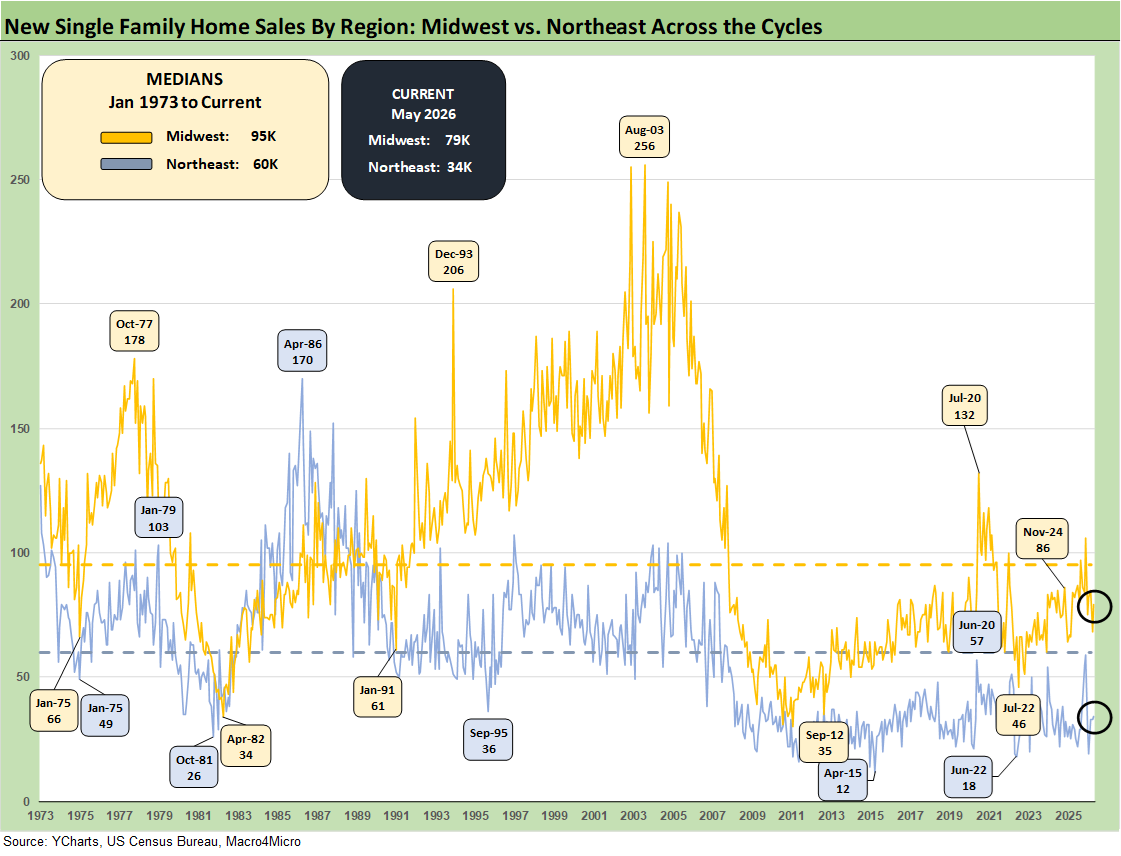
The timeline for new home sales for the smaller Midwest and much smaller Northeast market is detailed above. The Midwest (14% of total) was +16.2% sequentially and -3.7% YoY. The Northeast market (6% of total) was +3.0% sequentially and +17.2% YoY.
See also:
GDP 1Q26 Final: PCE Growth Plunge 6-25-26
Trade Deficits: The Moving Parts and Macro Goals Matter Most 6-24-26
Market Commentary: Asset Returns 6-21-26
The FOMC Dance: Will Warsh and Trump Find a Rhythm? 6-17-26
Housing Starts May 2026: Weaker for both Single Family and Multifamily 6-16-26
Industrial Production May 2026: Steady, Balanced Utilization Levels 6-15-26
Geopolitical risk: Trump’s Nuclear Saber Rattling? 6-14-26
Producer Price Index May 2026: Too Many “Since 2022” References 6-11-26
CPI May 2026: The 4% Rubicon 6-10-26
Remembering D-Day: June 6, 1944
Employment May 2026: Big Rebound, Low Multiplier Bias 6-5-26
The Fall of CBS 6-3-26
JOLTS April 2026: A Modestly Positive Turn 6-2-26
Retail Signal Read Part Deux 6-1-26
New Home Sales April 2026: Slow Start to Spring 5-28-26
PCE Inflation: Income and Outlays April 2026 5-28-26
GDP 1Q26 Second Estimate: Shrunk in the Dryer 5-28-26
Retail Equity Comps: Looking for Signals 5-26-26
D.R. Horton: Financial Powerhouse Despite Cyclical Softening 5-20-26