
Housing Starts May 2026: Weaker for both Single Family and Multifamily
Spring home starts are soft with single family down MoM and YoY and multifamily posting material declines in May.

The soft housing season continues with total starts down by -15.4% MoM and -8.7% YoY. Multifamily was down by -41.6% MoM and -12.3% YoY. Single family was milder with a -1.9% decline MoM and -6.7% YoY.
The critical South (58% of single family starts) and West (20% of single family) and #2 market in the West were both down MoM and YoY. The smaller Midwest and Northeast markets were both up MoM. We already saw a slow start to spring in new home sales, and the planning process from here is not backed up by an optimistic tone from the builders (see New Home Sales April 2026: Slow Start to Spring 5-28-26).
Mortgage rates remain a drag in housing affordability and a strain on monthly payment math as 6.6% mortgage rates reflected the unsettled post-Iran UST curve dynamics at a time when consumer confidence was in the doldrums, PCE growth in the GDP accounts had faded to 1.4%, and the household savings rate had plunged. Residential investment in 1Q26 posted a -6.2% contraction (see GDP 1Q26 Second Estimate: Shrunk in the Dryer 5-28-26, PCE Inflation: Income and Outlays April 2026 5-28-26).
This week brings the first Warsh FOMC meeting on Wednesday with mid-6% mortgage rates waiting for the prevailing winds to shift with the Iran “deal in process.” The UST market is not favoring easing through the Dec 2026 FOMC meeting with FedWatch easing odds of 1 cut at 0% as we go to print. In contrast, the odds of 1 hike are at +42.7% followed by 40.6% probability for unchanged. Even 2 hikes post odds of 14.7% and 3 hikes at 1.9%. Warsh may not offer much relief without the votes.
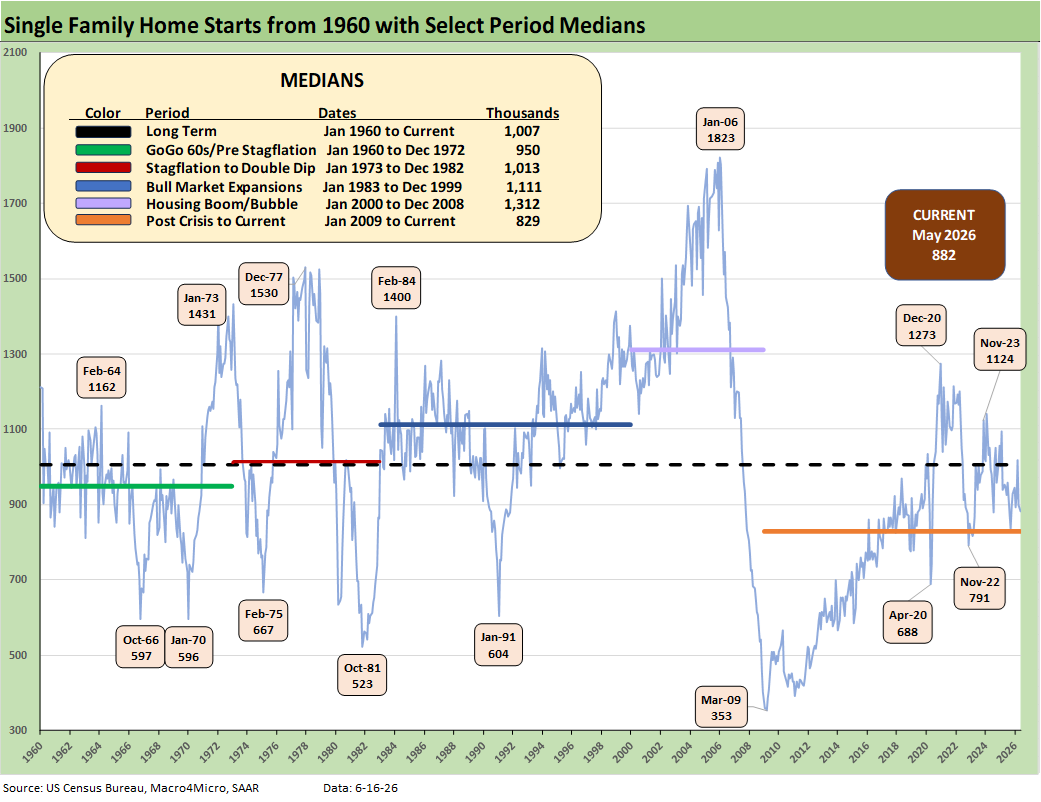
The above chart offers a clear reminder of the wild single family residential construction cycles across the decades. With favorable demographics for housing demand, the current starts run rate of 882K is still well below the long-term median and below all the timeline medians posted above except for the “crisis to current” timeline starting in Jan 2009 at 829K.
The current backdrop includes mortgage rate pressures on the affordability of monthly payments that are not likely to get much better from here in the peak housing season. That comes after seeing mortgage rates flirt very briefly with crossing below the 6.0% line in Feb 26, just before the Iran War. This past week hit the 6.75% area before the modest rally of the UST curve to 6.54% per Mortgage News Daily.
Single family starts were soft in relative terms vs. headline total starts dragged down by a grim month for multifamily (detailed further below).
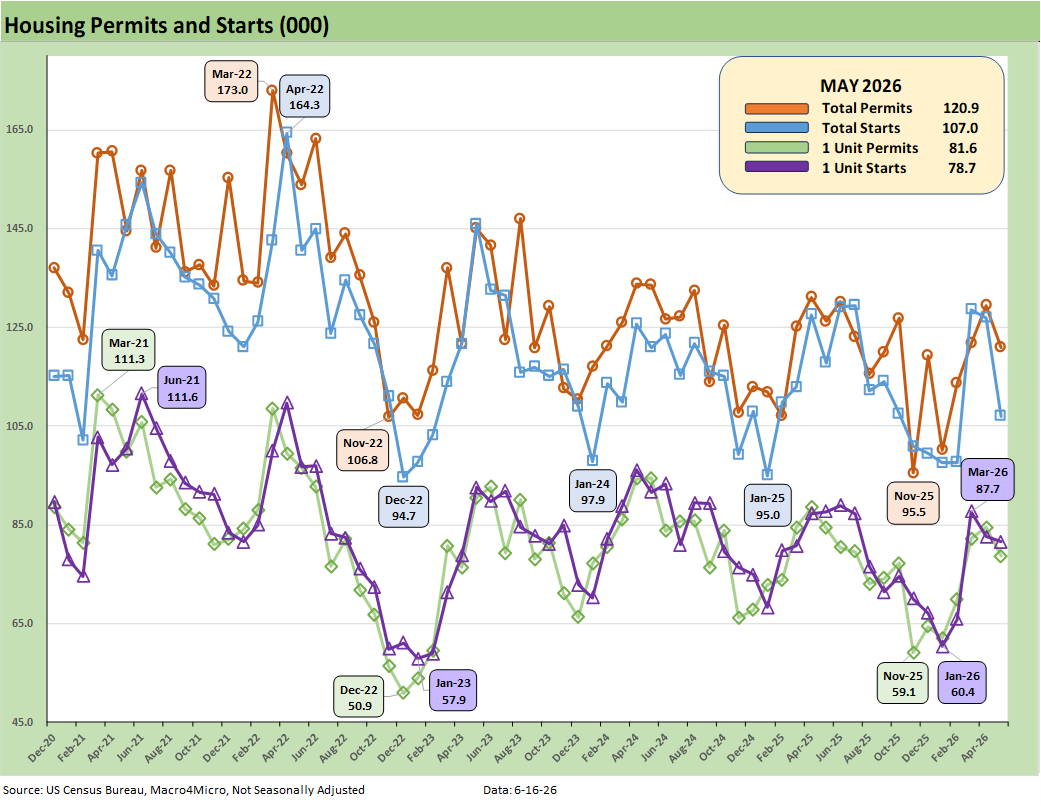
The above chart plots total permits and total starts on a Not Seasonally Adjusted (NSA) basis. NSA is viewed as closer to what is going on in the trenches without the SAAR model assumptions.
For May 2026, we see NSA total permits down by -4.2% and single family permits down by -6.8% YoY. For MoM, total permits were -6.6% with single family permits down by -6.9% MoM.
For total starts and single family starts on an NSA basis, we see total starts down by -15.8% MoM and single family NSA starts lower by -1.2% MoM.
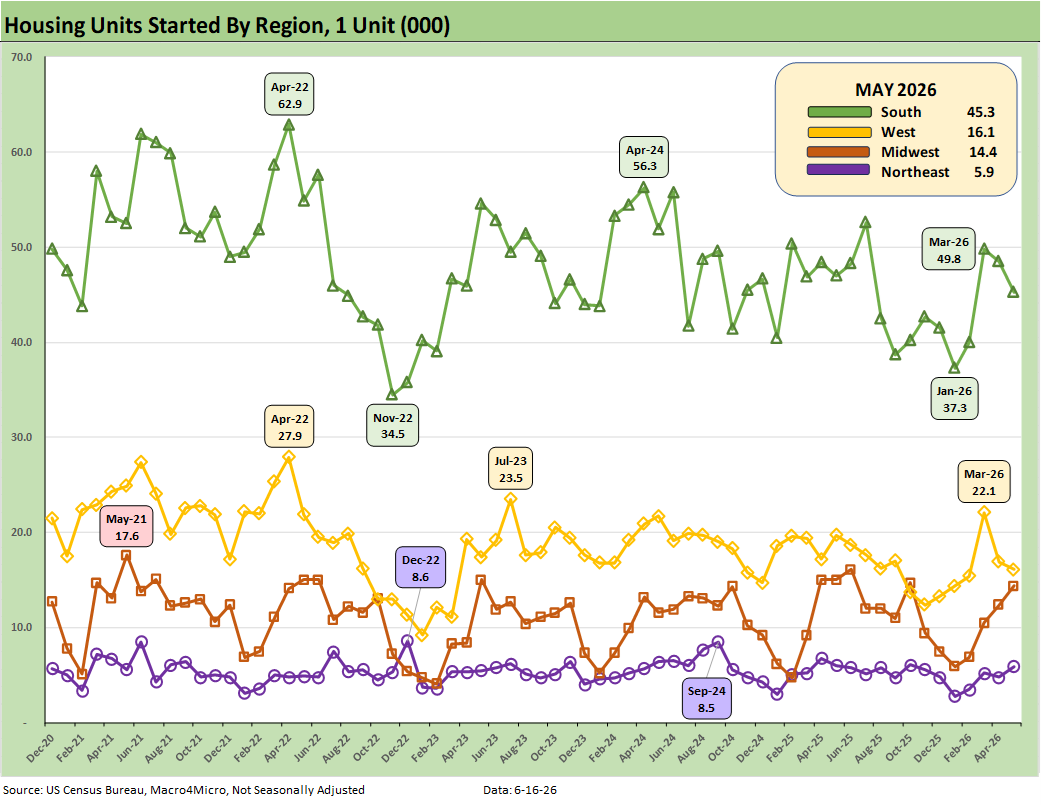
The above plots the single family starts by region (NSA). On a MoM basis, the critical South region (totals over 49% of total NSA starts and over 55% of single family starts) was down slightly in single family by -1.2% MoM and down by -7.0% YoY. The West as the #2 single family market (20% of total) was down MoM by -4.7%. The Midwest region MoM in single family was +16.1% with the small Northeast market at +22.9% MoM. The YoY NSA starts were mixed with the South and West both lower among the big two regions. The Midwest and Northeast were both higher.
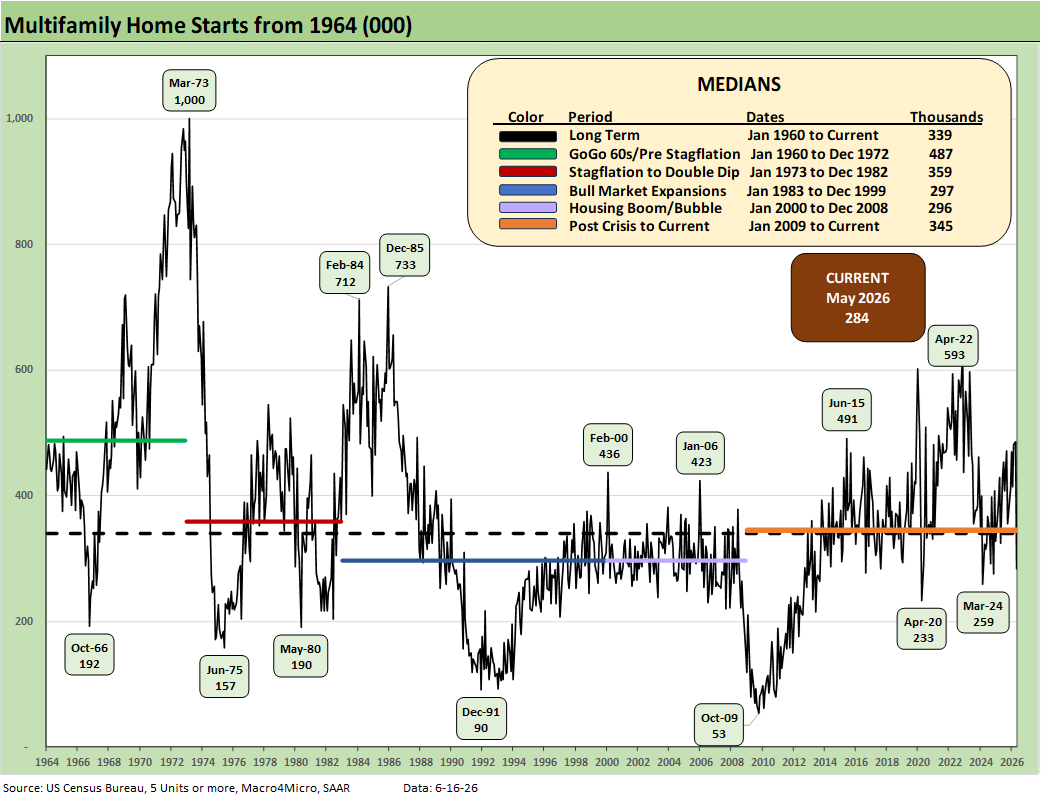
The above chart updates running multifamily starts. At +284K (SAAR), May 2026 declined by -41.6% MoM and by -12.3% YoY. The 284K is well below the long-term median of 339K, below the median from Jan 2009 to current (345K), and below the median from 2000 to 2008 (296K).
The 1960s was a period of explosive growth for multifamily with the back end of the baby boom, the postwar rise of urbanization, and the high racial migration from the South to the North all part of the multifamily tailwinds. Immigration also played an important role.
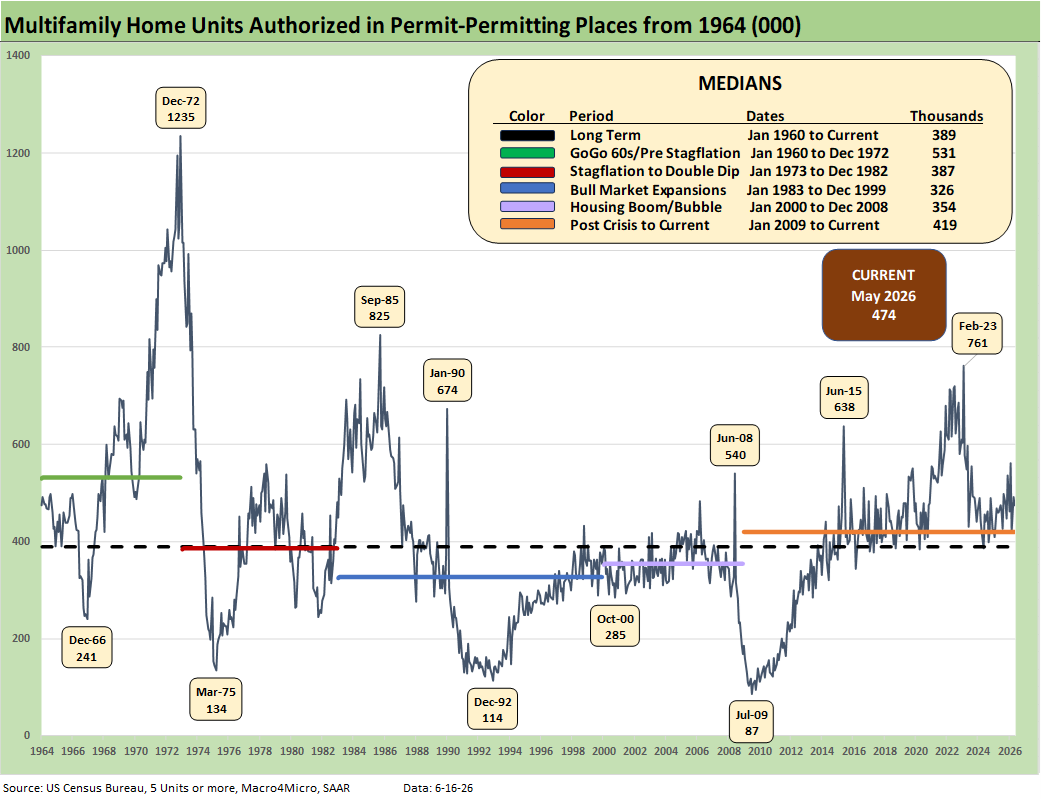
The above chart updates Multifamily permits (SAAR). The 474K in May 2026 multifamily permits declined by -3.5% MoM and was up by +3.0% YoY.
The bottom line on home starts as we move further into the peak selling season is that 2026 is shaping up as a mediocre year at best for homebuilders. This is consistent with the guidance we are getting from the major homebuilders.
See also:
Industrial Production May 2026: Steady, Balanced Utilization Levels 6-15-26
Market Commentary: Asset Returns 6-14-26
Geopolitical risk: Trump’s Nuclear Saber Rattling? 6-14-26
Producer Price Index May 2026: Too Many “Since 2022” References 6-11-26
CPI May 2026: The 4% Rubicon 6-10-26
Remembering D-Day: June 6, 1944
Employment May 2026: Big Rebound, Low Multiplier Bias 6-5-26
The Fall of CBS 6-3-26
JOLTS April 2026: A Modestly Positive Turn 6-2-26
Retail Signal Read Part Deux 6-1-26
New Home Sales April 2026: Slow Start to Spring 5-28-26
PCE Inflation: Income and Outlays April 2026 5-28-26
GDP 1Q26 Second Estimate: Shrunk in the Dryer 5-28-26
Retail Equity Comps: Looking for Signals 5-26-26
D.R. Horton: Financial Powerhouse Despite Cyclical Softening 5-20-26